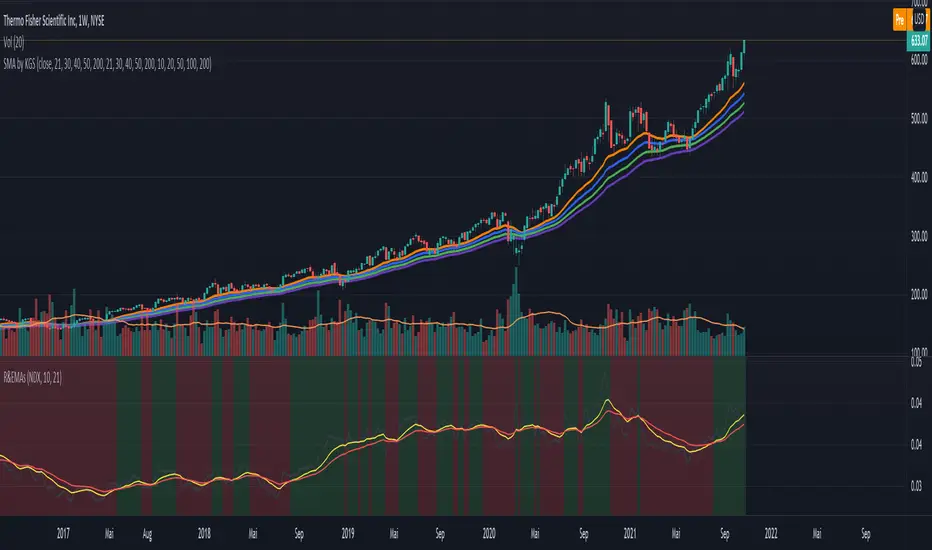
Ratio (Relative Strength) & EMAsRatio (Relative Strength) & EMAs
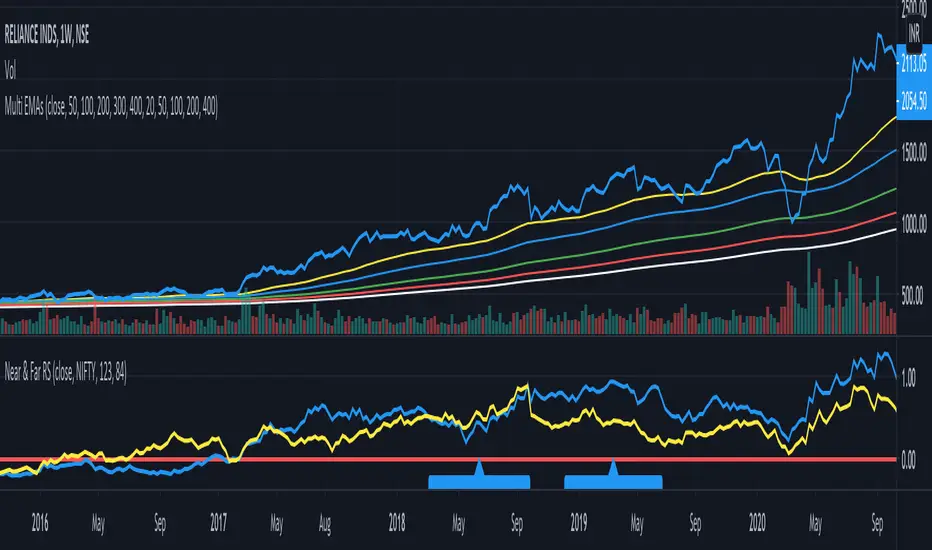
This indicator is used to compare the actual symbol with another one by calculating the ratio. EMA1 and EMA2 of the ration are shown as well. The idea is to choose an index like the NDX or SPX for comparison and to determine if the actual symbol outperforms the index or not - separate the wheat from the chaff. The rules are as follow:
When the calculation ratio (symbol divided ratio symbol) is above EMA1 and EMA1 is above EMA2) the background turs green. If not the background turn red.
Indicador Pine Script®