Camarilla Pivots - H5/L5 and H6/L6 addedI am a big fan of Camarilla Pivots so I thought the missing 5 and 6 levels with be useful sometimes.... like with big moves when you don't know how low or high can it go once it passed the final levels of SR (H4 and L5 in Camarilla case). Well, today's free fall of AAPL would've been stopped by the L5 and 6. HTTPS://WWW.TRADINGVIEW.COM/CHART/WXPCE8MK/#
Buscar en scripts para "camarilla"

Camarilla Pivots using Heikin Ashi by SeloriaPlots Heikin-Ashi Camarilla levels and alerts you when the market gets close to any of these levels.

Camarilla Pivot Points Backtest Pivot point studies highlight prices considered to be a likely turning point
when looking at values from a previous period, whether it be daily, weekly,
quarterly or annual. Each pivot point study has its own characteristics on
how these points are calculated.
Red color = Sell
Green color = Buy
WARNING:
- For purpose educate only
- This script to change bars colors.
Camarilla Pivot Points Strategy Pivot point studies highlight prices considered to be a likely turning point
when looking at values from a previous period, whether it be daily, weekly,
quarterly or annual. Each pivot point study has its own characteristics on
how these points are calculated.
Red color = Sell
Green color = Buy
WARNING:
- For purpose educate only
- This script to change bars colors.

Camarilla Pivot Points V1 Pivot point studies highlight prices considered to be a likely turning point
when looking at values from a previous period, whether it be daily, weekly,
quarterly or annual. Each pivot point study has its own characteristics on
how these points are calculated.
WARNING:
- For purpose educate only
Camarilla Pivots (D,W,M) Secrets of a Pivot BossPrimarily for equities as no provision has been made to control the timing at which the open close high low are determined, indeed, I see no straightforward mechanism to do so in Pinescript.
Development aided by: but with the entirely different calculations presented in "Secrets of a Pivot Boss" by Franklin Ochoa. And far cleaner and less-redundant code.
To trade the indicator, watch the H3,H4,H5 and L3,L4,L5 bars. There are two built-in strategies. Depending on pivot width, sell at H3 and buy at L3 with stop at H4/L4 or above. For strongly trending environments: buy at H4, cover at H5--similarly for downtrends.

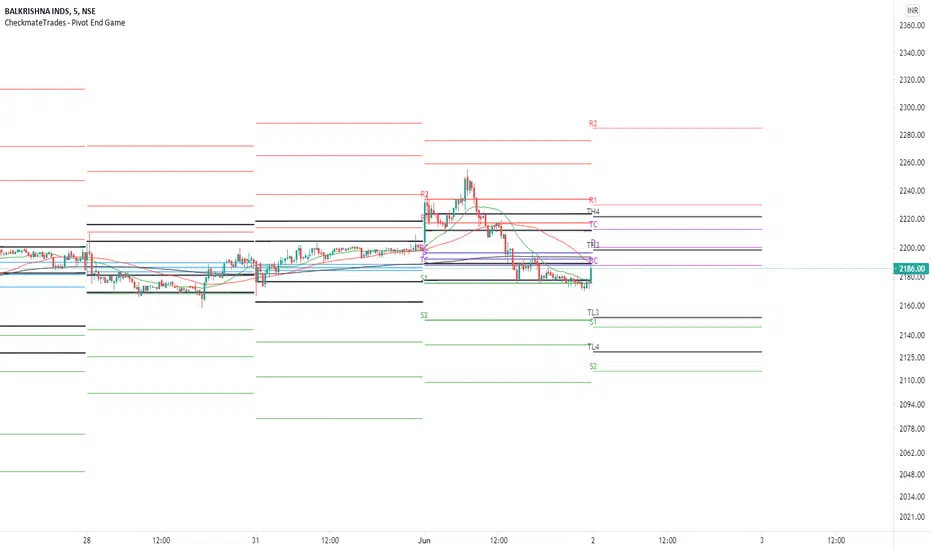
CheckmateTrades - Pivots End GameThis indicator is based on the Pivot study. Traders will be able to plot CPR, Standard floor pivots as well as Camarilla Pivots on multiple timeframes.
Why pivots from multiple timeframes are relevant and included in this one indicator?
We can analyse pivots on multiple timeframes for different trading setups. As in, Daily floor pivots are best suited for analysing the market trend for Day trading. Similarly, Weekly and Monthly floor pivots can be analysed for Swing and positional trading entries. Whereas yearly pivot is best suited for trend analysis for investment purpose.
What is the relevance of plotting tomorrow's pivot level in advance?
Pivot are calculated based on the price happened on a previous day. And hence trader can plot tomorrow pivots in advance to shortlist stocks for tomorrow's trading session.
TimeFrames Available to traders are –
1. Daily
2. Weekly
3. Monthly
A) Daily Pivots
Present Day –
1. Trader can plot Daily CPR
2. Trader can plot Daily R1, R2, R3 and R4 pivot resistance levels
3. Trader can plot Daily S1, S2, S3 and S4 pivot support levels
4. Trader can plot Daily Camarilla levels
Future Day –
1. Trader can plot Tomorrow CPR
2. Trader can plot Tomorrow R1, R2, R3 and R4 pivot resistance levels
3. Trader can plot Tomorrow S1, S2, S3 and S4 pivot support levels
4. Trader can plot Tomorrow Camarilla levels
5. Previous Day High and Low
B) Weekly Pivots
Present Week –
1. Trader can plot Present week CPR
2. Trader can plot Present week R1, R2, R3 and R4 pivot resistance levels
3. Trader can plot Present week S1, S2, S3 and S4 pivot support levels
4. Trader can plot Present week Camarilla levels
Next Week –
1. Trader can plot Next week CPR
2. Trader can plot Next week R1, R2, R3 and R4 pivot resistance levels
3. Trader can plot Next week S1, S2, S3 and S4 pivot support levels
4. Trader can plot Next week Camarilla levels
5. Previous Week High and Low
C) Monthly Pivots
Present Month –
1. Trader can plot Present Month CPR
2. Trader can plot Present Month R1, R2, R3 and R4 pivot resistance levels
3. Trader can plot Present Month S1, S2, S3 and S4 pivot support levels
4. Trader can plot Present Month Camarilla levels
Next Month –
1. Trader can plot Next Month CPR
2. Trader can plot Next Month R1, R2, R3 and R4 pivot resistance levels
3. Trader can plot Next Month S1, S2, S3 and S4 pivot support levels
4. Trader can plot Next Month Camarilla levels
5. Previous Month High and Low
Moreover, I have also included SMA (Simple moving averages) study in this indicator. Trader can add 20,50 & 200 SMA on there charts.
Why is it relevant? Trader can get a visual confirmation of an up-trending or an down-trending move by looking at rising or falling 20 & 50 SMA respectively
Usually in an uptrending stocks. 20 & 50 SMA will move in parallel to each other and will rise upwards. Price will tend to trade above the 20 SMA and 20 SMA will continue to act as a support.
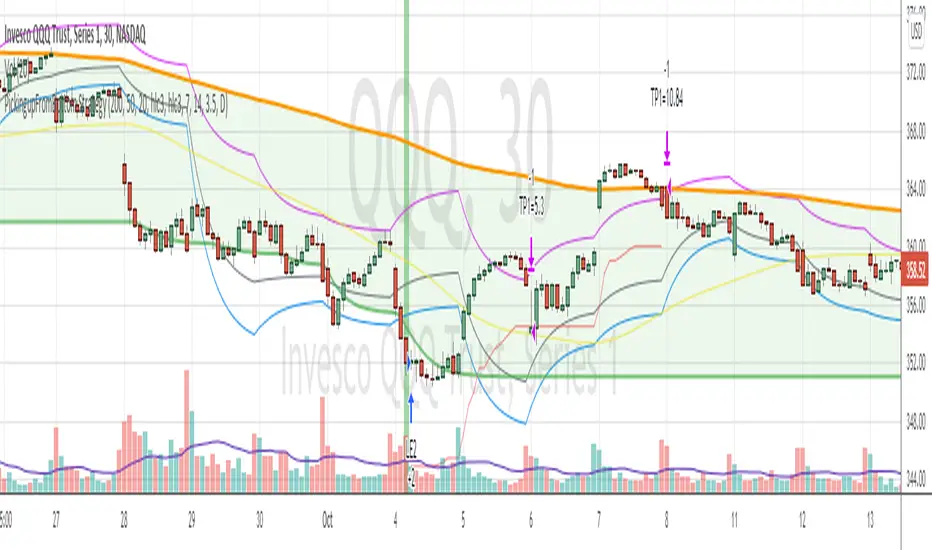
PickingupFromBottom StrategyPickingupFromBottom Strategy is variation of my earlier strategy HiLoBand
This strategy uses lowest lows of 200 and ema of that with length 7. Lets call this ema200Lows line
wait for price to close below ema200Lows line
Then using camarilla pivot points , wait for camariall centerpoint (actally ema 9 of that ) crossing up the ema200Lows line.
When this condition is met background color is changed to green (visual alert)
and BUY Long is taken
Exit
When the price crosses below the Camarilla R4 line or Camarilla S3 line
Tested with SPY and QQQ on 30 mins chart.
Warning
This strategy is published for educational purposes only.
GOLDEN Trading System by @thejamiulThe Golden Trading System is a powerful trading indicator designed to help traders easily identify market conditions and potential breakout opportunities.
Source of this indicator :
This indicator is built on TradingView original pivot indicator but focuses exclusively on Camarilla pivots, utilising H3-H4 and L3-L4 as breakout zones.
Timeframe Selection:
Before start using it we should choose Pivot Resolution time-frame accordingly.
If you use 5min candle - use D
If you use 15min candle - use W
If you use 1H candle - use M
If you use 1D candle - use 12M
How It Works:
Sideways Market: If the price remains inside the H3-H4 as Green Band and L3-L4 as Red band, the market is considered range-bound.
Trending Market: If the price moves outside Green Band, it indicates a potential up-trend formation. If the price moves outside Red Band, it indicates a potential down-trend formation.
Additional Features:
Displays Daily, Weekly, Monthly, and Yearly Highs and Lows to help traders identify key support and resistance levels also helps spot potential trend reversal points based on historical price action. Suitable for both intraday and swing trading strategies.
This indicator is a trend-following and breakout confirmation tool, making it ideal for traders looking to improve their decision-making with clear, objective levels.
🔹 Note: This script is intended for educational purposes only and should not be considered financial advice. Always conduct your own research before making trading decisions.

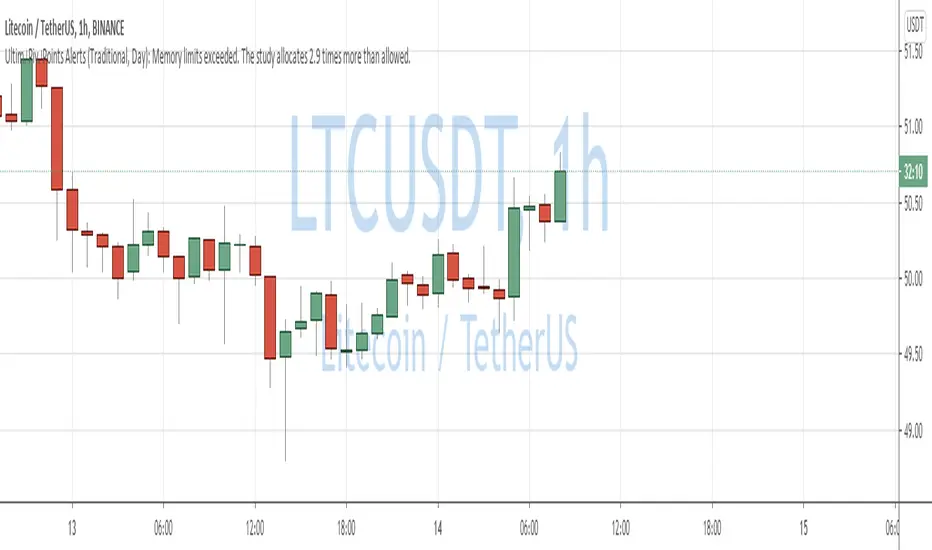
QuantNomad - Ultimate Pivot Points AlertsCreated a universal script for pivot points alerts.
In the script, you can choose one of 4 pivot point types: Traditional, Fibonacci, Woodie, and Camarilla.
You are able to create separate alerts for every level or create one for price crossing any level.
For separate levels, you can choose: "Cross", "Crossover" and "Crossunder".
You can also choose to show/hide:
Historical Levels
Levels Values
Current Levels - Levels calculated on the current period, on close of the period they will become valid levels for next periods. These levels do not participate in alerts calculations.
Because of some TradingView limitations, alerts won't be fired for the first bar of the session.
In the script used new v4 plotting features, so will be able to plot levels and labels nicely. Unfortunately, there is a limit on the number of consecutive lines you can plot on the plot (around 50), so historical lines in the past will disappear after 6-7 periods.
And remember:
Past performance does not guarantee future results.
Dynamic Pivot Box for Month and YearThe basic idea of the ‘Dynamic Pivot Box’ is to show only the Pivots that are closer to the Price. This is, the nearest pivots acting as support and resistance; thus hiding all other pivots which are further away from the price and also hiding the pivots from previous periods… Pivots will be hidden until price breaks out from the current box and moves to the next one. Hopefully, with this change you can focus more on the actual price action/ price patterns on the chart rather than on several/ noisy lines on the screen.
**Please note that the recommended use for this indicator is on the daily or higher timeframes if you want to see Year pivots... Monthly pivots can be still seen on the hourly chart, but I am afraid that lower timeframes will not plot the indicator properly.**
The Pivots are taken from Frank Ochoa’s book ‘Secrets of a Pivot Boss’, so if you are not familiar with them, I would recommend you to first take a look at the theory behind them.
The Pivots in this indicator are divided in two groups: ‘Standard pivot’ and ‘Camarilla’ pivots.; and then this latter is group is divided in two also: the ‘Main Camarilla’ and ‘Regular Camarilla pivot’. You can select which groups of pivots are taken into account for the ‘Dynamic Pivot Box’.
If you decide to select all Three Groups: ‘Standard Pivot’, ‘Main Camarilla’ and ‘Regular Camarilla pivot’ you will see ALWAYS 4 pivots surrounding the price. My recommendation is to select only ‘Standard Pivot’ and ‘Main Camarilla’ so that you see only between 2-3 pivots on the screen. This recommended view is actually the default settings.
In addition, if you want to further reduce noise from the chart, you can unselect the ‘Lines’ option within the SETTINGS/ STYLE menu.
What you see on the chart/sample is actually this indicator plotted twice:
1. Year Pivots which have the default settings and are shown as white ines
2. Month Pivots have also the default settings BUT I also selected the option ‘Previous Pivots’ to show the pivots from previous period , and also I unselected the ‘Lines’ options as mentioned above to reduce noise.
You are more than welcome to enhance the current version, my only ask is to please share the enhanced version back with the community. I wish I could make amends or modify the current version myself but I actually just came up with the idea and I paid a coder in Fiverr to develop it.

Floor Pivots With CPR and Camarilla 3 LevelsThis script plots floor pivots with the central pivot range and camarilla R3/S3 pivots, to spot with ease the Golden Pivot Zone (GPZ). As described in the book *Secret of a pivot Boss* by Franklin Ochoa, the Golden Pivot Zone occurs when R3 or S3 pivot from the Camarilla Equation or from lies within the central pivot range. This combination can be simply profitable.
A bearish GPZ occurs when R3 of the Camarilla Equation is mixed within the central pivot range, therefore we should look for sells in that zone.
A bullish GPZ occurs when S3 of the Camarilla Equation is mixed within the central pivot range, therefore we should look for buys in that zone.
Here are some examples on Gold
Good luck !
Ps* i got part of the code from @cristian.d script

EMA & Camarilla StrategyChat GPT based , 20, 200 EMA Strategy
This script calculates EMAs (5, 20, and 200), Camarilla Pivot Points, and checks for your specified candlestick pattern conditions. It then generates buy and sell signals based on the EMA crossover and the candlestick pattern. Stop loss is calculated as the lowest low of the last 5 bars, and the target is set at the Camarilla pivot point (you can customize these values).

JxModi CamarillaAddition to the Camarilla Pivots, This script will allow user to Add 4+1 more Indicators -EMA-9/20/50/200 & VWAP .
As well EMA can be change.
All the Support(L) and Resistance(H) levels can be enabled / disabled from settings. It will allow to select multiple combinations of support(L) & Resistance(H) levels across levels at any of the Time-frames individually and combined.
All EMA & VWAP Indicators can be can be enabled / disabled from settings.
Camarilla pivots Support(L) & Resistance(H) levels Can be Changed for any of the Time frames.
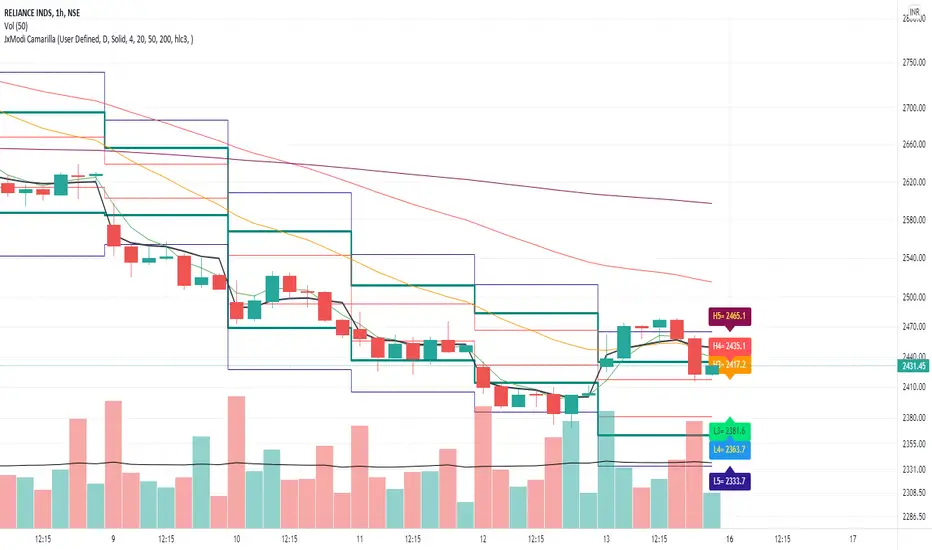
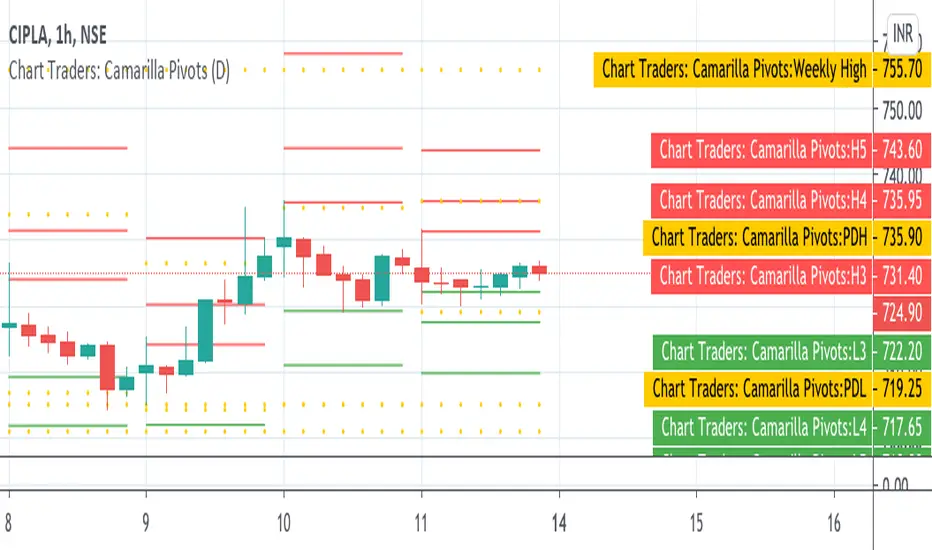
Chart Traders: Camarilla PivotsChart Traders: Camarilla Pivot point indicator gives you support and resistance level.
This indicator give (h1 to H5) five resistance level and (L1 to L5) support level. You can buy at any support level with reversal sign and sell at resistance with reversal sign.
In this indicator you can also see the next day Camarilla pivot points.
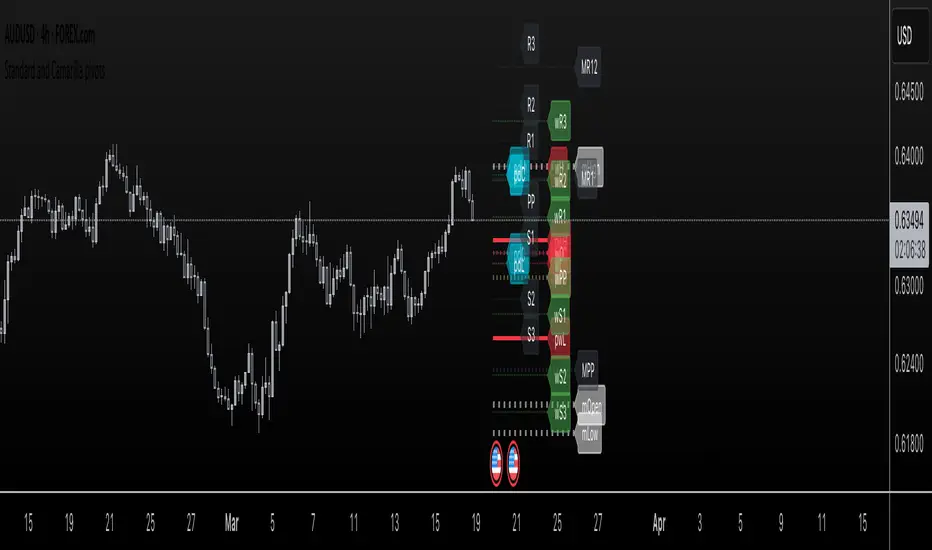
Standard and Camarilla pivotsHi guys, I would like too introduce to all of you my script. As the name already tell you what this script is all about. It's about pivot points.
You may ask, Tradingview already have a script for pivot points, why would I need another script?
here is the answer: This script allow you to add more than one type of pivot, sounds good right?
But there's more: You can see not just one timeframe pivots, you can see many timeframe pivots, nice huh?
let dive into it to know a bit more.
In this script you can see daily pivots include Standard pivots as R1, R2, R3 and Camarilla pivots as cR1, cR2, cR3, and I you different color for different pivots, so you don't confuse between those two.
You can see weekly pivots the same as daily pivots only has letter "w" in front of it, for examples: "wR1, wR2, wcR1, wcR2" ,nice right?
What's about month level: yes, you can see monthly pivots too, and it start with "m".
Along with pivots points above, you also can see daily open, previous day close, previous high,.., for instances: daily open as "O", previous day open as "PDO",
You are able to see previous week level, previous month levels.
have fun.
I dont wanna lock this script because open-source script help me learn how to code pine script, so that's why I keep it open. Thank to all the coders out there that shared everything they have for us to learn.
Tomorrow CamarillaThis indicator will help you to find the next day camarilla pivots
note: you need to customise the settings use #ENABLE PRICE LINE# then you got the next day line on your chart

Bank Nifty ScalpingThis indicator is designed for scalping purposes.
Users have the option to input the desired source and enable or disable the following indicators:
Multiple EMA (Exponential moving average)
Simultaneously displays multiple moving averages to quickly identify shifts in momentum and obtain confirmation from slower-moving averages.
By default, the EMA display settings are configured to show the 20-day EMA and the 200-day EMA. However, users have the flexibility to modify the display settings according to their preferences. This means that users can customize the indicator to show the EMA values of their choice, such as EMA 50 and EMA 100.
VWAP ( Volume weighted average price )
Default value is set to ‘hl2’
A bullish trend is indicated when the price is above the Volume Weighted Average Price (VWAP), while a bearish trend is indicated when the price is below the VWAP.
VWMA ( Volume weighted moving average )
In the VWMA (Volume Weighted Moving Average) indicator, a default value of 20 is used. If the price is higher than the VWMA, it typically indicates a bullish trend. Conversely, if the price is lower than the VWMA, it suggests a bearish trend. The VWMA takes into account both price and volume, providing a weighted average that can help identify shifts in market sentiment.
Multiple SuperTrends
Default value is 10 and 2 / 10 and 3
A bullish trend is identified when the price is above the SuperTrend indicator, whereas a bearish trend is observed when the price is below the SuperTrend indicator.
Camarilla Pivot Points (Level 3 and 4 only)
Levels 3 and 4 serve as crucial support and resistance levels, acting as the final line of defense against strong trends. These levels are expected to generate reversals, where price often changes direction.
CPR ( Central Pivot Points)
The Daily Central Pivot Point Indicator is a popular tool used in technical analysis. It calculates several levels based on the previous day's high, low, and closing prices.
Strong Volume
The user has the ability to set the average volume for Nifty and BankNifty indices to calculate strong volume.
Elder Impulse System
The Impulse System, developed by Alexander Elder and discussed in his book "New Trading for a Living," is a censorship trading system designed to determine whether a trade should be allowed or prohibited. Additionally, it can be used to identify when a trend is starting to weaken. The Impulse System relies on the following factors:
1. Slope of a Fast Exponential Moving Average (EMA): The fast EMA's slope reflects the price's inertia or momentum.
2. Slope of the Moving Average Convergence Divergence (MACD): The MACD's slope indicates the strength or power of the price movement.
Based on these factors, the Impulse System categorizes candles or price bars into three colors:
* Green Candle: When both the fast EMA and MACD are rising, indicating upward momentum.
* Red Candle: When both the fast EMA and MACD are declining, suggesting downward momentum.
* Blue Candle: In all other cases where the conditions for green or red candles are not met, representing a neutral or uncertain market condition.
By applying the Impulse System, traders can gain insights into the market trend, its strength, and potential shifts in momentum, helping them make informed trading decisions.
Happy Trading

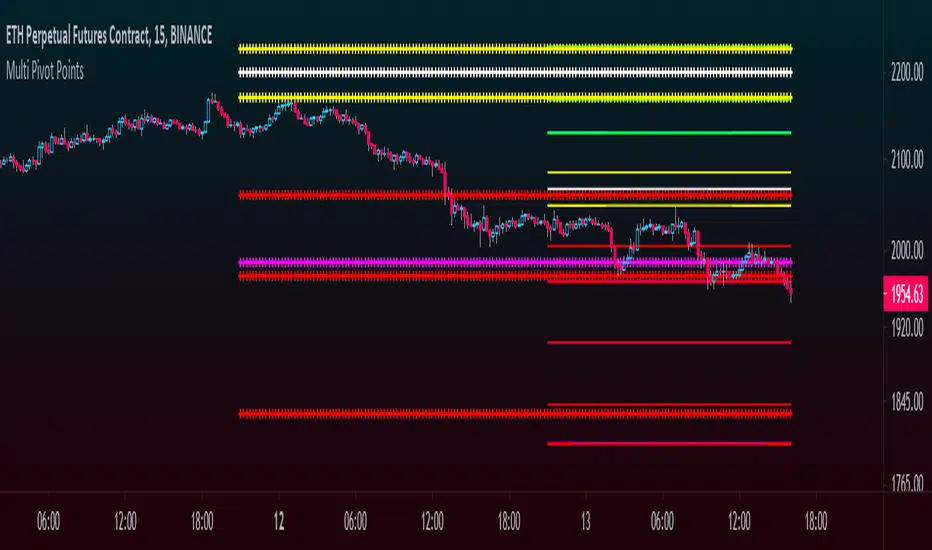
Multi Pivot Points - All in One IndicatorThis multi pivot indicator allows you to plot and overlay different types of pivot points:
-Fibonacci
-Floor Traders
-Camarilla
In addition to this, you can plot pivots from two different timeframes of your choice, for example the daily & weekly pivots, monthly & yearly, etc.
-You can select the linestyle, width and color of each pivot type for easy recognition of levels.
-You can choose to show only the current set of pivots or you can show the historical levels too.
This indicator allows traders to search for high probability targets or support and resistance zones via the confluence of both different pivot types and timeframes. These levels can work for either day traders or longer terms traders.
In the case of Fibonacci levels these can be chosen in the menu.
Enjoy!!
Pivots Info CamarillaSo by request of a user i just made this camarilla pivots
level are shown in info. try to adjust the info offset so it will be correctly on your screen
also when close above the pivots level you have another info panel for it lime if close above the level and red if vice versa
so i hope its will help you in your trades

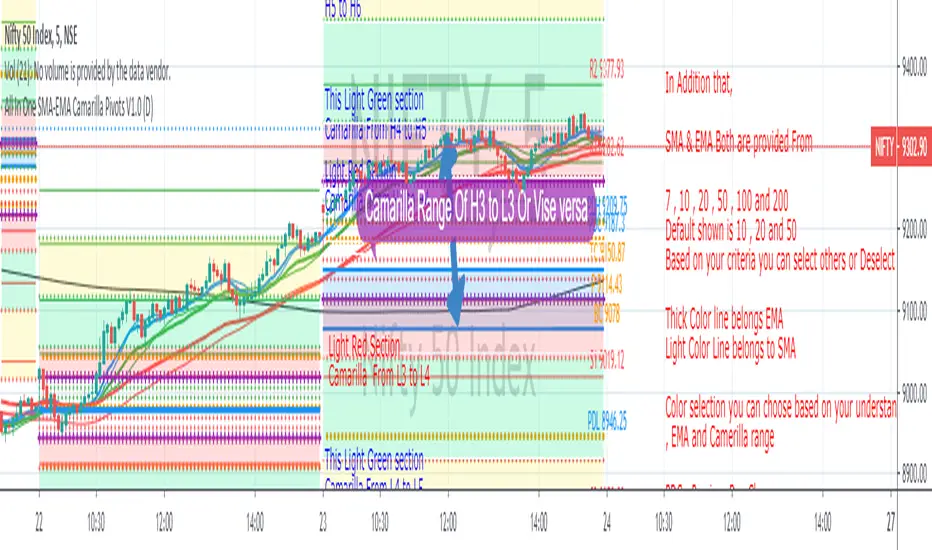
All In One SMA EMA Camarilla Pivots V1.0Hello Every One,
This Script Basically Helps in order to have Multiple things in one place like
MA
EMA
Camarilla Pivots - this is range where you no need to remember levels, with color you can see candles are in which range.
Pivots , Previous Day High Low and close
Hope this will helpful.