BTC Cycle High IndicatorWith high probability show BTC price cycle highs. When price touches the white line, and when yellow and red moving averages cross, we will most likely have our next BTC cycle price high.
Based on Philip Swift's analysis (@positivecrypto)
Buscar en scripts para "btc期权交割时间"

What is ProfitableBTC, BNB or your favorite Alt Coin? This indicator shows what is profitable at the moment. Red bars are alt days, green bars are BTC days. Otherwise, it is a BNB day.
Hmm, most of the time it is a BNB day!

BTC Futures Settlement Dates - Life Zoltar InvestingThis is a TradingView script to map out the BTC Futures Settlement Dates. There was one floating around the internet but it was old and wasn’t updated. I took that, changed up the code and created this. Orange is CBOE and Blue is CME. You’ll notice shortly after the highlighted closed date, BTC starts to trend upwards.
Data from the below:
CBOE: cfe.cboe.com
CME: www.cmegroup.com

BTC STH Proxy vs Realized Price (RP) Ratio | STH : LTH📊 REALIZED PRICE MARKET SIGNAL
Indicator that builds a Short-Term Holder (STH) price proxy using a configurable moving average of Bitcoin’s market price and compares it to Bitcoin’s Realized Price (RP) derived from on-chain data.
Realized Price (RP) is calculated from CoinMetrics Realized Market Cap divided by Glassnode circulating supply.
STH Proxy is a user-defined moving average (EMA/SMA/WMA) of BTC price, designed to mimic the behavior of the true STH Realized Price.
Users can adjust the MA type, length, and RP smoothing to closely replicate the STH curve seen on Glassnode, Bitbo, and Bitcoin Magazine Pro.
Optionally, the indicator can display the STH/RP ratio, which highlights transitions between market phases.
This tool provides a simple but effective way to visualize short-term vs long-term holder cost-basis dynamics using only publicly accessible on-chain aggregates and price data.
----------
💡TLDR: An alt take on the Short-Term Holder Realized Price / Long-Term Holder Realized Price cross model | (STH/LTH cross)
- A mix of MAs are used to mimic STH.
- RP here used as a proxy for the long-term holder (LTH) cost basis.
- Bull/Bear signals are generated when the STH proxy crosses above or below RP.
⭐ Free to use • Leave feedback • Happy trading!

BTC – LEVR: Leverage Efficiency & Volume RatioLEVR: Leverage Efficiency & Volume Ratio
Observation-only. Data: IntoTheBlock.
Overview
The Leverage Efficiency & Volume Ratio (LEVR) is a market structure oscillator designed to detect "Paper Bubbles" and "Organic Bottoms" by separating speculative greed from network utility. While most indicators analyze price action, LEVR analyzes market fragility. It operates on the thesis that Sustainable Rallies are driven by Spot/Network Activity, while Fragile Rallies are driven by Derivatives Leverage.
Synergy
How it works with VERI
LEVR is designed to be the tactical counterpart to the fundamental VERI Indicator (Valuation & Entity Ratio Index).
Use VERI for Strategy: To identify Value. (Is Bitcoin cheap? Are Whales buying?)
Use LEVR for Risk: To identify Structure. (Is the current price move real, or is it a leverage bubble about to pop?)
The "Perfect Setup"
The strongest buy signals occur when VERI is in the Accumulation Zone (Whales buying) AND LEVR is in the Organic Zone (Leverage is flushed out) (as it was the case in the Dec 2022 Bear Market Bottom).
Why LEVR is Unique
Standard indicators often fail to contextualize Open Interest:
vs. Raw Open Interest: Raw OI always trends up over time as the market grows. LEVR solves this by normalizing OI against Active Addresses. This reveals when leverage is outpacing actual adoption.
vs. ELR (Estimated Leverage Ratio): Classic ELR divides Open Interest by Exchange Reserves. However, Exchange Reserves are notoriously difficult to track accurately. LEVR uses Active Addresses (Network Utility) as a cleaner, more reliable denominator for network health.
Methodology
The Mathematics: The indicator calculates a normalized Z-Score ratio between two IntoTheBlock datasets:
The Numerator (Greed): Perpetual Open Interest. The total dollar value of all open futures contracts. This represents the "Gambling" capital.
The Denominator (Utility): Active Addresses. The number of unique addresses transacting on-chain. This represents the "Real" user base.
The Formula : LEVR = Z-Score ( Perpetual Open Interest / Active Addresses )
How to Interpret the Visuals
The line color changes dynamically to reflect the current risk regime:
🟥 Speculative Premium (Red Line > 2.0) :
Signal: "Leverage Bubble."
Context: Open Interest is rising significantly faster than User Growth. The rally is fueled by debt.
Risk: High probability of a "Long Squeeze" or liquidation cascade.
🟦 Organic Base (Blue Line < -1.5) :
Signal: "Spot Driven Market."
Context: Speculators have been flushed out, but active network usage remains high. The line turns Blue to signal a healthy opportunity zone.
Risk: Low. Historically marks robust bottoms where hands are strong.
🟧 Neutral (Orange Line) :
The market is in a transition phase between organic growth and speculation.
Settings & Inputs
Users can customize the sensitivity of the Z-Score to fit their trading style (in brackets their current standard value):
Lookback Period (365) : The rolling window used to establish the "Baseline." A 365-day window captures the yearly trend.
Signal Smoothing (7) : A short moving average to reduce daily data noise.
Bubble Zone Top/Bottom (3.0 / 2.0) : The thresholds for the Red Zone. Raising the "Top" value will only show the most extreme, generational leverage bubbles.
Organic Zone Top/Bottom (-1.5 / -2.5) : The thresholds for the Green Zone. Lowering these values requires a deeper "flush" to trigger a signal.
Optimization
This indicator is mathematically optimized for the Daily (1D) timeframe. Using it on lower timeframes may result in noise due to the daily resolution of on-chain data.
Important Note on Historical Data
Please be aware that aggregated global Perpetual Open Interest data only becomes reliable and widely available starting around 2020-2021.
Pre-2021: The indicator will show a flat line or empty values. This is not a bug; it reflects the lack of historical derivatives market data for that period.
2021-Present: The indicator functions fully as intended.
Credits
Concept inspired by the "Estimated Leverage Ratio" (ELR) popularised by CryptoQuant and analysts like Willy Woo. LEVR adapts this concept for TradingView by substituting Exchange Reserves with Network Activity for better reliability.
Disclaimer
This tool is for research purposes only. It visualizes market structure data and does not constitute financial advice.
Tags
bitcoin, btc, open interest, leverage, on-chain, intotheblock, risk, derivatives, levr, veri

BTC - VERI - Valuation & Entity Ratio IndexVERI: Valuation & Entity Ratio IndexObservation-only.
Data: IntoTheBlock.
Overview & Philosophy
The name VERI is derived from the Latin Veritas (Truth). In a crypto market often driven by deceptive speculative noise, this indicator seeks to establish the "On-Chain Truth" of a price trend.
It operates on the thesis that price action is only sustainable when verified by high-conviction capital flows.VERI is a fundamental composite oscillator that fuses Entity Behavior (Who is holding?) with Network Valuation (Is the price fair?) to identify Bitcoin market cycle extremes.
The "Alpha"
Why this Composite stands out: on-chain metrics often tell only half the story.
MVRV tells you if the price is cheap, but not if anyone is actually buying.
Whale Activity tells you if large players are moving, but not if they are accumulating at a value discount.
VERI fuses these two dimensions into a single Z-Score. It identifies the rare, high-probability moments where Smart Money Conviction intersects with Deep Value.
Methodology
The Mathematics of VERI: The indicator constructs a composite index using three fundamental metrics from IntoTheBlock:
The "Who" (Entity Ratio) : We calculate the flow ratio between Whales (>1% supply holders) and Retail (<0.1% supply holders). A rising ratio indicates supply is transferring from weak hands to strong hands.
The "Why" (Valuation Multiplier) : We utilize the MVRV (Market Value to Realized Value) ratio. To isolate value opportunities, we use the inverse (1 / MVRV).
The Fusion : These factors are multiplied to create the raw VERI index.
Normalization & Inversion
We apply a rolling Z-Score (standard deviation from the mean) and invert the result.
How to Interpret the Indicator
Because the output is inverted, the visual logic matches price action intuitively:
🟥 Distribution Zone (High Values > 1.5):
The Signal: "Low Conviction Overvaluation."
Context: The price is historically expensive relative to the cost basis (High MVRV), and Whales are distributing coins to Retail.Implication: Historically precedes macro tops or deep corrections.
🟩 Accumulation Zone (Low Values < -1.5):
The Signal: "High Conviction Undervaluation."Context: The price is historically cheap (Low MVRV), and Whales are aggressively accumulating relative to Retail.
Implication: Historically precedes macro bottoms and generational entry points.
Zero Line : Represents the historical baseline. A crossover of the zero line often confirms a regime shift (e.g., from Bear to Bull).
Visual Guide & Features
Dynamic Coloring: The line turns Red in the Distribution Zone, Blue in the Accumulation Zone, and Orange during neutral trends.
Zone Labels: Static labels are pinned to the left side of the chart for immediate context.
The "Data Check" Monitor (Status Table): Since this indicator relies on third-party fundamental data, we have included a diagnostic table in the bottom-right corner.
Data Check Monitor Guide
STATUS: LIVE (Green): The indicator is functioning correctly. All data feeds (Whales, Retail, MVRV) are being retrieved successfully.
STATUS: WAIT (Red): The indicator cannot retrieve data. This might happen for some reasons, e.g. your TradingView plan may not support IntoTheBlock integration.
Settings
Lookback Period (Default: 365): The window used for Z-Score normalization. We use a full year to smooth out seasonal volatility.
Smoothing (Default: 7): A 7-day smoothing is applied to the signal to filter out daily noise.
Zone Thresholds: Users can customize the specific Z-Score levels for the Distribution and Accumulation bands.
Disclaimer
This script is for research and educational purposes only. It uses historical on-chain data to visualize market structure and does not constitute financial advice. Past performance of whale entities does not guarantee future results.
Tags
bitcoin, btc, on-chain, mvrv, whales, valuation, fundamentals, cycle, oscillator, veri

BTC Dashboard D / 4H / 1H (simple)//@version=5
indicator("BTC Dashboard D / 4H / 1H (simple)", overlay = true)
// ---------- Réglages ----------
rsiLen = 14
emaLen50 = 50
emaLen200 = 200
// Petite fonction pour formater les nombres
f_fmt(float v) =>
str.tostring(v, format.mintick)
// ---------- TIMEFRAMES ----------
tfD = "D"
tf4H = "240"
tf1H = "60"
// ---------- DAILY ----------
closeD = request.security(syminfo.tickerid, tfD, close)
ema50D = request.security(syminfo.tickerid, tfD, ta.ema(close, emaLen50))
ema200D = request.security(syminfo.tickerid, tfD, ta.ema(close, emaLen200))
rsiD = request.security(syminfo.tickerid, tfD, ta.rsi(close, rsiLen))
// ---------- 4H ----------
close4H = request.security(syminfo.tickerid, tf4H, close)
ema504H = request.security(syminfo.tickerid, tf4H, ta.ema(close, emaLen50))
ema2004H = request.security(syminfo.tickerid, tf4H, ta.ema(close, emaLen200))
rsi4H = request.security(syminfo.tickerid, tf4H, ta.rsi(close, rsiLen))
// ---------- 1H ----------
close1H = request.security(syminfo.tickerid, tf1H, close)
ema501H = request.security(syminfo.tickerid, tf1H, ta.ema(close, emaLen50))
ema2001H = request.security(syminfo.tickerid, tf1H, ta.ema(close, emaLen200))
rsi1H = request.security(syminfo.tickerid, tf1H, ta.rsi(close, rsiLen))
// ---------- TABLE ----------
var table t = table.new(position.top_right, 4, 4, border_width = 1)
if barstate.islast
// Ligne d’en-tête
table.cell(t, 0, 0, "TF", text_color = color.white, bgcolor = color.new(color.black, 0))
table.cell(t, 0, 1, "Close", text_color = color.white, bgcolor = color.new(color.black, 0))
table.cell(t, 0, 2, "EMA50 / EMA200", text_color = color.white, bgcolor = color.new(color.black, 0))
table.cell(t, 0, 3, "RSI", text_color = color.white, bgcolor = color.new(color.black, 0))
// ----- DAILY -----
rowD = 1
table.cell(t, rowD, 0, "D", text_color = color.yellow, bgcolor = color.new(color.blue, 70))
table.cell(t, rowD, 1, f_fmt(closeD))
table.cell(t, rowD, 2, "50: " + f_fmt(ema50D) + "\n200: " + f_fmt(ema200D))
table.cell(t, rowD, 3, f_fmt(rsiD))
// ----- 4H -----
row4 = 2
table.cell(t, row4, 0, "4H", text_color = color.white, bgcolor = color.new(color.teal, 70))
table.cell(t, row4, 1, f_fmt(close4H))
table.cell(t, row4, 2, "50: " + f_fmt(ema504H) + "\n200: " + f_fmt(ema2004H))
table.cell(t, row4, 3, f_fmt(rsi4H))
// ----- 1H -----
row1 = 3
table.cell(t, row1, 0, "1H", text_color = color.white, bgcolor = color.new(color.green, 70))
table.cell(t, row1, 1, f_fmt(close1H))
table.cell(t, row1, 2, "50: " + f_fmt(ema501H) + "\n200: " + f_fmt(ema2001H))
table.cell(t, row1, 3, f_fmt(rsi1H))

BTC 1H Momentum + Near-Setup Alerts bigbeeukthis alert, sets up on 1h chart of BTC only. it alerts you to price action and when its close to a setup. it will then trigger again once the setup is ready

BTC Flow Dashboard (Spot Premium + OI + Funding)It builds a single flows dashboard that shows whether real spot demand (fiat buyers) or leveraged perps (futures traders) are driving BTC, and then cross-checks that with Open Interest (OI) and funding pressure—all normalized so you can spot regime shifts and squeeze risk fast.
How to read it (practical playbook)
Continuation (healthier trend)
Price ↑, premium > 0 and rising, oiZ ≥ 0 → spot sponsoring the move; perps chase → add on pullbacks.
Leverage-led & vulnerable
Price ↑, premium < 0, fundZ > 0 (expensive longs) → crowding → fade extensions / expect sharp pullbacks.
Buyable dip / absorption
Price ↓, premium ≥ 0 (spot supporting), oiZ flat/down, fundZ ≤ 0 → selling looks weak → scale into reversals.
Exhaustion / mean reversion
premZ ≥ +2 after a run → flows unusually hot → take profits / tighten risk.
premZ ≤ −2 into key support → capitulation risk but also bounce setups if OI/funding aren’t pressuring.

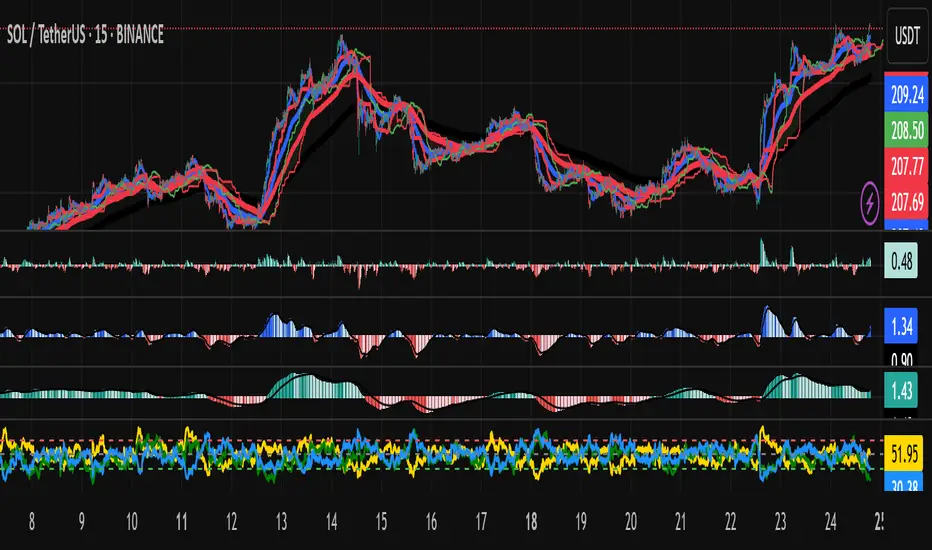
BTC 5-MA Multi Cross Strategy By Hardik Prajapati Ai TradelabThis strategy is built around the five most powerful and commonly used moving averages in crypto trading — 5, 20, 50, 100, and 200-period SMAs (Simple Moving Averages) — applied on a 1-hour Bitcoin chart.
Core Idea:
The strategy aims to identify strong bullish trends by confirming when the price action crosses above all key moving averages. This alignment of multiple MAs indicates momentum shift and helps filter out false breakouts.
⸻
⚙️ How It Works:
1. Calculates 5 Moving Averages:
• 5 MA → Short-term momentum (fastest signal)
• 20 MA → Near-term trend confirmation
• 50 MA → Mid-term trend filter
• 100 MA → Long-term trend foundation
• 200 MA → Macro-trend direction (strongest support/resistance)
2. Buy Condition (Entry):
• A Buy is triggered when:
• The price crosses above the 5 MA, and
• The closing price remains above all other MAs (20, 50, 100, 200)
This signals that momentum is aligned across all time horizons — a strong uptrend confirmation.
3. Sell Condition (Exit):
• The position is closed when price crosses below the 20 MA, showing weakness in short-term momentum.
4. Visual Signals:
• 🟢 BUY triangle below candles → Entry signal
• 🔴 SELL triangle above candles → Exit signal
• Colored MAs plotted for trend clarity.
⸻
📈 Recommended Usage:
• Chart: BTC/USDT
• Timeframe: 1 Hour
• Type: Trend-following crossover strategy
• Ideal for: Identifying major breakout moves and confirming trend reversals.
⸻
⚠️ Notes:
• This script is meant for educational and backtesting purposes only.
• Always apply additional confirmation tools (like RSI, Volume, or VIX-style filters) before live trading.
• Works best during trending markets; may produce whipsaws in sideways zones.

BTC TOPperThe BTC TOPper indicator is a sophisticated technical analysis tool designed to identify critical price levels where Bitcoin's weekly Simple Moving Average (SMA) intersects with historically significant All-Time High (ATH) levels. This indicator is particularly valuable for long-term trend analysis and identifying potential reversal zones in Bitcoin's price action.
Key Features:
🔹 Weekly SMA Analysis: Uses a 200-period Simple Moving Average on weekly timeframe to smooth out short-term volatility and focus on long-term trends
🔹 Persistent Historical ATH Tracking: Automatically detects and "freezes" ATH levels that have been held for more than one year, creating persistent reference levels
🔹 Multi-Level Cross Detection: Tracks up to 10 different frozen ATH levels simultaneously, providing comprehensive historical context
🔹 Visual Cross Alerts: Highlights entire weeks with red background when the weekly SMA crosses any frozen ATH level, making signals impossible to miss
🔹 Advanced Smoothing Options: Includes optional secondary moving averages (SMA, EMA, SMMA, WMA, VWMA) with Bollinger Bands for enhanced analysis
🔹 Customizable Parameters: Adjustable SMA length, offset, and smoothing settings to fit different trading strategies
How It Works:
ATH Detection: Continuously monitors for new all-time highs
Level Freezing: After an ATH is held for 1+ year, it becomes a "frozen" historical level
Cross Monitoring: Watches for intersections between the 200-week SMA and any frozen ATH level
Signal Generation: Highlights the entire week when a cross occurs, providing clear visual alerts
Trading Applications:
Long-term Trend Analysis: Identify when Bitcoin approaches historically significant resistance levels
Reversal Zone Detection: Spot potential areas where price might reverse based on historical context
Support/Resistance Confirmation: Use frozen ATH levels as dynamic support and resistance zones
Market Structure Analysis: Understand how current price relates to historical market cycles
Best Practices:
Use on weekly timeframe for optimal results
Combine with other technical indicators for confirmation
Pay attention to multiple frozen levels clustering in the same price range
Consider market context and fundamentals alongside technical signals
Settings:
Length: 200 (default) - SMA period
Source: Close price
Smoothing: Optional secondary MA with multiple types available
Bollinger Bands: Optional volatility bands around secondary MA
This indicator is ideal for Bitcoin traders and analysts who want to understand the relationship between current price action and historical market structure, particularly useful for identifying potential major reversal zones based on historical ATH levels.

BTC 1D — Trend START/END Signals (clean, no repaint)
This strategy is designed primarily for BTC on the daily (1D) timeframe in TradingView.
BUY (start of uptrend)
Fast EMA is above Slow EMA.
Price breaks above the previous Donchian high.
Optional filters (if enabled): volume surge and strong momentum/RSI.
Only one BUY per uptrend—no additional buys until a SELL occurs.
SELL (end of uptrend)
Price falls below the previous Donchian low, or
Price drops below the Slow EMA, or
Momentum flips bearish (DI− > DI+ or RSI ≤ threshold).
One SELL marks the end of the uptrend.

BTC Power-Law Decay Channel Oscillator (0–100)🟠 BTC Power-Law Decay Channel Oscillator (0–100)
This indicator calculates Bitcoin’s position inside its long-term power-law decay channel and normalizes it into an easy-to-read 0–100 oscillator.
🔎 Concept
Bitcoin’s long-term price trajectory can be modeled by a log-log power-law channel.
A baseline is fitted, then an upper band (excess/euphoria) and a lower band (capitulation/fear).
The oscillator shows where the current price sits between those bands:
0 = near the lower band (historical bottoms)
100 = near the upper band (historical tops)
📊 How to Read
Oscillator > 80 → euphoric excess, often cycle tops
Oscillator < 20 → capitulation, often cycle bottoms
Works best on weekly or bi-weekly timeframes.
⚙️ Adjustable Parameters
Anchor date: starting point for the power-law fit (default: 2011).
Smoothing days: moving average applied to log-price (default: 365 days).
Upper / Lower multipliers: scale the bands to align with historical highs and lows.
✅ Best Use
Combine with other cycle signals (dominance ratios, macro indicators, sentiment).
Designed for long-term cycle analysis, not intraday trading.

BTC Dominance & Price RSI Analyzer by Sajad BagheriThis indicator analyzes the Relative Strength Index (RSI) for three key cryptocurrency metrics:
Bitcoin Price (BTC/USDT)
Bitcoin Dominance (BTC.D)
Tether Dominance (USDT.D)
It provides a comprehensive view of market momentum by displaying three RSI lines in a single pane, allowing traders to identify overbought and oversold conditions across these important metrics simultaneously.
BTC/USD Breakout Hours – IST (Hyderabad)This indicator highlights the most volatile BTC/USD trading hours based on Hyderabad (IST) time.
It marks three key breakout windows:
London–US Overlap (17:30–20:30 IST) – Highest liquidity & volatility
US Market Open Momentum (19:00–23:30 IST) – Strong trend moves
Early London Session (12:30–15:30 IST) – Pre-US setup moves
The script automatically converts chart time to IST, shades each breakout window, and includes optional alerts for:
Window start
15 minutes before start
Ideal for traders who want to align entries with high-probability market moves while avoiding low-volume hours.
BTC 1m Chop Top/Bottom Reversal (Stable Entries)Strategy Description: BTC 5m Chop Top/Bottom Reversal (Stable Entries)
This strategy is engineered to capture precise reversal points during Bitcoin’s choppy or sideways price action on the 5-minute timeframe. It identifies short-term tops and bottoms using a confluence of volatility bands, momentum indicators, and price structure, optimized for high-probability scalping and intraday reversals.
Core Logic:
Volatility Filter: Uses an EMA with ATR bands to define overextended price zones.
Momentum Divergence: Confirms reversals using RSI and MACD histogram shifts.
Price Action Filter: Requires candle confirmation in the direction of the trade.
Locked Signal Logic: Prevents repaints and disappearing trades by confirming signals only once per bar.
Trade Parameters:
Short Entry: Above upper band + overbought RSI + weakening MACD + bearish candle
Long Entry: Below lower band + oversold RSI + strengthening MACD + bullish candle
Take Profit: ±0.75%
Stop Loss: ±0.4%
This setup is tuned for traders using tight risk control and leverage, where execution precision and minimal drawdown tolerance are critical.

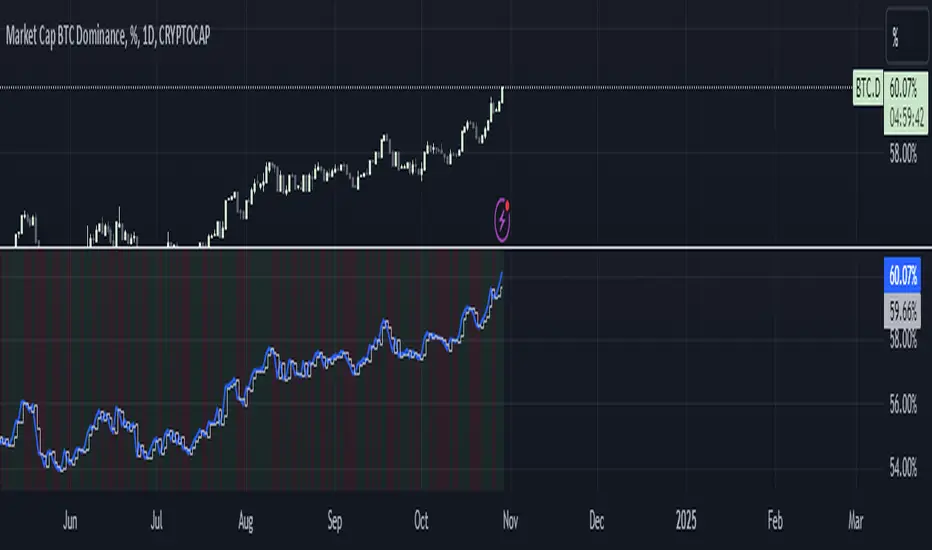
BTC Dominance Zones (For Altseason)Overview
The "BTC Dominance Zones (For Altseason)" indicator is a visual tool designed to help traders navigate the different phases of the altcoin market cycle by tracking Bitcoin Dominance (BTC.D).
It provides clear, color-coded zones directly on the BTC.D chart, offering an intuitive roadmap for the progression of alt season.
Purpose & Problem Solved
Many traders often miss altcoin rotations or get caught at market tops due to emotional decision-making or a lack of a clear framework. This indicator aims to solve that problem by providing an objective, historically informed guide based on Bitcoin Dominance, helping users to prepare before the market makes its decisive moves. It distils complex market dynamics into easily digestible sections.
Key Features & Components
Color-Coded Horizontal Zones: The indicator draws fixed horizontal bands on the BTC.D chart, each representing a distinct phase of the altcoin market cycle.
Descriptive Labels: Each zone is clearly labeled with its strategic meaning (e.g., "Alts are dead," "Danger Zone") and the corresponding BTC.D percentage range, positioned to the right of the price action for clarity.
Consistent Aesthetics: All text within the labels is rendered in white for optimal visibility across the colored zones.
Symbol Restriction: The indicator includes an automatic check to ensure it only draws its visuals when applied specifically to the CRYPTOCAP:BTC.D chart. If applied to another chart, it displays a helpful message and remains invisible to prevent confusion.
Methodology & Interpretation
The indicator's methodology is based on the historical behavior of Bitcoin Dominance during various market cycles, particularly the 2021 bull run. Each zone provides a specific interpretation for altcoin strategy:
Grey Zone (BTC.D 60-70%+): "Alts Are Dead"
Interpretation: When Bitcoin Dominance is in this grey zone (typically above 60%), Bitcoin is king, and capital remains concentrated in BTC. This indicates that alt season is largely inactive or "dead". This phase is generally not conducive for aggressive altcoin trading.
Blue Zone (BTC.D 55-60%): "Alt Season Loading"
Interpretation: As BTC.D drops into this blue zone (below 60%), it signals that the market is "heating up" for altcoins. This is the time to start planning and executing your initial positions in high-conviction large-cap and strong narrative plays, as capital begins to look for more risk.
Green Zone (BTC.D 50-55%): "Alt Season Underway"
Interpretation: Entering this green zone (below 55%) signifies that "real momentum" is building, and alt season is genuinely "underway". Money is actively flowing from Ethereum into large and mid-cap altcoins. If you've positioned correctly, your portfolio should be showing strong gains in this phase.
Orange Zone (BTC.D 45-50%): "Alt Season Ending"
Interpretation: As BTC.D dips into this orange zone (below 50%), it suggests that altcoin dominance is reaching its peak, indicating the "ending" phase of alt season. While euphoria might be high, this is a critical warning zone to prepare for profit-taking, as it's a phase of "peak risk".
Red Zone (BTC.D Below 45%): "Danger Zone - Alts Overheated"
Interpretation: This red zone (below 45%) is the most critical "DANGER ZONE". It historically marks the point of maximum froth and risk, where altcoins are overheated. This is the decisive signal to aggressively take profits, de-risk, and exit positions to preserve your capital before a potential sharp correction. Historically, dominance has gone as low as 39-40% in this phase.
How to Use
Open TradingView and search for the BTC.D symbol to load the Bitcoin Dominance chart and view the indicator.
Double click the indicator to access settings.
Inputs/Settings
The indicator's zone boundaries are set to historically relevant levels for consistency with the Alt Season Blueprint strategy. However, the colors of each zone are fully customizable through the indicator's settings, allowing users to personalize the visual appearance to their preference. You can access these color options in the indicator's "Settings" menu once it's added to your chart.
Disclaimer
This indicator is provided for informational and educational purposes only. It is not financial advice. Trading cryptocurrencies involves substantial risk of loss and is not suitable for every investor. Past performance is not indicative of future results. Always conduct your own research and consult with a qualified financial professional before making any investment decisions.
About the Author
This indicator was developed by Nick from Lab of Crypto.
Release Notes
v1.0 (June 2025): Initial release featuring color-coded horizontal BTC.D zones with descriptive labels, based on Alt Season Blueprint strategy. Includes symbol restriction for correct chart application and consistent white text.

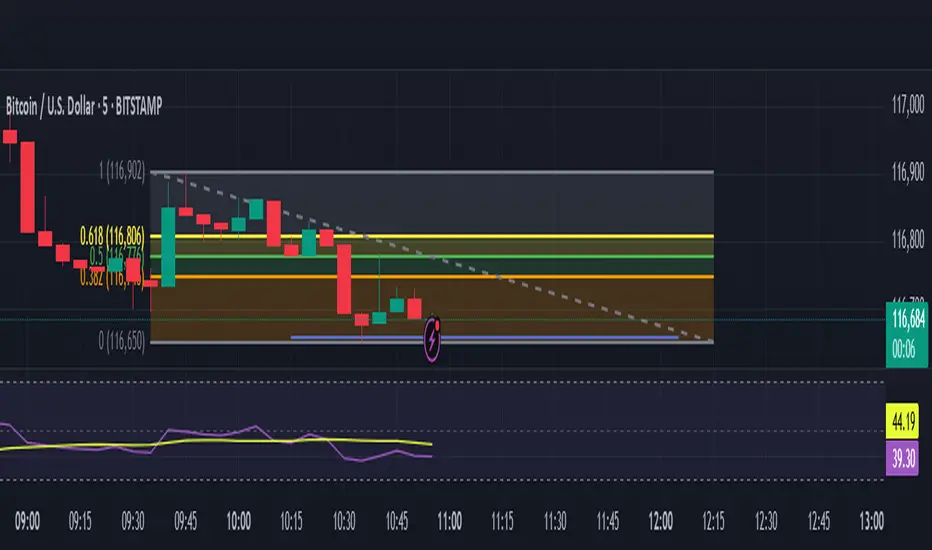
BTC Breakout Alert📈 BTC Breakout & Fakeout Detector with Volume, RSI & MACD Filters
This script helps identify high-confidence breakout setups by combining price action, volume spikes, and optional momentum filters (RSI & MACD). It’s designed to alert you when Bitcoin (or any asset) breaks above a defined resistance level with strong conviction — and warns you if that move turns out to be a fakeout.
🔍 Features:
✅ Confirmed Breakout Alerts: Triggers when price closes above your set resistance level with volume ≥ 1.5× the 20-period average.
⚠️ Fakeout Detection: Highlights when price closes back below resistance within a few candles after breakout.
📊 Momentum Filters:
RSI > 50 for bullish confirmation
MACD line > signal line to support breakout momentum
🔔 Custom Alerts: Built-in alert conditions for both breakout and fakeout events.
🔼🔽 Visual Markers: Arrows plotted directly on the chart for clear entry and caution zones.
🕒 Works on all timeframes and any asset that includes volume data.
Ideal for breakout traders who want more than just a price spike — this tool ensures volume and momentum alignment, helping you reduce false signals and react with more confidence.

BTC Markup/Markdown Zones by Koenigsegg📈 BTC Markup/Markdown Zones
A handcrafted indicator designed to mark Bitcoin's most critical High Time Frame (HTF) structure shifts. This tool overlays true institutional-level Markup and Markdown Zones, selected manually after deep market review. Whether you're testing strategies or actively trading, this tool gives you the bigger picture at all times.
🔍 Key Features:
✅ HTF Markup & Markdown Zones
Every zone is manually selected — no indicators, no repainting. Just raw market history and real structure.
✅ Two Display Modes
• Background Zones — soft overlays with low opacity for visual context — with the option to increase opacity manually if desired.
• Start Candle Highlight — sharply highlighted candle marking the final pivot before a macro reversal.
✅ Custom Color Controls (Style Tab)
All visual styling lives in the Style tab, with clearly labeled fields:
• Markup Zone
• Markdown Zone
• Start Candle Highlight Markup
• Start Candle Highlight Markdown
✅ Minimal Input Section
Just one toggle: display mode. Everything else is kept clean and intuitive.
🧠 Purpose:
This script is made for any timeframe:
• Zoom into lower timeframes to know whether you're trading inside a Markup or Markdown
• Use it during strategy testing for true structural awareness
📅 Handpicked Macro Turning Points:
Each zone originates from a manually confirmed candle — the last meaningful candle before a shift in control between bulls and bears:
• FRI 19 AUG 2011 12PM – MARK DOWN
• THU 20 OCT 2011 12AM – MARK UP
• WED 10 APR 2013 12PM – MARK DOWN
• FRI 12 APR 2013 12PM – MARK UP
• SAT 30 NOV 2013 12AM – MARK DOWN
• WED 14 JAN 2015 12PM – MARK UP
• SUN 17 DEC 2017 12PM – MARK DOWN
• SAT 15 DEC 2018 12PM – MARK UP
• WED 14 APR 2021 4AM – MARK DOWN
• TUE 22 JUN 2021 12PM – MARK UP
• WED 10 NOV 2021 12PM – MARK DOWN
• MON 21 NOV 2022 8PM – MARK UP
• THU 14 MAR 2024 4AM – MARK DOWN
• MON 5 AUG 2024 12PM – MARK UP
• MON 20 JAN 2025 4AM – MARK DOWN
💡 Zones are manually updated by me after each new confirmed Markup or Markdown.
🧬 Fractal Structure for MTF Systems
Price is fractal — meaning the same principles of structure repeat across all timeframes. In Version 2, this tool evolves by introducing manually selected sub-zones inside each High Time Frame (HTF) Markup or Markdown. These sub-zones reflect Medium Timeframe (MTF) structure shifts, offering precision for traders who operate on both intraday and swing levels.
This makes the indicator ideal for low timeframe (LTF) Markup/Markdown awareness — whether you're managing 15m entries or building multi-timeframe confluence systems.
No auto-zones. No guesswork. Just clean, intentional structure division within the broader trend, handpicked for maximum clarity and edge.
💡 Pro Tip:
When price is inside a Markup Zone, shorting becomes riskier — you're trading against a macro bullish structure.
When inside a Markdown Zone, longing becomes riskier — you're fighting against confirmed bearish momentum.
Use this tool to stay aligned with the broader move, especially when zoomed into smaller timeframes or managing entries/exits during intraday setups.
📈 Markup Phase – Bullish Sentiment
Definition: A period where price makes higher highs and higher lows — the uptrend is in full force.
Why sentiment is bullish:
- Institutions and smart money are already positioned long.
- Public/institutional demand drives prices up.
- Momentum is supported by positive news, breakouts, and FOMO.
- Higher highs confirm buyers are in control.
📉 Markdown Phase – Bearish Sentiment
Definition: A period where price makes lower lows and lower highs — clear downtrend.
Why sentiment is bearish:
- Distribution has already occurred, and supply outweighs demand.
- Smart money is short or sidelined, waiting for deeper prices.
- Panic selling or trend-following traders add downside momentum.
- Lower lows confirm sellers are in control.
❌ Trading Against the Trend — Consequences:
-Reduced Probability of Success
-You’re fighting the dominant flow. Most participants are pushing in the opposite direction.
-Drawdowns & Stop-Outs
-Countertrend trades often get wicked or flushed before any meaningful move, especially without structure-based entries.
-Low Risk-Reward Ratio
-Trends offer sustained moves. Countertrend trades may have small take-profit zones or chop.
-Mental Drain & Doubt
-Fighting momentum causes anxiety, second-guessing, and emotional reactions.
-Missed Opportunities
-Focusing on fighting the trend makes you blind to the high-probability setups with the trend.
-Increased Transaction Costs
-More stop-outs and re-entries mean more fees, more friction.
-FOMO from Watching the Trend Run
-Entering countertrend means you might watch the trend explode without you.
-Confirmation Bias & Stubbornness
-Countertrend traders often look for reasons to justify staying in the wrong direction — leading to bigger losses.
🧠 Summary
In markup = bulls dominate → you swim with the current.
In markdown = bears dominate → going long is like pushing a rock uphill.
Trading with the trend is not just safer, it's smarter. The edge lives in momentum — not ego.
⚠️ Disclaimer
This indicator is for educational and analytical use only. It is not financial advice and should not be relied on for decision-making without personal analysis.
This is not a predictive tool. No indicator can forecast upcoming price movements.
What you see here is based purely on past market behavior — specifically, historical tops and bottoms that marked the start of confirmed reversals.
This script does not know where the next reversal begins, nor can it determine where a new Markup or Markdown starts or ends. It is designed to provide context, not prediction.
Always trade with responsibility and perform your own due diligence.

BTC Growth | AlchimistOfCrypto🌈 BTC Regression Bands & Halvings – Unveiling Bitcoin's Logarithmic Growth Fields 🌈
"The Bitcoin Regression Bands, engineered through advanced logarithmic mathematics, visualizes the probabilistic distribution of Bitcoin's price evolution within a multi-cycle growth paradigm. This indicator employs principles from hyperbolic regression where decay coefficients create mathematical boundaries that define Bitcoin's long-term value progression. Our implementation features algorithmically enhanced rainbow visualization derived from extensive cycle analysis, creating a dynamic representation of Bitcoin's logarithmic growth with adaptive color gradients that highlight critical halving-based phase transitions in the asset's monetary evolution."
📊 Professional Trading Application
The Bitcoin Regression Bands transcends traditional price prediction models with a sophisticated multi-band illumination system that reveals the underlying structure of Bitcoin's monetary evolution. Scientifically calibrated across multiple halving cycles and featuring seamless rainbow visualization, it enables investors to perceive Bitcoin's position within its macro growth trajectory with unprecedented clarity.
- Visual Theming 🎨
Scientifically designed rainbow gradient optimized for cycle pattern recognition:
- Violet-Blue: Lower value accumulation zones with highest mathematical growth potential
- Green: Fair value equilibrium zone representing the regression mean
- Yellow-Orange: Moderate overvaluation regions indicating potential resistance
- Red: Statistical extreme zones indicating mathematical cycle peaks
- Halving Visualization 🔍
- Precise cycle boundaries demarcating Bitcoin's fundamental supply shock events
- Adaptive band spacing based on mathematical cycle progression
- Multiple sub-cycle markers revealing the probabilistic nature of Bitcoin's trajectory
🚀 How to Use
1. Identify Macro Position ⏰: Locate Bitcoin's current price relative to the regression bands
2. Understand Cycle Context 🎚️: Note position within the current halving cycle for time-based analysis
3. Assess Mathematical Value 🌈: Determine potential over/undervaluation based on band location
4. Adjust Investment Strategy 🔎: Modulate position sizing based on mathematical value assessment
5. Identify Cycle Phases ✅: Monitor band transitions to detect accumulation and distribution zones
6. Invest with Precision 🛡️: Utilize lower bands for strategic accumulation, upper bands for strategic reduction
7. Manage Risk Dynamically 🔐: Scale investment allocations based on mathematical cycle positioning

BTC Seasonality Strategy (Weekly)This strategy identifies potential weekend opportunities in Bitcoin (BTC) markets by leveraging the concept of seasonality, entering a position at a predefined time and day, and exiting at a specified time and day.
Key Features
Customizable Time and Day Selection:
Users can select the entry and exit days and corresponding times (in EST).
Directional Flexibility:
The strategy allows traders to choose between long or short positions.
TradingView Compliance:
The script adheres to TradingView's house rules, avoids overly complex conditions, and provides clear user-configurable inputs.
How It Works
The script determines the current weekday and hour in EST, converting TradingView's UTC time for accurate comparisons.
If the current day and hour match the selected entry conditions, a trade (long or short) is opened.
The position is closed when the current day and hour match the specified exit conditions.
Theoretical Basis
Market Seasonality:
The concept of seasonality in financial markets refers to predictable patterns based on time, such as weekends or specific days of the week. Studies have shown that cryptocurrency markets exhibit unique trading behaviors during weekends due to reduced institutional activity and higher retail participation behavioral Biases**:
Retail traders often dominate weekend markets, potentially causing predictable inefficiencies .
Reverences**
Baur, D. G., Hong, K., & Lee, A. D. (2018). Bitcoin: Medium of exchange or speculative assets? Journal of International Financial Markets, Institutions and Money, 54, 177–189.
Urquhart, A. (2016). The inefficiency of Bitcoin. Economics Letters, 148, 80–82.

BTC Dominance Trend CheckerThis monitors the Bitcoin dominance (BTC.D) in the market. It retrieves the current and previous day's BTC dominance values, determines whether dominance is increasing or decreasing, and visually displays the trend.
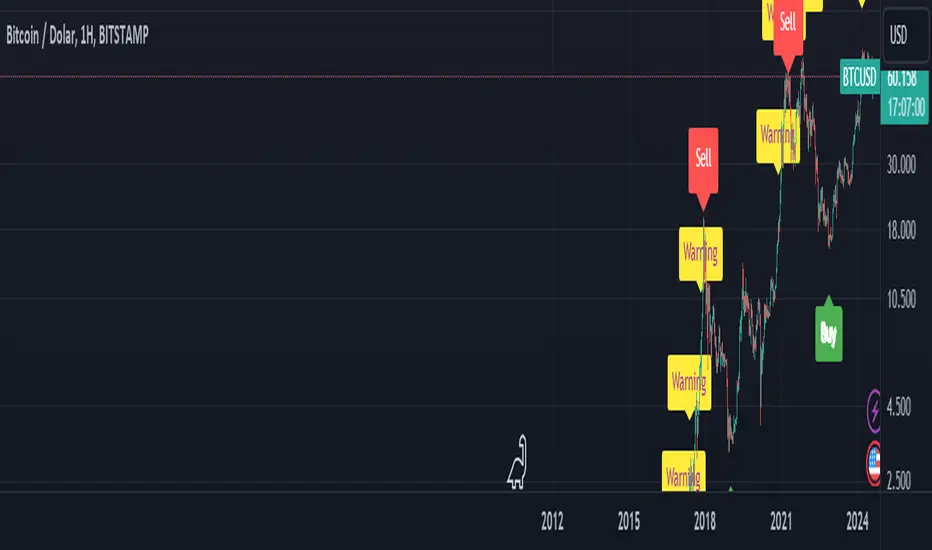
BTC Arcturus IndicatorBTC Arcturus Indicator: This indicator is designed to create buy and sell signals based on the market value of Bitcoin. It also predicts potential market tops with the Pi Cycle Top indicator.
How Does It Work?
1. MVRVZ (Market Value to Realized Value-Z Score) Calculation:
MC: Bitcoin's market cap (Market Cap) is pulled daily from Glassnode data.
MCR: Realized Market Cap of Bitcoin is taken daily from Coinmetrics data.
MVRVZ: It is calculated by dividing the difference between Bitcoin's market value and realized market value by one standard deviation. This value indicates whether the market is overvalued or undervalued.
2. Reception and Warning Signals:
Buy Signal: When MVRVZ falls below the -0.255 threshold value, the indicator gives a "Buy" signal. This indicates that Bitcoin is undervalued and may be a buying opportunity.
Warning Signal: A warning signal turns on when MVRVZ exceeds the threshold value of 2.765. This indicates that the market is approaching saturation and caution is warranted.
3. Tracking the Highest MVRVZ Value:
The indicator records the highest MVRVZ value in the last 10 candlesticks. This value is used to determine whether the market has reached its highest risk levels.
4. Warning Display:
If the MVRVZ value matches the highest value in the last 10 bars and this warning has not been displayed before, a "Warning" signal is displayed.
Once the warning signal is shown, no further warnings are shown for 10 candles.
5. Pi Cycle Top Indicator:
Pi Cycle Top: This indicator predicts Bitcoin tops by comparing two moving averages (350-day and 111-day). If the short-term moving average falls below the long-term moving average, this is considered a sell signal.
The indicator displays this signal with the label "Sell", indicating a potential market top.
User Guide:
Green Buy Signal: It means Bitcoin is cheap and offers a buying opportunity.
Yellow Warning Signal: Indicates that Bitcoin has reached possible profit taking points and caution should be exercised.
Red Sell Signal: Indicates that Bitcoin has reached market saturation and it may be appropriate to sell.