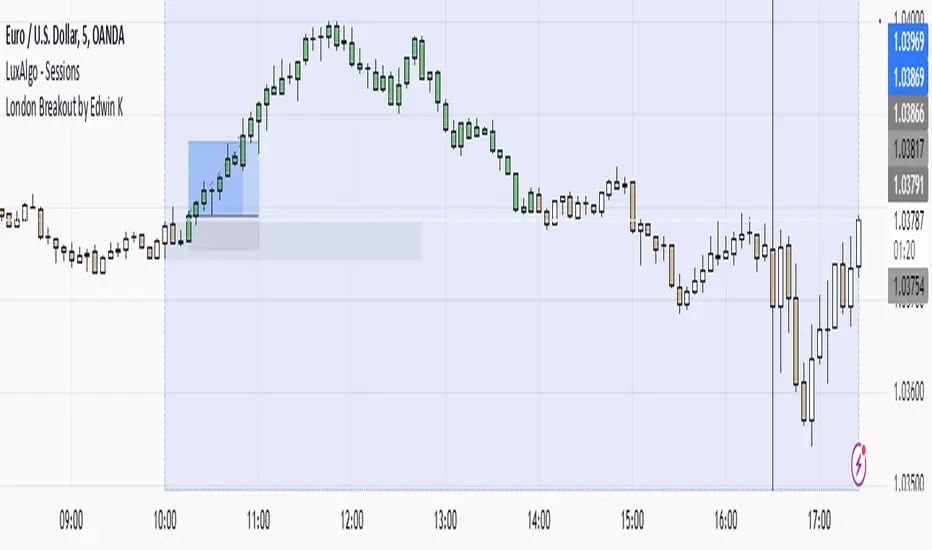
Open DriveOpen Drive is a market profile concept introduced by Jim Dalton. It occurs when the price moves directionally and persistently for the first 30 minutes from the cash market open.
It is necessary to use 30-minute bars as there needs to be enough time to measure an extreme move of the cash open. This means there will be fewer trades than other strategies using faster time periodicities.
The script finds open drives from these time points 0700/ 0800 and 1300/1430.
The entry signal also has a breakout threshold using the 5-bar high and 5-bar low to only take trades moving away from the prior 5-bar range. This weeds out most mid-range trades and small range expansion bars.
If the price has had a strong move from the open and has broken either below the prior 5-bar low or above the prior 5-bar high by an amount equal to the prior 5-bar range a trade is entered in the direction of the move.
The Exit criteria; exit after 3 bars which is 90mins when using a 30min periodicity.
Note, this script is shared to show that momentum generated on or around the cash open tends to persist. The entry and exits of this strategy are quite naive but there are plenty of ways to take more aggressive entries on faster time frames when an open drive occurs. The times chosen for this strategy will suit stock index futures mainly. The user can experiment with other futures products and their corresponding pit/ cash open hours.
Google "open drive market profile" for more information on open drives and market profile concepts.
Happy trading!
Buscar en scripts para "breakout"
Pivot BreaksThere are built-in and published Pivot Point High Low indicators in Public Library. As far as I see none of them show the breaking candles or the trend.
with the closing price crossing over the previous / current pivot high A bearish breakOut can either indicate the progression of a lower high pattern or a trend reversal
with the closing price crossing under the previous / current pivot low A bullish breakOut can either indicate the progression of a higher low pattern or a trend reversal
This indicator can show the first breaking candle or all breaking candles . It Can also show The Breaking state (Trend) based on the last break.
Alert Mode is included, colour can be customised, Higher TimeFrame can be requested (it Can also cause repainting)
Inputs are optional as possible so have fun with it
Disclaimer: Scripts that I post publicly are experimental. They are not financial advices. Always backtest your ideas using your own methodologies.
Linear Regression & RSI Multi-Function Screener with Table-LabelHi fellow traders..
Happy to share a Linear Regression & RSI Multi-Function Custom Screener with Table-Labels...
The Screener scans for Linear Regression 2-SD Breakouts and RSI OB/OS levels for the coded tickers and gives Summary alerts
Uses Tables (dynamica resizing) for the scanner output instead of standard labels!
This Screener cum indicator collection has two distinct objectives..
1. Attempt re-entry into trending trades.
2. Attempt Counter trend trades using linear regression , RSI and Zigzag.
Briefly about the Screener functions..
a. It uses TABLES as Labels a FIRST for any Screener on TV.
b. Tables dynamically resize based on criteria..
c. Alerts for breakouts of the UPPER and the LOWER regression channels.(2 SD)
d. In addition to LinReg it also Screens RSI for OB/OS levels so a multifunction Screener.
e. Of course has the standard summary Alerts and programmable format for Custom functions.
f. Uses only the inbuilt Auto Fib and Lin Reg code for the screener.(No proprietary stuff)
g. The auto Zigzag code is derived(Auto fib).
Question what are all these doing in a single screener ??
ZigZag is very useful in determining Trend Up or Down from one Pivot to another.
So Once you have a firm view of the Current Trend for your chosen timeframe and ticker…
We can consider few possible trading scenarios..
a. Re-entry in an Up Trend - Combination of OS Rsi And a Lower Channel breach followed by a re-entry back into the regression channel CAN be used as an effective re-entry.
b. Similarily one can join a Down Trend on OB Rsi and Upper Channel line breach followed by re-entry into the regression channel.
If ZigZag signals a range-bound market, bound within channel lines then the Upper breakout can be used to Sell and vice-versa!
In short many possibilities for using these functions together with Scanner and Alerts.
This facilitates timely PROFITABLE Trending and Counter trend opportunities across multiple tickers.
You must give a thorough READ to the various available tutorials on ZigZag / Regression and Fib retracements before attempting counter trend trades using these tools!!
A small TIP – Markets are sideways or consolidating 70% of the time!!
Acknowledgements: - Thanks a lot DGTRD for the Auto ZigZag code and also for the eagerness to help wherever possible..Respect!!
Disclaimer: The Alerts and Screener are just few tools among many and not any kind of Buy/Sell recommendations. Unless you have sufficient trading experience please consult a Financial advisor before investing real money.
*The alerts are set for crossovers however for viewing tickers trading above or below the channel use code in line 343 and 344 after setting up the Alerts!
** RSI alerts are disabled by default to avoid clutter, but if needed one can activate code lines 441,442,444 and 445
Wish you all, Happy Profitable Trading!
SMT - Smart Money Thursday Boxes
The Smart Money Trading Thursday - is a very specific trading system. You only trade it on a Thursday.
The script/indicator will color Thursdays as two boxes. If you just want one color, use same color for
both boxes. The boxes is there to indicate London/New York sessions.
SETTINGS
In the setting you find a numeric value as 1700-0400:5
The "5" indicate Thursday. You can change that if you prefer to color another specific day.
For example "4" would indicate Wednesday. And you can change the hours to fit your
sessions and trading style.
You can also use the 2 boxes on different days. If you for example would like to color up
London for Wednesday and Thursday. Then set hours to fit London session and adjust the
:5 to 4 on the 1st box and 5 on the 2nd.
HOW TO USE IT?
The Smart Money works in a way retail trading does not. Smart Money has an objective
to locate retail patterns, where there will be a lot of stop loss volume to be grabbed.
So when a retail trader see a setup like a "Double Top / Bottom". The Institutional
will see $$$ of dumb money, ready to be taken. The best moves happen on a Thursday
but if you are a skilled trader, you can see the move also occur on Wednesday or Friday.
The first thing that will happen, is that the Smart Money Breaks out of session. Meaning
they will leave the current weeks high/low range. To start collect negative contracts
of the retail volume.
When you see that happen. And you see a breakout that consist of 4 in a row 1 hour
chart candles. Then you have your first rule meet.
#1 Thursday breakout of current weeks high/low. And the move is a clean 4 hour move
as 4x H1 candles. The move can start within range. But must end clearly outside.
Visual Example:
#2 Next, we await an engulf at peak or near peak. That is where Institutional
may have problem to match any more contracts, and since they used their own
money to make this move. They must now mitigate orders, and return back to
the original retail pattern as most retail traders are now stopped out.
(Normally this is a long/clear candle out of range. they rarely go lower
then retail traders entry in the 1st push. This to not save any souls :)
#3 Price returns back to where the breakout from the retail happens.
You can now take your profit as a Smart Money Trader. Trading with less risk,
you can take profit of the return of that latest 4x H1 candle move. (Order
Block)
CONCLUSION
The best trade is when you can combine a retail pattern, followed by a
breakout which holds 4x 1 hour candles in the outbreak direction.
2nd best is when you have the 4x H1 breakout and really no clear retail
pattern. Still is the same game. Just not as clear as the one above.
Study the steps in this image and you see what to look after:
Good Luck with your trading!
Regards,
The Hunter Trading Group
Big Breakout IndexBig Breakout Index is a great indicator for detecting breakouts. When the current close breaks out of consolidation, the indicator will tell you.
Green - Buy
Red - Sell
VWAP Stdev BandsCurrent price always obeys VWAP and is very useful for intraday traders. The Price will never go beyond the second deviation of VWAP at any point of time. The deviation bands are also very useful in predicting the volatility of the script.
Breakout trades can be taken based on the previous day's VWAP and it's deviations.
One can say that the stock has experienced breakout if current price crosses the fourth deviation of the previous day's VWAP or price bounces off that level, the price movement will be rapid if this occurs providing a good trading opportunity with low risk-reward ratio.
Systematic TF IndicatorThis is a simple trend following indicator which works off moving averages for trend bias and breakouts for entry.
CM_OldSchool_Projected_high_LowHeard this story from Larry Williams…the trader who holds the record for winning the U.S. Trading Championship by turning $10K in to 2 Million.
A trader named Owen Taylor developed this formula as a Floor Trader before to calculate the Projected High and Low of the next day.
The formula worked so well…Owen charged other Traders 1K to get it.
I was pretty impressed with the results…so I coded it for the Weekly, Monthly, Quarterly, and Yearly Projected High Low.
While Owen considered these levels to be major support and resistance, Larry has developed many strategies based on the Breakout of the Projected High Low.
Therefore I coded it so the Levels would plot Yellow, and change to Green if the Projected High was taken out, and Red if the Projected Low was taken out.
***I’ve noticed on many instruments, Stocks, Index’s, Forex etc., depending on the instrument it works great as Support/Resistance or Breakouts.
***On a Daily Chart put the Quarterly and Yearly levels on SPY and EURUSD and go back about 10 years. Levels are pretty accurate.
15m-REMA Breakout [XAU + XAG] – MusDescription
This indicator is designed to capture high-conviction breakout opportunities on gold (XAUUSD) and silver (XAGUSD) using a zero-lag Recursive EMA (REMA) as the trend backbone, combined with volatility and body-strength filters.
It is tuned for the 15-minute timeframe, where metals often show sharp moves after consolidation.
How it works
Zero-Lag REMA → Smooth but responsive trend detection.
ATR-based Breakout Filter → Confirms that price clears recent highs/lows with volatility support.
Body Size & Buffer Rules → Blocks weak candles and fake breaks near range levels.
Trend Filter (optional) → Only allows signals in the dominant REMA slope direction.
De-duplication Logic → Avoids repeated signals on consecutive bars.
Signals
Green ▲ (Bull Breakout): Candle breaks above recent range with strength.
Red ▼ (Bear Breakout): Candle breaks below recent range with strength.
Optional Pivots: Micro pivot highs/lows for additional context.
REMA Line: Plotted in teal (uptrend) or orange (downtrend).
Inputs / Customisation
REMA period & sensitivity.
ATR lookback and multiplier.
Minimum candle body (%).
Buffer multiplier to reduce noise.
Trend filter on/off.
Toggle arrows & pivot markers.
Best Practice
Apply on XAUUSD / XAGUSD, 15-minute charts.
Use as a confirmation tool, not a standalone entry system.
Combine with higher-timeframe bias or your own risk management.
Alerts
Built-in alert conditions let you set automated notifications for bullish or bearish breakouts at bar close.
Disclaimer
This script is for educational purposes only. It does not constitute financial advice. Always test on demo before applying to live trading.
VWAP + Range Breakout (Pre-Signal for Manual Entry)WHAT IT DOES
This tool highlights potential breakout opportunities when price sweeps the previous day’s high or low and aligns with VWAP and short-term range levels. It provides both pre-signals (early warnings) and confirmed signals (breakout closed) so traders can prepare before momentum accelerates.
Works on all timeframes and across markets (indices, forex, crypto). Especially useful during active London and New York sessions.
---
KEY FEATURES
Daily sweep logic: previous day high/low as liquidity reference
VWAP with cumulative calculation
Adjustable range breakout levels
Optional SMA trend filter
Session filter (London / NY trading hours)
Pre-Signal markers (early alert before breakout)
Confirmed LONG/SHORT signals after breakout close
Alerts for Pre-Long, Pre-Short, and Confirmed entries
---
HOW TO USE
1. Wait for price to sweep the previous day high/low.
2. Look for alignment with VWAP and the defined range breakout levels.
3. Use trend/session filters for higher accuracy.
4. Combine with your own risk management rules.
---
SETTINGS TIPS
Adjust range lookback for different timeframes (shorter for fast intraday, longer for higher timeframes).
Enable/disable session filters depending on your market.
Use SMA trend filter to stay aligned with higher-timeframe bias.
---
WHO IT’S FOR
Scalpers, intraday, and swing traders who want early signals when liquidity is taken and price is preparing for a breakout.
---
NOTES
For educational purposes only. No financial advice.
This script is open-source; redistribution follows TradingView rules.
RSI Breakout/Breakdown vs Highest/Lowest(N)RSI Breakout/Breakdown vs Highest/Lowest(N)
موشر rsi
RSI Breakout/Breakdown vs Highest/Lowest (N) Bars
This TradingView indicator compares the current RSI value with the highest and lowest RSI values over the past N bars (excluding the current bar).
Breakout (RSI↑):
A green upward triangle is plotted below the bar when the RSI closes above the highest RSI value of the previous N bars.
→ This signals momentum strength and a potential bullish breakout.
Breakdown (RSI↓):
A red downward triangle is plotted above the bar when the RSI closes below the lowest RSI value of the previous N bars.
→ This signals momentum weakness and a potential bearish breakdown.
Alerts:
The script includes two separate alerts:
RSI Breakout Alert → triggers when RSI closes above the highest N-bar value.
RSI Breakdown Alert → triggers when RSI closes below the lowest N-bar value.
Inputs:
RSI Length → Default is 14.
Lookback Bars (N) → Default is 100 (can be adjusted).
Source → Default is Close price.
This indicator works on any timeframe (hourly, daily, etc.). The logic triggers only once per bar close to avoid false signals during live bar formation.
EMA Cross + KC Breakout + ATR StopThis uses an adjustable EMA Cross with an adjustable Keltner Channel breakout filter to identify trend breakouts for Long/Short entries. An adjustable ATR Stop is also provided for your entries.
Daily Volume Ratio Bands (20MA)
Daily Volume Ratio Bands (20MA) — by CryptoDaily
This indicator normalizes daily trading volume against the recent 20-day moving average (20MA) and plots it as a volume ratio.
It allows traders to quickly identify whether current volume is strong, weak, or within a normal range compared to historical averages.
Key Features
Normalized volume ratio with 20-day average = baseline (1.0)
Clear bands for easy interpretation (1.0 ~ 1.3 = normal, above = overheated, below = weak)
Intuitive color coding:
🟨 Yellow: Normal range (1.0 ~ 1.3)
🔵 Blue: Above 1.3× average (high/strong volume, breakout confirmation)
⚪️ Gray: Below average (low volume)
🔴 Red: At or below 0.7× (extremely low volume / lack of interest)
How to Use
Breakouts with strong volume (Blue) → higher confidence in trend continuation
Gray/Red during consolidation → signal of weak momentum or sideways phase
Quickly assess whether the market is in overheated or low-activity conditions
Notes
Designed for Daily timeframe (1D) only. It will not function properly on intraday charts.
For educational purposes only. This is not financial advice.
Author
CryptoDaily (YouTube & TradingView)
YouTube channel: cryptodaily_tv
Anchorman - EMA Channel + EMA + MTF Status Table PRICE BREAKOUTUses a high/low EMA Channel to tell you when strong price breakouts are happening plus comes with a EMA to help follow the trend if you like. I designed it so it can alert you when a single TF touch happens or a breakout alignment on MTF happens (I recommend this) its up to you also its single alert so no need to do bullish or bearish signals just one signal will alert you when a breakout happens in EITHER direction.
Premarket Breakout Painter (08:00-09:29 ET) — First Break Only**Pre-Market Breakout Indicator**
This indicator is designed to help traders identify and trade **pre-market breakout levels**. It automatically marks the pre-market high and low range, then extends those levels into the regular session so you can see when price breaks above or below them.
---
## 🔑 **How It Works**
1. **Pre-Market Range**
* During extended hours (before the 09:30 ET open), the indicator tracks the **highest high** and **lowest low**.
* These levels form the **pre-market range**.
2. **Breakout Levels**
* At the market open, the pre-market high and low are plotted as horizontal lines.
* When price breaks above the pre-market high → potential **bullish breakout**.
* When price breaks below the pre-market low → potential **bearish breakout**.
3. **Optional Midline / VWAP**
---
🎨 **Visuals**
* **Horizontal lines** marking pre-market high and low.
* Lines extend into the regular session for easy tracking.
* Colors can be customized for bullish/bearish clarity.
---
⚙️ **Inputs**
* **Session Times** (default: 04:00–09:30 ET for U.S. equities).
* **Show/Hide Midline** (optional).
* **Line Styles & Colors**.
* **Alerts** (optional, e.g., alert when price crosses pre-market high or low).
---
🚨 **Practical Use**
* Look for **high volume breakouts** through pre-market high/low after the bell.
* Use levels as **support/resistance** for pullback entries.
* Combine with EMA trend filters, VWAP, or market internals for confirmation.
---
✅ This indicator doesn’t give buy/sell signals on its own — it’s a **visual framework** to highlight where the market may make its first decisive move of the day.
HTF HV Lines + Exceptional + Nearest Breakout (core only)Non-repainting breakout tool that maps high-volume (HV) levels from a higher timeframe (Daily by default) onto any intraday chart. It detects new HV bars only when the higher-timeframe candle closes, then draws persistent horizontal lines at that bar’s high and low. Optionally color “exceptional” volume events. On the trading timeframe, the script watches the nearest HV line and flags breakouts using OHLC quality checks: ATR-scaled close distance, minimum real body, and small opposite wick. Inputs let you cap stored events, tune strictness, ignore stale lines, and manage visual style easily.
Day Zero Fakeout Detector MTFDay Zero Template (Stacey Burke)
Definition:
“Day Zero” is essentially the setup day in Stacey Burke’s playbook.
It’s the day when the market creates a significant inflection — often forming a Peak Formation High (PFH) or Peak Formation Low (PFL).
It usually occurs after 3 days of directional movement (the classic 3-day cycle Stacey teaches).
Example:
Day 1: Breakout expansion.
Day 2: Continuation or consolidation.
Day 3: Exhaustion + reversal (forms PFH/PFL).
Day Zero: The day after this reversal template begins — where traders start looking for measured moves back inside the range.
👉 Day Zero = the transition day where the new weekly cycle (up or down) begins.
2️⃣ Peak Formation Highs (PFH) and Lows (PFL)
A PFH occurs when the market fails above prior highs (often with stop hunts/fakeouts).
A PFL occurs when the market fails below prior lows.
These PFHs/PFLs mark the anchor points for the next 3-day cycle.
Once identified, they become reference levels:
Above PFH → fade long traps (short bias).
Below PFL → fade short traps (long bias).
👉 This is where rectangles (Peter Brandt style) can come in handy to box in the PFH/PFL area.
3️⃣ Peter L. Brandt – Rectangles & Classical Charting
Peter Brandt’s approach (classical charting) complements Stacey’s playbook:
Rectangles are consolidation zones (value areas).
When a PFH or PFL forms, price often consolidates in a rectangle range.
A breakout from that rectangle confirms direction (continuation or reversal).
The measured move target is typically the height of the rectangle projected from the breakout point.
👉 Applied to Day Zero:
PFH/PFL = the extreme boundary of the rectangle.
A breakout from the rectangle in the opposite direction = confirmation of Day Zero reversal.
4️⃣ How They Fit Together
Stacey Burke: Focus on intraday cycles, 3-day cycle, Day Zero as the reset after PFH/PFL.
Peter Brandt: Focus on classical rectangle consolidation and breakout targets.
Integration:
Day Zero = when you’ve spotted a PFH or PFL and are preparing for the new cycle to begin.
Mark the PFH/PFL → draw a rectangle around the consolidation.
Wait for breakout/acceptance beyond rectangle → trade toward measured move (often aligning with Stacey’s Day 1/Day 2 directional bias).
✅ Example in practice:
Monday & Tuesday rally → Wednesday exhaustion → PFH forms.
Thursday = Day Zero (new short bias starting).
Rectangle consolidation forms under PFH.
Breakout below rectangle = signal.
Target = rectangle height measured down → often aligns with yesterday’s lows or prior session value area.
Volumetric Support and Resistance [BackQuant]Volumetric Support and Resistance
What this is
This Overlay locates price levels where both structure and participation have been meaningful. It combines classical swing points with a volume filter, then manages those levels on the chart as price evolves. Each level carries:
• A reference price (support or resistance)
• An estimate of the volume that traded around that price
• A touch counter that updates when price retests it
• A visual box whose thickness is scaled by volatility
The result is a concise map of candidate support and resistance that is informed by both price location and how much trading occurred there.
How levels are built
Find structural pivots uses ta.pivothigh and ta.pivotlow with a user set sensitivity. Larger sensitivity looks for broader swings. Smaller sensitivity captures tighter turns.
Require meaningful volume computes an average volume over a lookback period and forms a volume ratio for the current bar. A pivot only becomes a level when the ratio is at least the volume significance multiplier.
Avoid clustering checks a minimum level distance (as a percent of price). If a candidate is too close to an existing level, it is skipped to keep the map readable.
Attach a volume strength to the level estimates volume strength by averaging the volume of recent bars whose high to low range spans that price. Levels with unusually high strength are flagged as high volume.
Store and draw levels are kept in an array with fields for price, type, volume, touches, creation bar, and a box handle. On the last bar, each level is drawn as a horizontal box centered at the price with a vertical thickness scaled by ATR. Borders are thicker when the level is marked high volume. Boxes can extend into the future.
How levels evolve over time
• Aging and pruning : levels are removed if they are too old relative to the lookback or if you exceed the maximum active levels.
• Break detection : a level can be removed when price closes through it by more than a break threshold set as a fraction of ATR. Toggle with Remove Broken Levels.
• Touches : when price approaches within the break threshold, the level’s touch counter increments.
Visual encoding
• Boxes : support boxes are green, resistance boxes are red. Box height uses an ATR based thickness so tolerance scales with volatility. Transparency is fixed in this version. Borders are thicker on high volume levels.
• Volume annotation : show the estimated volume inside the box or as a label at the right. If a level has more than one touch, a suffix like “(2x)” is appended.
• Extension : boxes can extend a fixed number of bars into the future and can be set to extend right.
• High volume bar tint : bars with volume above average × multiplier are tinted green if up and red if down.
Inputs at a glance
Core Settings
• Level Detection Sensitivity — pivot window for swing detection
• Volume Significance Multiplier — minimum volume ratio to accept a pivot
• Lookback Period — window for average volume and maintenance rules
Level Management
• Maximum Active Levels — cap on concurrently drawn levels
• Minimum Level Distance (%) — required spacing between level prices
Visual Settings
• Remove Broken Levels — drop a level once price closes decisively through it
• Show Volume Information on Levels — annotate volume and touches
• Extend Levels to Right — carry boxes forward
Enhanced Visual Settings
• Show Volume Text Inside Box — text placement option
• Volume Based Transparency and Volume Based Border Thickness — helper logic provided; current draw block fixes transparency and increases border width on high volume levels
Colors
• Separate colors for support, resistance, and their high volume variants
How it can be used
• Trade planning : use the most recent support and resistance as reference zones for entries, profit taking, or stop placement. ATR scaled thickness provides a practical buffer.
• Context for patterns : combine with breakouts, pullbacks, or candle patterns. A breakout through a high volume resistance carries more informational weight than one through a thin level.
• Prioritization : when multiple levels are nearby, prefer high volume or higher touch counts.
• Regime adaptation : widen sensitivity and increase minimum distance in fast regimes to avoid clutter. Tighten them in calm regimes to capture more granularity.
Why volume support and resistance is used in trading
Support and resistance relate to willingness to transact at certain prices. Volume measures participation. When many contracts change hands near a price:
• More market players hold inventory there, often creating responsive behavior on retests
• Order flow can concentrate again to defend or to exit
• Breaks can be cleaner as trapped inventory rebalances
Conditioning level detection on above average activity focuses attention on prices that mattered to more participants.
Alerts
• New Support Level Created
• New Resistance Level Created
• Level Touch Alert
• Level Break Alert
Strengths
• Dual filter of structure and participation, reducing trivial swing points
• Self cleaning map that retires old or invalid levels
• Volatility aware presentation using ATR based thickness
• Touch counting for persistence assessment
• Tunable inputs for instrument and timeframe
Limitations and caveats
• Volume strength is an approximation based on bars spanning the price, not true per price volume
• Pivots confirm after the sensitivity window completes, so new levels appear with a delay
• Narrow ranges can still cluster levels unless minimum distance is increased
• Large gaps may jump past levels and immediately trigger break conditions
Practical tuning guide
• If the chart is crowded: increase sensitivity, increase minimum level distance, or reduce maximum active levels
• If useful levels are missed: reduce volume multiplier or sensitivity
• If you want stricter break removal: increase the ATR based break threshold in code
• For instruments with session patterns: tailor the lookback period to a representative window
Interpreting touches and breaks
• First touch after creation is a validation test
• Multiple shallow touches suggest absorption; a later break may then travel farther
• Breaks on high current volume merit extra attention
Multi timeframe usage
Levels are computed on the active chart timeframe. A common workflow is to keep a higher timeframe instance for structure and a lower timeframe instance for execution. Align trades with higher timeframe levels where possible.
Final Thoughts
This indicator builds a lightweight, self updating map of support and resistance grounded in swings and participation. It is not a full market profile, but it captures much of the practical benefit with modest complexity. Treat levels as context and decision zones, not guarantees. Combine with your entry logic and risk controls.
Lowest Low Breakout Signal w/ Target
### **Script Description**
This TradingView Pine Script indicator identifies breakout entry opportunities after a new **lowest low** is formed within a user-defined lookback period. It is designed for traders who want to catch reversals or breakouts from extreme lows with clearly defined targets.
**Key Features:**
* **Lowest Low Detection**: The script monitors price action for a candle that forms a new lowest low within the specified lookback period.
* **Breakout Entry Signal**: Once a breakout occurs (price closes above the high of the lowest-low candle), an **up arrow** is plotted below the entry bar.
* **Target Calculation**: Calculates **Target 1** as 50% retracement of the distance between the latest swing high and the lowest low.
* **Dynamic Table Display**: Shows real-time **Entry Price** and **Target 1** values in a table fixed on the chart (top-right corner), updating with each signal.
* **Alerts**: Sends alerts when a breakout entry signal occurs, making it easy to automate notifications.
* **Clean Visualization**: Removes clutter by eliminating extra labels and lines, using only a simple arrow and table for clarity.
**Use Case:**
Ideal for breakout traders, swing traders, and those who follow retracement-based profit targets. The indicator helps identify early entries after significant lows and provides a clear first target level.
Smart Money Breakout Moving Strength [GILDEX]🟠OVERVIEW
This script draws breakout detection zones called “Smart Money Breakout Channels” based on volatility-normalized price movement and visualizes them as dynamic boxes with volume overlays. It identifies temporary accumulation or distribution ranges using a custom normalized volatility metric and tracks when price breaks out of those zones—either upward or downward. Each channel represents a structured range where smart money may be active, helping traders anticipate key breakouts with added context from volume delta, up/down volume, and a visual gradient gauge for momentum bias.
🟠CONCEPTS
The script calculates normalized price volatility by measuring the standard deviation of price mapped to a scale using the highest and lowest prices over a set lookback period. When normalized volatility reaches a local low and flips upward, a boxed channel is drawn between the highest and lowest prices in that zone. These boxes persist until price breaks out, either with a strong candle close (configurable) or by touching the boundary. Volume analysis enhances interpretation by rendering delta bars inside the box, showing volume distribution during the channel. Additionally, a real-time visual “gauge” shows where volume delta sits within the channel range, helping users spot pressure imbalances.
Opening Range BreakoutThis indicator is designed for Opening Range Breakout (ORB) traders who want automatic calculation of breakout levels and multiple price targets.
It is optimised for NSE intraday trading, capturing the first 15-minute range from 09:15 to 09:30 and plotting key breakout targets for both long and short trades.
✨ Features:
Automatic daily reset — fresh levels are calculated every trading day.
Opening Range High & Low plotted immediately after 09:30.
Two profit targets for both Buy & Sell breakouts based on the opening range size:
T1 = 100% of range added/subtracted from OR high/low.
T2 = 200% of range added/subtracted from OR high/low.
Clear breakout signals (BUY / SELL labels) when price crosses the OR High or Low.
Custom alerts for both buy and sell triggers.
Designed to work on any intraday timeframe (1min, 3min, 5min, etc.).
📊 How it works:
From 09:15 to 09:30, the script records the highest and lowest prices.
At 09:30, the range is locked in and breakout targets are calculated automatically.
Buy and Sell signals are generated when price breaks above the OR High or below the OR Low.
Targets and range lines automatically reset for the next day.
⚠️ Notes:
This script is tuned for NSE market timings but can be adapted for other markets by changing the session input.
Works best on intraday charts for active traders.
This is not financial advice — always backtest before trading live.
ombs- PONY Breakout Alert
🧠 תקציר הסקריפט: **PONY Breakout Alert 📈
🔍 **מטרה**:
לזהות **פריצה מעלה של רמת 14.15** תוך כדי **מחזור מסחר גבוה מהממוצע**, כדי לאתר **הזדמנות מסחר שורית**.
---
⚙️ רכיבי הסקריפט:
* 📌 **רמת כניסה**:
`entryLevel = 14.15`
* 📊 **תנאי כניסה**:
* סגירת מחיר **מעל 14.15**
* נפח מסחר **גבוה ב־20% מהממוצע ל־20 הימים האחרונים**
* 🔔 **התראה ויזואלית**:
* סמל ירוק "Entry" מופיע מתחת לנר על הגרף
* קווים קבועים לרמות יעד וסטופלוס
* 🎯 **יעדי רווח**:
* Target 1 – 15.15
* Target 2 – 16.00
* Target 3 – 17.00
* 🛑 **סטופלוס**:
* שמרני: 13.20
* אגרסיבי: 12.80
* 🔔 **התראה אוטומטית** (`alertcondition`):
תשלח הודעה:
*"PONY פרצה מעל 14.15 עם מחזור גבוה – שקול כניסה לעסקה."*
---
📝 מתאים עבור:
* סוחרי ניתוח טכני 🧮
* מי שמחפש כניסה מבוססת על פריצה + נפח 📊
* שימוש על גרף יומי בלבד 📅
---
🧠 Script Summary: PONY Breakout Alert 📈
🔍 Objective:
Detect a breakout above the 14.15 level accompanied by high trading volume, in order to identify a bullish trading opportunity.
⚙️ Script Components:
📌 Entry Level:
entryLevel = 14.15
📊 Entry Conditions:
Price closes above 14.15
Volume is 20% higher than the 20-day average
🔔 Visual Alert:
A green "Entry" label appears below the bar on the chart
Static horizontal lines mark targets and stop-loss levels
🎯 Profit Targets:
Target 1 – 15.15
Target 2 – 16.00
Target 3 – 17.00
🛑 Stop Loss:
Conservative: 13.20
Aggressive: 12.80
🔔 Automated Alert (alertcondition):
Sends a message:
"PONY has broken above 14.15 with high volume – consider a long position."
📝 Ideal For:
Technical traders 🧮
Those seeking breakouts confirmed by volume 📊
Daily chart setups only 📅