Aggregate PDH High Break Alert**Aggregate PDH High Break Alert**
**Overview**
The “Aggregate PDH High Break Alert” is a lightweight Pine Script v6 indicator designed to instantly notify you when today’s price breaks above any prior-day high in a user-defined lookback window. Instead of manually scanning dozens of daily highs, this script automatically loops through the last _N_ days (up to 100) and fires a single-bar alert the moment price eclipses a specific day’s high.
**Key Features**
- **Dynamic Lookback**: Choose any lookback period from 1 to 100 days via a single `High-Break Lookback` input.
- **Single Security Call**: Efficiently retrieves the entire daily-high series in one call to avoid TradingView’s 40-call security limit.
- **Automatic Looping**: Internally loops through each prior-day high, so there’s no need to manually code dozens of lines.
- **Custom Alerts**: Generates a clear, formatted alert message—e.g. “Crossed high from 7 day(s) ago”—for each breakout.
- **Lightweight & Maintainable**: Compact codebase (<15 lines) makes tweaking and debugging a breeze.
**Inputs**
- **High-Break Lookback (days)**: Number of past days to monitor for high breaks. Valid range: 1–100.
**How to Use**
1. **Add to Chart**: Open TradingView, click “Indicators,” then “Create,” and paste in the code.
2. **Configure Lookback**: In the script’s settings, set your desired lookback window (e.g., 20 for the past 20 days).
3. **Enable Alerts**: Right-click the indicator’s name on your chart, select “Add Alert on Aggregate PDH High Break Alert,” and choose “Once per bar close.”
4. **Receive Notifications**: Whenever price crosses above any of the specified prior-day highs, you’ll get an on-screen and/or mobile push alert with the exact number of days ago.
**Use Cases**
- **Trend Confirmation**: Confirm fresh bullish momentum when today’s high outpaces any of the last _N_ days.
- **Breakout Trading**: Automate entries off multi-day highs without manual chart scanning.
- **System Integration**: Integrate with alerts to trigger orders in third-party bots or webhook receivers.
**Disclaimer**
Breakouts alone do not guarantee sustained moves. Combine with your preferred risk management, volume filters, and other indicators for higher-probability setups. Use on markets and timeframes where daily breakout behavior aligns with your strategy.
Buscar en scripts para "break"

Smart Range Breakout - SwiftEdgeDescription:
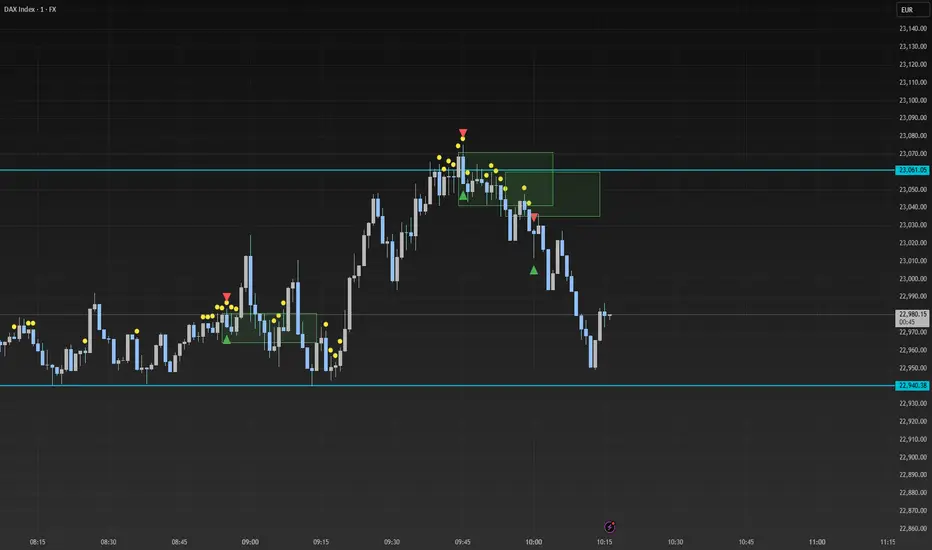
The "Smart Range Breakout - SwiftEdge" indicator is a custom tool designed for identifying potential breakout opportunities on a 1-minute chart, with a focus on volatile markets like the DAX index. This script introduces a unique approach by combining range consolidation detection with volume confirmation and breakout validation, tailored for short-term trading strategies.
How It Works:
The indicator identifies consolidation periods where the price range (difference between the highest high and lowest low over a user-defined length) is below a multiple of the Average True Range (ATR). This helps detect periods of low volatility, which often precede breakouts.
Once a consolidation is confirmed (minimum number of bars), a green box is drawn on the chart, spanning a fixed length of bars (default 50), representing the potential breakout zone.
Breakouts are signaled only when a candle opens above the upper boundary (box top) or below the lower boundary (box bottom) of the consolidation box, ensuring a clear entry point based on price action at the open.
The script includes a volume filter, requiring volume to exceed a moving average by a specified multiplier, and a confirmation period to validate the breakout over consecutive bars.
To avoid signal clutter, only one breakout signal (up or down) is generated per box, and no further signals are issued until a new consolidation box is formed.
How to Use:
Apply the indicator to a 1-minute chart (optimized for DAX or similar volatile indices).
Adjust the "Consolidation Length" (default 5) to set the lookback period for detecting consolidation.
Modify the "Range Threshold (ATR Multiplier)" (default 2.0) to make the consolidation detection more or less strict based on market volatility.
Use "Minimum Consolidation Bars" (default 2) to set the minimum duration of a consolidation phase.
Tune "Confirmation Bars" (default 1) to require more bars to confirm the breakout.
Set "Volume MA Length" (default 5) and "Volume Multiplier" (default 1.1) to filter breakouts with insufficient volume.
Adjust "Max Box Length" (default 50) to control the duration of the breakout zone on the chart.
Look for green triangles below the chart for bullish breakouts and red triangles above for bearish breakouts, occurring when a candle opens outside the box with confirmed volume.
Originality:
This script stands out by integrating a fixed-length consolidation box with an opening-price breakout condition, combined with volume and multi-bar confirmation. Unlike traditional breakout indicators that rely solely on closing prices or simple price thresholds, this approach prioritizes the opening price and limits signals to one per cycle, reducing noise in volatile markets.
Chart Notes:
The accompanying chart displays the indicator's output with green boxes indicating consolidation zones, yellow dots marking consolidation periods, and green/red triangles for breakout signals. No additional scripts or unrelated drawings are included to ensure clarity.
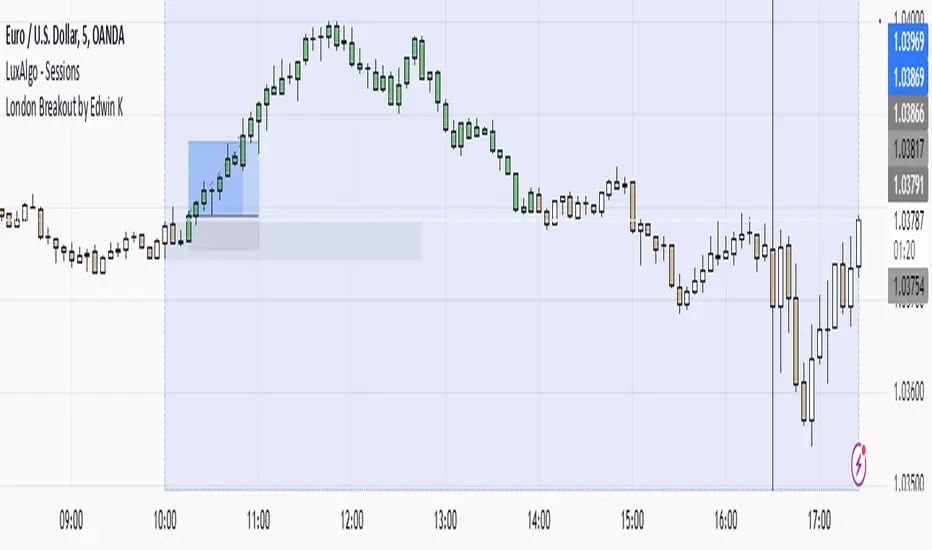
London Breakout by Edwin KPurpose:
The strategy visualizes breakouts based on price action during the London session. It highlights the candles from 09:59 AM to 01:59 PM UTC+3 with different colors depending on whether the price is above or below the high/low from the 10 AM candle.
Key Parts:
Timestamps:
The code defines specific times for the 09:59 AM candle, 10:00 AM candle, and 01:59 PM UTC+3 times.
The timestamp('UTC+3', ...) function creates the timestamps for those moments.
High and Low of the 10 AM Candle:
The high and low of the 10 AM candle are captured and stored in the ten_am_high and ten_am_low variables.
Bullish and Bearish Conditions:
If the price breaks above (bullish_break) or below (bearish_break) the high or low of the 10 AM candle, respectively.
Bar Coloring:
If the conditions are met (price breaking above or below the 10 AM levels), the script colors the candles during the time frame (09:59 AM to 01:59 PM).
Green color is applied for bullish breakouts.
Red color is applied for bearish breakouts.
hector mena Breakout Trading with ATR, RSI and MA CrossTitle: Breakout Trading Strategy with ATR, RSI, and Moving Average Cross
Description (English):
This script combines key technical indicators—ATR (Average True Range), RSI (Relative Strength Index), and Moving Averages—to provide a comprehensive breakout trading strategy. It is designed to help traders identify significant breakout levels and confirm signals with momentum and trend analysis.
How It Works:
ATR for Breakout Levels:
The ATR is used to calculate dynamic breakout levels by adjusting the highest resistance and lowest support levels with a customizable multiplier. This ensures that breakout levels adapt to market volatility.
RSI for Momentum Confirmation:
The RSI identifies overbought and oversold conditions, providing an additional layer of confirmation for breakouts. A breakout accompanied by an RSI signal can indicate stronger momentum.
Moving Average Cross for Trend Validation:
Two simple moving averages (short-term and long-term) are included to validate the trend. A crossover suggests a potential change in trend, aligning with breakout signals.
Why Combine These Indicators?
The ATR ensures breakout levels are realistic and volatility-adjusted.
The RSI avoids false signals by confirming if the price has momentum during a breakout.
Moving Average crossovers add trend-following confirmation, helping traders align with market direction.
The combination provides a robust framework to filter out false signals and improve the reliability of trading decisions.
Key Features:
Breakout Levels: Upper and lower breakout levels dynamically calculated using ATR.
RSI Confirmation: Visual overbought (70) and oversold (30) levels and RSI plot.
Trend Validation: Short and long-term moving averages plotted on the chart with crossover signals.
Visual Alerts: Clear "BUY" and "SELL" labels for actionable signals.
Custom Alerts: Configurable alerts for breakouts and moving average crossovers.
How to Use It:
Adjust the parameters (ATR length, multiplier, RSI length, and moving averages) based on your trading strategy.
Look for "BUY" signals when:
Price breaks above the resistance level, and RSI indicates oversold conditions.
Moving averages cross bullishly.
Look for "SELL" signals when:
Price breaks below the support level, and RSI indicates overbought conditions.
Moving averages cross bearishly.
Use alerts for automated notifications about potential trades.
Notes:
This script is intended for educational purposes. Use it alongside proper risk management techniques and backtesting.
Always test in demo mode before applying it to live trading.

The Curved Market Structure [BigBeluga]Curved Market Structure
The Curved Market Structure indicator offers an innovative twist on traditional market structure tools by using curved lines instead of horizontal ones, enabling faster breakout detection for traders.
🔵Key Features:
Curved Market Structure Levels: The indicator identifies high and low pivots and plots curved lines connecting these points, adapting to market dynamics and providing a more intuitive view of potential breakout zones.
Breakout Detection: Breakouts above or below the curved levels are marked with triangle symbols (▲ or ▼), making it easy to spot critical price movements.
Dynamic Target Levels: After a breakout, the indicator plots three target levels, which serve as potential price objectives. Each target is marked with a number and a star (e.g., 1★) upon being reached.
Customizable Line Length and Angle: Users can adjust the length and angle of the curved lines to fit their trading style and timeframe, making the tool versatile and adaptable.
Market Structure Trend Filtering: To maintain a clean chart, the indicator plots curved levels only from high pivots during uptrends and low pivots during downtrends.
🔵How It Works:
The indicator identifies high and low pivots using user-defined parameters (left and right bars).
Curved lines are drawn from these pivot points, showing the structure of the market and potential breakout zones.
When a breakout occurs, the indicator highlights the direction with triangle symbols and dynamically plots three price targets.
Upon reaching these targets, the level is marked with its respective number and a star, helping traders track price progression effectively.
The lines and targets are adjusted based on market conditions, ensuring real-time relevance and accuracy.
🔵Use Cases:
Spotting key breakout zones to identify entry and exit points more effectively.
Setting dynamic target levels for take-profit or stop-loss planning.
Filtering market noise and maintaining a cleaner chart while analyzing trends.
Enhancing traditional market structure analysis with an intuitive curved visualization.
This indicator is ideal for traders who want a modern, dynamic, and visually appealing way to track market structure and breakouts while maintaining chart clarity.

Jackson Volume breaker Indication# Jackson Volume Breaker Beta
### Advanced Volume Analysis Indicator
## Description
The Jackson Volume Breaker Beta is a sophisticated volume analysis tool that helps traders identify buying and selling pressure by analyzing price action and volume distribution. This indicator separates and visualizes buying and selling volume based on where the price closes within each candle's range, providing clear insights into market participation and potential trend strength.
## Key Features
1. **Smart Volume Distribution**
- Automatically separates buying and selling volume
- Color-coded volume bars (Green for buying, Red for selling)
- Winning volume always displayed on top for quick visual reference
2. **Real-time Volume Analysis**
- Shows current candle's buy/sell ratio
- Displays total volume with smart number formatting (K, M, B)
- Percentage-based volume distribution
3. **Technical Overlays**
- 20-period Volume Moving Average
- Dynamic scaling relative to price action
- Clean, uncluttered visual design
## How to Use
### Installation
1. Add the indicator to your chart
2. Adjust the Volume Scale input based on your preference (default: 0.08)
3. Toggle the Moving Average display if desired
### Reading the Indicator
#### Volume Bars
- **Green Bars**: Represent buying volume
- **Red Bars**: Represent selling volume
- **Stacking**: The larger volume (winning side) is always displayed on top
- **Height**: Relative to the actual volume, scaled for chart visibility
#### Information Table
The top-right table shows three key pieces of information:
1. **Left Percentage**: Winning side's volume percentage
2. **Middle Percentage**: Losing side's volume percentage
3. **Right Number**: Total volume (abbreviated)
### Trading Applications
1. **Trend Confirmation**
- Strong buying volume in uptrends confirms bullish pressure
- High selling volume in downtrends confirms bearish pressure
- Volume divergence from price can signal potential reversals
2. **Support/Resistance Breaks**
- High volume on breakouts suggests stronger moves
- Low volume on breaks might indicate false breakouts
- Monitor volume distribution for break direction confirmation
3. **Reversal Identification**
- Volume shift from selling to buying can signal potential bottoms
- Shift from buying to selling can indicate potential tops
- Use with price action for better entry/exit points
## Input Parameters
1. **Volume Scale (0.01 to 1.0)**
- Controls the height of volume bars
- Default: 0.08
- Adjust based on your chart size and preference
2. **Show MA (True/False)**
- Toggles 20-period volume moving average
- Useful for identifying volume trends
- Default: True
3. **MA Length (1+)**
- Changes the moving average period
- Default: 20
- Higher values for longer-term volume trends
## Best Practices
1. **Multiple Timeframe Analysis**
- Compare volume patterns across different timeframes
- Look for volume convergence/divergence
- Use higher timeframes for major trend confirmation
2. **Combine with Other Indicators**
- Price action patterns
- Support/resistance levels
- Momentum indicators
- Trend indicators
3. **Volume Pattern Recognition**
- Monitor for unusual volume spikes
- Watch for volume climax patterns
- Identify volume dry-ups
## Tips for Optimization
1. Adjust the Volume Scale based on your chart size
2. Use smaller timeframes for detailed volume analysis
3. Compare current volume bars to historical patterns
4. Watch for volume/price divergences
5. Monitor volume distribution changes near key price levels
## Note
This indicator works best when combined with proper price action analysis and risk management strategies. It should not be used as a standalone trading system but rather as part of a comprehensive trading approach.
## Version History
- Beta Release: Initial public version
- Features buy/sell volume separation, moving average, and real-time analysis
- Optimized for both intraday and swing trading timeframes
## Credits
Developed by Jackson based on other script creators
Special thanks to the trading community for feedback and suggestions

MTF Squeeze Analyzer - [tradeviZion]MTF Squeeze Analyzer
Multi-Timeframe Squeeze Pro Analyzer Tool
Overview:
The MTF Squeeze Analyzer is a comprehensive tool designed to help traders monitor the TTM Squeeze indicator across multiple timeframes in a streamlined and efficient manner. Built with Pine Script™ version 5, this indicator enhances your market analysis by providing detailed insights into squeeze conditions and momentum shifts, enabling you to make more informed trading decisions.
Key Features:
1. Multi-Timeframe Monitoring:
Comprehensive Coverage: Track squeeze conditions across multiple timeframes, including 1-minute, 5-minute, 15-minute, 30-minute, 1-hour, 2-hour, 4-hour, and daily charts.
Squeeze Counts: Keep count of the number of consecutive bars the price has been within each squeeze level (low, mid, high), helping you assess the strength and duration of consolidation periods.
2. Dynamic Table Display:
Customizable Appearance: Adjust table position, text size, and colors to suit your preferences.
Color-Coded Indicators: Easily identify squeeze levels and momentum shifts with intuitive color schemes.
Message Integration: Features rotating messages to keep you engaged and informed.
3. Alerts for Key Market Events:
Squeeze Start and Fire Alerts: Receive notifications when a squeeze starts or fires on your selected timeframes.
Custom Squeeze Count Alerts: Set thresholds for squeeze counts and get alerted when these levels are reached, allowing you to anticipate potential breakouts.
Fully Customizable: Choose which alerts you want to receive and tailor them to your trading strategy.
4. Momentum Analysis:
Momentum Oscillator: Visualize momentum using a histogram that changes color based on momentum shifts.
Detailed Insights: Determine whether momentum is increasing or decreasing to make more strategic trading decisions.
How It Works:
The indicator is based on the TTM Squeeze concept, which identifies periods of low volatility where the market is "squeezing" before a potential breakout. It analyzes the relationship between Bollinger Bands and Keltner Channels to determine squeeze conditions and uses linear regression to calculate momentum.
1. Squeeze Levels:
No Squeeze (Green): Market is not in a squeeze.
Low Compression Squeeze (Gray): Mild consolidation, potential for a breakout.
Mid Compression Squeeze (Red): Moderate consolidation, higher breakout potential.
High Compression Squeeze (Orange): Strong consolidation, significant breakout potential.
2. Squeeze Counts:
Tracks the number of consecutive bars in each squeeze condition.
Helps identify how long the market has been consolidating, providing clues about potential breakout timing.
3. Momentum Histogram:
Upward Momentum: Shown in aqua or blue, indicating increasing or decreasing upward momentum.
Downward Momentum: Displayed in red or yellow, representing increasing or decreasing downward momentum.
Using Alerts:
Stay ahead of market movements with customizable alerts:
1. Enable Alerts in Settings:
Squeeze Start Alert: Get notified when a new squeeze begins.
Squeeze Fire Alert: Be alerted when a squeeze ends, signaling a potential breakout.
Squeeze Count Alert: Set a specific number of bars for a squeeze condition, and receive an alert when this count is reached.
2. Set Up Alerts on Your Chart:
Click on the indicator name and select " Add Alert on MTF Squeeze Analyzer ".
Choose your desired alert conditions and customize the notification settings.
Click " Create " to activate the alerts.
How to Set It Up:
1. Add the Indicator to Your Chart:
Search for " MTF Squeeze Analyzer " in the TradingView Indicators library.
Add it to your chart.
2. Customize Your Settings:
Table Display:
Choose whether to show the table and select its position on the chart.
Adjust text size and colors to enhance readability.
Timeframe Selection:
Select the timeframes you want to monitor.
Enable or disable specific timeframes based on your trading strategy.
Colors & Styles:
Customize colors for different squeeze levels and momentum shifts.
Adjust header and text colors to match your chart theme.
Alert Settings:
Enable alerts for squeeze start, squeeze fire, and squeeze counts.
Set your preferred squeeze type and count threshold for alerts.
3. Interpret the Data:
Table Information:
The table displays the squeeze status and counts for each selected timeframe.
Colors indicate the type of squeeze, making it easy to assess market conditions at a glance.
Momentum Histogram:
Use the histogram to gauge the strength and direction of market momentum.
Observe color changes to identify shifts in momentum.
Why Use MTF Squeeze Analyzer ?
Enhanced Market Insight:
Gain a deeper understanding of market dynamics by monitoring multiple timeframes simultaneously.
Identify potential breakout opportunities by analyzing squeeze durations and momentum shifts.
Customizable and User-Friendly:
Tailor the indicator to fit your trading style and preferences.
Easily adjust settings without needing to delve into the code.
Time-Efficient:
Save time by viewing all relevant squeeze information in one place.
Reduce the need to switch between different charts and timeframes.
Stay Informed with Alerts:
Never miss a critical market movement with fully customizable alerts.
Focus on other tasks while the indicator monitors the market for you.
Acknowledgment:
This tool builds upon the foundational work of John Carter , who developed the TTM Squeeze concept. It also incorporates enhancements from LazyBear and Makit0 , providing a more versatile and powerful indicator. MTF Squeeze Analyzer extends these concepts by adding multi-timeframe analysis, squeeze counting, and advanced alerting features, offering traders a comprehensive solution for market analysis.
Note: Always practice proper risk management and test the indicator thoroughly to ensure it aligns with your trading strategy. Past performance is not indicative of future results.
Trade smarter with TradeVizion—unlock your trading potential today!

High/Low Breakout Statistical Analysis StrategyThis Pine Script strategy is designed to assist in the statistical analysis of breakout systems on a monthly, weekly, or daily timeframe. It allows the user to select whether to open a long or short position when the price breaks above or below the respective high or low for the chosen timeframe. The user can also define the holding period for each position in terms of bars.
Core Functionality:
Breakout Logic:
The strategy triggers trades based on price crossing over (for long positions) or crossing under (for short positions) the high or low of the selected period (daily, weekly, or monthly).
Timeframe Selection:
A dropdown menu enables the user to switch between the desired timeframe (monthly, weekly, or daily).
Trade Direction:
Another dropdown allows the user to select the type of trade (long or short) depending on whether the breakout occurs at the high or low of the timeframe.
Holding Period:
Once a trade is opened, it is automatically closed after a user-defined number of bars, making it useful for analyzing how breakout signals perform over short-term periods.
This strategy is intended exclusively for research and statistical purposes rather than real-time trading, helping users to assess the behavior of breakouts over different timeframes.
Relevance of Breakout Systems:
Breakout trading systems, where trades are executed when the price moves beyond a significant price level such as the high or low of a given period, have been extensively studied in financial literature for their potential predictive power.
Momentum and Trend Following:
Breakout strategies are a form of momentum-based trading, exploiting the tendency of prices to continue moving in the direction of a strong initial movement after breaching a critical support or resistance level. According to academic research, momentum strategies, including breakouts, can produce returns above average market returns when applied consistently. For example, Jegadeesh and Titman (1993) demonstrated that stocks that performed well in the past 3-12 months continued to outperform in the subsequent months, suggesting that price continuation patterns, like breakouts, hold value .
Market Efficiency Hypothesis:
While the Efficient Market Hypothesis (EMH) posits that markets are generally efficient, and it is difficult to outperform the market through technical strategies, some studies show that in less liquid markets or during specific times of market stress, breakout systems can capitalize on temporary inefficiencies. Taylor (2005) and other researchers have found instances where breakout systems can outperform the market under certain conditions.
Volatility and Breakouts:
Breakouts are often linked to periods of increased volatility, which can generate trading opportunities. Coval and Shumway (2001) found that periods of heightened volatility can make breakouts more significant, increasing the likelihood that price trends will follow the breakout direction. This correlation between volatility and breakout reliability makes it essential to study breakouts across different timeframes to assess their potential profitability .
In summary, this breakout strategy offers an empirical way to study price behavior around key support and resistance levels. It is useful for researchers and traders aiming to statistically evaluate the effectiveness and consistency of breakout signals across different timeframes, contributing to broader research on momentum and market behavior.
References:
Jegadeesh, N., & Titman, S. (1993). Returns to Buying Winners and Selling Losers: Implications for Stock Market Efficiency. Journal of Finance, 48(1), 65-91.
Fama, E. F., & French, K. R. (1996). Multifactor Explanations of Asset Pricing Anomalies. Journal of Finance, 51(1), 55-84.
Taylor, S. J. (2005). Asset Price Dynamics, Volatility, and Prediction. Princeton University Press.
Coval, J. D., & Shumway, T. (2001). Expected Option Returns. Journal of Finance, 56(3), 983-1009.

Simultaneous INSIDE Bar Break IndicatorSimultaneous Inside Bar Break Indicator (SIBBI) for The Strat Community
Overview:
The Simultaneous Inside Bar Break Indicator (SIBBI) is designed to help traders using The Strat methodology identify one of the most powerful breakout patterns: the Simultaneous Inside Bar Break across multiple symbols. This indicator detects when all four user-selected symbols form inside bars on the previous candle and then break those inside bars in the same direction (either bullish or bearish) on the current candle.
Inside bars represent consolidation periods where price action does not break the high or low of the previous candle. When a simultaneous break occurs across multiple symbols, this often signals a strong move in the market, making this a key actionable signal in The Strat trading strategy.
Key Features:
Multi-Symbol Analysis: You can track up to four different symbols simultaneously. By default, the indicator comes with SPY, QQQ, IWM, and DIA, but you can modify these to track any other assets or symbols.
Inside Bar Detection: The indicator checks whether all four symbols have inside bars on the previous candle. It only triggers when all symbols meet this condition, making it a highly specific and reliable signal.
Simultaneous Break Detection: Once all symbols have inside bars, the indicator waits for a breakout in the same direction across all four symbols. A simultaneous bullish break (prices breaking above the previous candle’s high) triggers a green label, while a simultaneous bearish break (prices breaking below the previous candle’s low) triggers a red label.
Dynamic Label Timeframe: The indicator dynamically adjusts the timeframe in the label based on the user’s selected timeframe. This allows traders to know precisely which timeframe the break is occurring on. If the user selects "Chart Timeframe," the indicator will evolve with the current chart's timeframe, making it more versatile.
Timeframe Flexibility: The indicator can be set to analyze any timeframe—15-minute, 30-minute, 60-minute, daily, weekly, and so on. It only works for the specific timeframe you set it to in the settings. If set to "Chart Timeframe," the label will adapt dynamically based on the timeframe you are currently viewing.
Customizable Labels: The user can choose the size of the labels (tiny, small, or normal), ensuring that the visual output is tailored to individual preferences and chart layouts.
Best Use Case:
The Simultaneous Inside Bar Break Indicator is particularly powerful when applied to multiple timeframes. Here’s how to use it for maximum impact:
Multi-Timeframe Setup: Set the indicator on various timeframes (e.g., 15-minute, 30-minute, 60-minute, and daily) across multiple charts. This allows you to monitor different timeframes and identify when lower timeframe breaks trigger potential moves on higher timeframes.
Anticipating Strong Moves: When a simultaneous inside bar break occurs on one timeframe (e.g., 30-minute), keep an eye on the higher timeframes (e.g., 60-minute or daily) to see if those timeframes also break. This stacking of inside bar breaks can signal powerful market moves.
Higher Conviction Signals: The indicator is designed to provide high-conviction signals. Since it requires all four symbols to break in the same direction simultaneously, it reduces false signals and focuses on higher probability setups, which is crucial for traders using The Strat to time their trades effectively.
How the Indicator Works:
Inside Bar Formation: The indicator first checks that all four selected symbols had inside bars in the previous bar (i.e., the current high and low are contained within the previous bar’s high and low).
Simultaneous Break Detection: After detecting inside bars, the indicator checks if all four symbols break out in the same direction—bullish (breaking above the previous bar’s high) or bearish (breaking below the previous bar’s low).
Label Display: When a simultaneous inside bar break occurs, a label is plotted on the chart—either green for a bullish break (below the candle) or red for a bearish break (above the candle). The label will display the timeframe you set in the settings (e.g., "IBSB 60" for a 60-minute break).
Chart Timeframe Option: If you prefer, you can set the indicator to evolve with the chart’s current timeframe. In this mode, the label will not show a specific timeframe but will still display the simultaneous inside bar break when it occurs.
Recommendations for Usage:
Focus on Multiple Timeframes: The Strat methodology is all about understanding the relationship between different timeframes. Use this indicator on multiple timeframes to get a better picture of potential moves.
Pair with Other Strat Techniques: This indicator is most powerful when combined with other Strat tools, such as broadening formations, timeframe continuity, and actionable signals (e.g., 2-2 reversals). The simultaneous inside bar break can help confirm or invalidate other signals.
Customize Symbols and Timeframes: Although the default symbols are SPY, QQQ, IWM, and DIA, feel free to replace them with symbols more relevant to your trading. This indicator works well across equities, indices, futures, and forex pairs.
How to Set It Up:
Select Symbols: Choose four symbols that you want to track. These can be index ETFs (like SPY and QQQ), individual stocks, or any other tradable instruments.
Set Timeframe: In the indicator’s settings, choose a specific timeframe (e.g., 15-minute, 30-minute, daily). The label will reflect the selected timeframe, making it clear which time-based break you are seeing.
Optional - Chart Timeframe Mode: If you want the indicator to adapt to the chart’s current timeframe, select the "Chart Timeframe" option in the settings. The indicator will plot the breaks without showing a specific timeframe in the label.
Customize Label Size: Depending on your chart layout and personal preference, you can adjust the size of the labels (tiny, small, or normal) in the settings.
Conclusion:
The Simultaneous Inside Bar Break Indicator is a powerful tool for traders using The Strat methodology, offering a highly specific and reliable signal that can indicate potential large market moves. By monitoring multiple symbols and timeframes, you can gain deeper insight into the market's behavior and act with greater confidence. This indicator is ideal for traders looking to catch high-conviction moves and align their trades with broader market continuity.
Note: The indicator works best when paired with multi-timeframe analysis, allowing you to see how breaks on lower timeframes might influence larger trends. For traders who prefer simplicity, setting it to the "Chart Timeframe" mode offers flexibility while maintaining the core benefits of this indicator.

Ranges and Breakouts [AlgoAlpha]💥 Ranges and Breakouts by AlgoAlpha is a dynamic indicator designed for traders seeking to identify market ranges and capitalize on breakout opportunities. This tool automatically detects ranges based on price action over a specified period, visualizing these ranges with shaded boxes and midlines, making it easy to spot potential breakout scenarios. The indicator includes advanced features such as customizable pivot detection, internal range allowance, and automatic trend color changes for quick market analysis.
Key Features
💹 Dynamic Range Detection : Automatically identifies market ranges using customizable look-back and confirmation periods.
🎯 Breakout Alerts : Get alerted to bullish and bearish breakouts for potential trading opportunities.
📊 Visual Aids : Displays pivot highs/lows within ranges and plots midlines with adjustable styles for easier market trend interpretation.
🔔 Alerts : Signals potential take-profit points based on volatility and moving average crossovers.
🎨 Customizable Appearance : Choose between solid, dashed, or dotted lines for midlines and adjust the colors for bullish and bearish zones.
How to Use
⭐ Add the Indicator : Add the indicator to favorites by pressing the star icon. Adjust the settings like the look-back period, confirmation length, and pivot detection to match your trading strategy.
👀 Monitor the Chart : Watch for new ranges to form, highlighted by shaded boxes on the chart. Midlines and range bounds will appear to help you gauge potential breakout points.
⚡ React to Breakouts : Pay attention to color changes and alert signals for bullish or bearish breakouts. Use these signals to enter or exit trades.
🔔 Set Alerts : Customize alert conditions for new range formations, breakout signals, and take-profit levels to stay on top of market movements without constant monitoring.
How It Works
The indicator detects price ranges by analyzing the highest and lowest prices over a specified period. It confirms a range if these levels remain unchanged for a set number of bars, at which point it visually marks the range with shaded boxes. Pivots are identified within these ranges, and a midline is plotted to help interpret potential breakouts. When price breaks out of these defined ranges, the indicator changes the chart's background color to signal a bullish or bearish trend. Alerts can be set for range formation, breakouts, and take-profit opportunities, helping traders stay proactive in volatile markets.

Swing Points [CrossTrade]The "Swing Points" indicator is designed to help identify key swing points, trends, and potential support and resistance areas on a trading chart. This indicator overlays on the price chart and offers several features for enhanced market analysis.
Swing Point Identification: The indicator identifies swing highs and lows (pivot points) over a user-defined period. These points are crucial in understanding market reversals and momentum.
Swing Points Display: Users have the option to visually display these pivot points on the chart. Swing highs are marked with a red "H" above the bar, and swing lows with a green "L" below the bar, aiding in quick visual identification.
Center Line Calculation and Display: A dynamic center line is calculated using the pivot points, providing a baseline that adapts to market movements. The center line's appearance changes based on its position relative to the current price, making it a useful trend indicator.
Support and Resistance Levels: The indicator plots horizontal support and resistance lines based on the swing lows and highs, respectively. This feature helps traders identify potential areas of price consolidation or breakout.
Customization Options: Users can customize the period for swing point calculation and choose whether to display the pivot points, center line, and support/resistance levels.
Alert Features
Swing High Break Alert: An alert is triggered when a new swing high is detected, signaling a potential upward momentum shift.
Swing Low Break Alert: This alert activates when a new swing low is formed, possibly indicating a downward momentum shift.
Center Line Trend Color Change Alert: Alerts users when the center line changes its trend color, which could signify a change in overall market trend direction.

Fractal Breakout Trend Following StrategyOverview
The Fractal Breakout Trend Following Strategy is a trend-following system which utilizes the Willams Fractals and Alligator to execute the long trades on the fractal's breakouts which have a high probability to be the new uptrend phase beginning. This system also uses the normalized Average True Range indicator to filter trades after a large moves, because it's more likely to see the trend continuation after a consolidation period. Strategy can execute only long trades.
Unique Features
Trend and volatility filtering system: Strategy uses Williams Alligator to filter the counter-trend fractals breakouts and normalized Average True Range to avoid the trades after large moves, when volatility is high
Configurable Trading Periods: Users can tailor the strategy to specific market windows, adapting to different market conditions.
Flexible Risk Management: Users can choose the stop-loss percent (by default = 3%) for trades, but strategy also has the dynamic stop-loss level using down fractals.
Methodology
The strategy places stop order at the last valid fractal breakout level. Validity of this fractal is defined by the Williams Alligator indicator. If at the moment of time when price breaking the last fractal price is higher than Alligator's teeth line (8 period SMA shifted 5 bars in the future) this is a valid breakout. Moreover strategy has the additional volatility filtering system using normalized ATR. It calculates the average normalized ATR for last user-defined number of bars and if this value lower than the user-defined threshold value the long trade is executed.
When trade is opened, script places the stop loss at the price higher of two levels: user defined stop-loss from the position entry price or down fractal validation level. The down fractal is valid with the rule, opposite as the up fractal validation. Price shall break to the downside the last down fractal below the Willians Alligator's teeth line.
Strategy has no fixed take profit. Exit level changes with the down fractal validation level. If price is in strong uptrend trade is going to be active until last down fractal is not valid. Strategy closes trade when price hits the down fractal validation level.
Risk Management
The strategy employs a combined approach to risk management:
It allows positions to ride the trend as long as the price continues to move favorably, aiming to capture significant price movements. It features a user-defined stop-loss parameter to mitigate risks based on individual risk tolerance. By default, this stop-loss is set to a 3% drop from the entry point, but it can be adjusted according to the trader's preferences.
Justification of Methodology
This strategy leverages Williams Fractals to open long trade when price has broken the key resistance level to the upside. This resistance level is the last up fractal and is shall be broken above the Williams Alligator's teeth line to be qualified as the valid breakout according to this strategy. The Alligator filtering increases the probability to avoid the false breakouts against the current trend.
Moreover strategy has an additional filter using Average True Range(ATR) indicator. If average value of ATR for the last user-defined number of bars is lower than user-defined threshold strategy can open the long trade according to open trade condition above. The logic here is following: we want to open trades after period of price consolidation inside the range because before and after a big move price is more likely to be in sideways, but we need a trend move to have a profit.
Another one important feature is how the exit condition is defined. On the one hand, strategy has the user-defined stop-loss (3% below the entry price by default). It's made to give users the opportunity to restrict their losses according to their risk-tolerance. On the other hand, strategy utilizes the dynamic exit level which is defined by down fractal activation. If we assume the breaking up fractal is the beginning of the uptrend, breaking down fractal can be the start of downtrend phase. We don't want to be in long trade if there is a high probability of reversal to the downside. This approach helps to not keep open trade if trend is not developing and hold it if price continues going up.
Backtest Results
Operating window: Date range of backtests is 2023.01.01 - 2024.05.01. It is chosen to let the strategy to close all opened positions.
Commission and Slippage: Includes a standard Binance commission of 0.1% and accounts for possible slippage over 5 ticks.
Initial capital: 10000 USDT
Percent of capital used in every trade: 30%
Maximum Single Position Loss: -3.19%
Maximum Single Profit: +24.97%
Net Profit: +3036.90 USDT (+30.37%)
Total Trades: 83 (28.92% win rate)
Profit Factor: 1.953
Maximum Accumulated Loss: 963.98 USDT (-8.29%)
Average Profit per Trade: 36.59 USDT (+1.12%)
Average Trade Duration: 72 hours
These results are obtained with realistic parameters representing trading conditions observed at major exchanges such as Binance and with realistic trading portfolio usage parameters.
How to Use
Add the script to favorites for easy access.
Apply to the desired timeframe and chart (optimal performance observed on 4h and higher time frames and the BTC/USDT).
Configure settings using the dropdown choice list in the built-in menu.
Set up alerts to automate strategy positions through web hook with the text: {{strategy.order.alert_message}}
Disclaimer:
Educational and informational tool reflecting Skyrex commitment to informed trading. Past performance does not guarantee future results. Test strategies in a simulated environment before live implementation

Support and Resistance Breakouts By RICHIESupport and resistance are fundamental concepts in technical analysis used to identify price levels on charts that act as barriers, preventing the price of an asset from getting pushed in a certain direction. Here’s a detailed description of each and how breakout strategies are typically used:
Support
Support is a price level where a downtrend can be expected to pause due to a concentration of demand. As the price of an asset drops, it hits a level where buyers tend to step in, causing the price to rebound.
Support Level Identification: Support levels are identified by looking at historical data where prices have repeatedly fallen to a certain level but have then rebounded.
Strength of Support: The more times an asset price hits a support level without breaking below it, the stronger that support level is considered to be.
Resistance
Resistance is a price level where an uptrend can be expected to pause due to a concentration of selling interest. As the price of an asset increases, it hits a level where sellers tend to step in, causing the price to drop.
Resistance Level Identification: Resistance levels are identified by looking at historical data where prices have repeatedly risen to a certain level but have then fallen back.
Strength of Resistance: The more times an asset price hits a resistance level without breaking above it, the stronger that resistance level is considered to be.
Breakouts
A breakout occurs when the price moves above a resistance level or below a support level with increased volume. Breakouts can be significant because they suggest a change in supply and demand dynamics, often leading to strong price movements.
Breakout Above Resistance: Indicates a bullish market sentiment. Traders often interpret this as a sign to enter a long position (buy).
Breakout Below Support: Indicates a bearish market sentiment. Traders often interpret this as a sign to enter a short position (sell).
Breakout Trading Strategies
Confirmation: Wait for a candle to close beyond the support or resistance level to confirm the breakout.
Volume: Increased volume on a breakout adds credibility, suggesting that the price move is supported by strong buying or selling interest.
Retest: Sometimes, after a breakout, the price will return to the breakout level to test it as a new support or resistance. This retest offers another entry point.
Stop-Loss: Place stop-loss orders just below the resistance (for long positions) or above the support (for short positions) to limit potential losses in case of a false breakout.
Take-Profit: Identify target levels for taking profits. These can be set based on previous support/resistance levels or using tools like Fibonacci retracements.

Opening Range & Prior Day High/Low [Gorb]Introduction:
Opening Range & Prior Day High/Low indicator is an easy to use day traders tool. This indicator automatically plots the previous days high and low, as well as drawing a box from the opening range that the user specifies in the settings. These two together can help provide an indication of market sentiment and price trends for the day. They are often used as a trading strategy for day traders.
Overview:
The Opening Range , draws a box from the high to the low of the user defined time period and is extended until the end of the trading session. Most common are the 5/15/30min opening ranges.
Prior Day High/Low , draws lines from the previous days high and low that extend across the current session. These are used as support/resistance and also a marker to see market sentiment by crossing one of these levels.
The indicator is designed for all kinds of traders, offering a simple approach to automatically plot levels for you.
Features:
All skill-level friendly presets, easy to enable with one-click
Opening Range: Allows user to choose what time the range starts and ends to measure the high & low.
Extend Range Lines: allows the user to choose when the box stops extending according to the trading session time.
Enable Opening Range Box: allows the user to choose to plot the opening range or not.
ORB Border Color: allows the user to change the box border color.
ORB Box Shade Color: allows the user to change the background of the opening range box.
ORB Line Width: allows users to chose the width of the opening range box lines.
Enable Previous Day High: allows users to enable the previous days high to be plotted.
Enable Previous Day Low: allows users to enable the previous days high to be plotted.
Previous Day High Color: allows users to choose the color for this line.
Previous Day Low Color: allows users to choose the color for this line.
All colors are changeable for the user to customize to their liking.
Usage Demonstration
In the image below, we can see a basic example of how these 3 features function.
As explained above, the opening range is customizable to meet the users needs and can be disabled with one click. Same goes for the prior day high(green) and low(red) lines. All 3 are plotted each day automatically for the user if enabled.
In the image below, we can see an example of using the opening range break and prior day high together for a trading strategy.
This is a great example of using the prior day high with the opening range to use as a day trading strategy. It provides the trader with levels to watch for price to break out from for possible trade setups.
In this next image, we can see a failed breakdown from the opening range that results in a bullish breakout.
The first move was a fake breakdown with the failed rejection on the retest of the opening range lows. This led to a breakout above the range and a confirmation bounce on the breakout retest. Price did break above the prior day high and confirmed with a retest bounce on that level as well.
In the image below, we can see how previous days levels can act as resistance to use with the opening range.
Price didn't reject the opening range low, but it did reject the prior day high for the second time. This could be used as an entry or once price breaks down out of the opening range again.
Conclusion:
We believe in providing user-friendly tools to help speed up traders technical analysis and implement easy trading strategies. The goal is to provide a user-friendly indicator to automatically draw opening ranges and previous days levels to suit the users needs and trading style.
RISK DISCLAIMER
All content, tools, scripts & education provided by Monstanzer or Gorb Algo LLC are for informational & educational purposes only. Trading is risk and most lose their money, past performance does not guarantee future results.

LogTrend Retest EngineLogTrend Retest Engine (LTRE)
LogTrend Retest Engine (LTRE) is an advanced trend-continuation overlay designed to identify high-probability breakout retests using logarithmic regression , volatility-adjusted deviation bands , and market regime filtering .
Unlike traditional channels or moving averages, LTRE models price behavior in log space , allowing it to adapt naturally to exponential market moves common in crypto, indices, and long-term trends.
🔹 How It Works
Logarithmic Regression Core
Performs linear regression on log-transformed price and time
Produces a structurally accurate trend midline that scales with price growth
Volatility-Adjusted Deviation Bands
Dynamic upper and lower zones based on statistical deviation
ATR weighting expands or contracts bands as volatility changes
Adaptive Lookback (Optional)
Automatically adjusts regression length using volatility pressure
Faster response in high-volatility environments, smoother in consolidation
🔹 Market Regime Detection
LTRE actively filters conditions using:
R² trend strength (trend quality, not just slope)
Volatility compression vs expansion
User-defined minimum trend strength threshold
Signals are disabled during ranging or low-quality conditions .
🔹 Breakout → Retest Signal Logic
LTRE does not chase breakouts.
Signals trigger only when:
1. Price breaks cleanly outside the deviation band
2. Market regime is confirmed as trending
3. Price performs a controlled retest within a user-defined tolerance
BUY
Break above upper band → retest → trend confirmed
SELL
Break below lower band → retest → trend confirmed
This structure is designed to reduce false breakouts and late entries.
🔹 Visual & Projection Tools
Clean midline and deviation bands
Optional filled zones
Optional future trend projection for forward structure planning
On-chart statistics for trend strength and volatility compression
🔹 Best Use Cases
Trend continuation & pullback strategies
Crypto, Forex, Indices, and equities
Works best on 15m and higher timeframes
⚠️ Disclaimer
LTRE is a decision-support tool , not a complete trading system. Always use proper risk management and confirm signals with additional structure, volume, or higher-timeframe context.
Built for traders who wait for structure — not noise.

Box Theory [Interactive Zones] PyraTimeThis script combines Nicholas Darvas’s "Box Theory" with modern Supply and Demand (Premium/Discount) concepts. It automatically identifies the most recent Swing High and Swing Low to delineate the current trading range.
The purpose of this tool is to visualize market structure and help traders identify when price is relatively expensive (Premium) or cheap (Discount) within a defined range.
Visual Guide: What You Are Seeing
The Box: Represents the active trading range defined by the most recent significant Swing High and Swing Low.
Red Zone (Premium): The top 25% of the range. Mathematically, prices here are considered "expensive" relative to the current structure.
Green Zone (Discount): The bottom 25% of the range. Prices here are considered "cheap" relative to the current structure.
Grey Zone (Equilibrium): The middle 50% of the range. This is the area of fair value where price often consolidates.
Dashed Line (EQ): The exact 50% midpoint of the range.
Tutorial: How to Trade Using This Indicator
Method 1: Mean Reversion (Range Trading) This method applies when the market is moving sideways.
Identify Structure: Wait for a box to form.
Wait for Extremes: Do not trade when price is in the middle (Grey/White area). Wait for price to enter the Red or Green zones.
Entry Trigger:
Shorts: When price enters the Red Zone, look for a rejection (wicks leaving the zone) or a lower timeframe breakdown. Target the EQ (Midline) as your first take profit.
Longs: When price enters the Green Zone, look for support formation. Target the EQ (Midline) as your first take profit.
Method 2: Trend Continuation (Breakouts) This method applies when the market is trending strongly.
Breakout: Monitor the alerts. A close outside the box indicates a potential shift in market structure.
Retest: After a breakout up, the old "Red Zone" (Resistance) often flips to become new Support. Wait for price to pull back to the top of the old box before entering.
Configuration Guide (Settings)
Pivot Left/Right Bars (Sensitivity):
Default (20/20): Best for Swing Trading. It filters out market noise and only draws boxes based on major structural points.
Lower (5/5): Best for Scalping. It will create smaller, more frequent boxes but increases the risk of false signals.
Zone Percentage:
Default (25%): Standard deviation for Supply/Demand zones.
Alternative (15%): Use this for "sniping" entries at the absolute extremes of the range.
Multi-Timeframe (MTF):
Enable "Use Higher Timeframe" to see Daily or Weekly ranges while trading on lower timeframes (like the 15m or 1H). This helps keep your intraday trades aligned with the major trend.
Technical Note on "Lag" This indicator uses Pivots to draw the box. A pivot is only confirmed after a certain number of bars have passed (the "Pivot Right Bars" setting).
Example: If "Pivot Right Bars" is set to 20, the box will update 20 bars after the actual high or low occurred. This is necessary to confirm that the point was indeed a Swing High/Low. Do not treat the box lines as predictive; they are reactive to confirmed structure.

Hybrid Strategy: Trend/ORB/MTFHybrid Strategy: Trend + ORB + Multi-Timeframe Matrix
This script is a comprehensive "Trading Manager" designed to filter out noise and identify high-probability breakout setups. It combines three powerful concepts into a single, clean chart interface: Trend Alignment, Opening Range Breakout (ORB), and Multi-Timeframe (MTF) Analysis.
It is designed to prevent "analysis paralysis" by providing a unified Dashboard that confirms if the trend is aligned across 5 different timeframes before you take a trade.
How it Works
The strategy relies on the "Golden Trio" of confluence:
1. Trend Definition (The Setup) Before looking for entries, the script analyzes the immediate trend. A bullish trend is defined as:
Price is above the Session VWAP.
The fast EMA (9) is above the slow EMA (21). (The inverse applies for bearish trends).
2. The Signal (The Trigger) The script draws the Opening Range (default: first 15 minutes of the session).
Buy Signal: Price breaks above the Opening Range High while the Trend is Bullish.
Sell Signal: Price breaks below the Opening Range Low while the Trend is Bearish.
3. The Confirmation (The Filter) A signal is only valid if the Higher Timeframe (default: 60m) agrees with the direction. If the 1m chart says "Buy" but the 60m chart is bearish, the signal is filtered out to prevent false breakouts.
Key Features
The Matrix Dashboard A zero-lag, real-time table in the corner of your screen that monitors 5 user-defined timeframes (e.g., 5m, 15m, 30m, 60m, 4H).
Trend: Checks if Price > EMA 21.
VWAP: Checks if Price > VWAP.
ORB: Checks if Price is currently above/below the Opening Range of that session.
D H/L: Warns if price is near the Daily High or Low.
PD H/L: Warns if price is near the Previous Daily High or Low.
Visual Order Blocks The script automatically identifies valid Order Blocks (sequences of consecutive candles followed by a strong explosive move).
Chart: Draws Green/Red zones extending to the right, showing where price may react.
Dashboard: Displays the exact High, Low, and Average price of the most recent Order Blocks for precision planning.
Risk Management (Trailing Stop) Once a trade is active, the script plots Chandelier Exit dots (ATR-based trailing stop) to help you manage the trade and lock in profits during trend runs.
Visual Guide (Chart Legend)
⬜ Gray Box: Represents the Opening Range (first 15 minutes). This is your "No Trade Zone." Wait for price to break out of this box.
🟢 Green Line: The Opening Range High. A break above this line signals potential Bullish momentum.
🔴 Red Line: The Opening Range Low. A break below this line signals potential Bearish momentum.
🟢 Green / 🔴 Red Zones (Boxes): These are Order Blocks.
🟢 Green Zone: A Bullish Order Block (Demand). Expect price to potentially bounce up from here.
🔴 Red Zone: A Bearish Order Block (Supply). Expect price to potentially reject down from here.
⚪ Dots (Trailing Stop):
🟢 Green Dots: These appear below price during a Bullish trend. They represent your suggested Stop Loss.
🔴 Red Dots: These appear above price during a Bearish trend.
🏷️ Buy / Sell Labels:
BUY: Triggers when Price breaks the Green Line + Trend is Bullish + HTF is Bullish.
SELL: Triggers when Price breaks the Red Line + Trend is Bearish + HTF is Bearish.
Settings
Session: Customizable RTH (Regular Trading Hours) to filter out pre-market noise.
Matrix Timeframes: 5 fixed slots to choose which timeframes you want to monitor.
Order Blocks: Adjust the sensitivity and lookback period for Order Block detection.
Risk: Customize the ATR multiplier for the trailing stop.
Disclaimer
This tool is for educational purposes only. Past performance does not guarantee future results. Always manage your risk properly.

ATR Stop Loss Finder (Strict Breakout Mode)Title: ATR Stop Loss Finder (Strict Breakout Mode)
Description:
Volatility-Based Risk Management: Generates dynamic trailing stop-loss lines for both Long (Lower Line) and Short (Upper Line) positions based on ATR volatility.
Strict Breakout Detection: Features a unique "Strict Breakout" logic that highlights trend acceleration. It visually marks whenever the Long SL breaks a historical high or the Short SL breaks a historical low over a user-defined lookback period (e.g., 50 bars).
Visual Signals: Automatically plots Red Circles for bullish SL breakouts (New Highs) and Blue Circles for bearish SL breakdowns (New Lows), making strong momentum shifts easy to spot.
Real-Time Dashboard: Includes an informative table displaying current ATR and SL price levels for quick reference.

BB Breakout-Momentum + Reversion Strategies# BB Breakout-Momentum + Reversion Strategies
## Overview
This indicator combines two complementary Bollinger Band trading strategies that automatically adapt to market conditions. Strategy 1 capitalizes on trending markets with breakout-pullback-momentum setups, while Strategy 2 exploits mean reversion in ranging markets. Advanced filtering using ADX and BB Width ensures each strategy only fires in its optimal market environment.
---
## Strategy 1: Breakout → Pullback → Renewed Momentum (Long B / Short B)
### Best Market Conditions
- **Trending Markets**: ADX ≥ 25
- **High Volatility**: BB Width ≥ 1.0× average
- Directional price action with sustained momentum
### Entry Logic
**Long B (Bullish Breakout):**
1. **Initial Breakout**: Price breaks above upper Bollinger Band with strong momentum
2. **Controlled Pullback**: Price pulls back 1-12 bars but holds above lower band (stays in trend)
3. **Defended Zone**: Pullback creates a support zone based on swing lows (validated by multiple touches)
4. **Renewed Momentum**: Price reclaims with green candle, volume confirmation, bullish MACD
5. **Position Check**: Entry must have cushion below upper band and room to reach targets
**Short B (Bearish Breakdown):**
- Mirror logic for downtrends: breakdown below lower band, pullback stays below upper band, renewed selling pressure
### Risk Management
- **Stop Loss**: Lower of (zone floor/previous low) OR (1.5 × ATR from entry)
- **Targets**:
- T1: Entry + 0.85R (0.85 × 1.5 ATR)
- T2: Entry + 1.40R (1.40 × 1.5 ATR)
- T3: Entry + 2.50R (2.50 × 1.5 ATR)
- T4: Entry + 4.50R (4.50 × 1.5 ATR)
- Risk is calculated using ATR (ATRX = 1.5 ATR), stop uses tighter of structural level (ATRL) or ATRX
---
## Strategy 2: Bollinger Band Mean Reversion (Long R / Short R)
### Best Market Conditions
- **Ranging Markets**: ADX ≤ 20
- **Low Volatility**: BB Width ≤ 0.8× average
- Price oscillating around the mean without sustained trend
### Entry Logic
**Long R (Long Reversion):**
1. **Overextension**: Price breaks below lower Bollinger Band (2 consecutive closes)
2. **Snap Back**: Price crosses back above lower band (re-enters the range)
3. **Entry Window**: Within 2 candles of re-entry, look for:
- **Green candle** (close > open) confirming bullish strength
- Close above previous candle (close > close )
4. **Trigger**: First qualifying candle within 2-bar window executes the trade
**Short R (Short Reversion):**
1. **Overextension**: Price breaks above upper Bollinger Band (2 consecutive closes)
2. **Snap Back**: Price crosses back below upper band (re-enters the range)
3. **Entry Window**: Within 2 candles of re-entry, look for:
- **Red candle** (close < open) confirming bearish pressure
- Close below previous candle (close < close )
4. **Trigger**: First qualifying candle within 2-bar window executes the trade
### Risk Management
- **Stop Loss**: Lower of (previous high/low) OR (1.5 × ATR from entry)
- **Targets**: Same as Strategy 1 (0.85R, 1.4R, 2.5R, 4.5R based on 1.5 ATR)
- Betting on return to Bollinger Band basis (mean)
---
## Advanced Filtering System
### ADX Filter (Average Directional Index)
- **Purpose**: Measures trend strength vs choppy/ranging conditions
- **Trending**: ADX ≥ 25 → Enables Strategy 1 (Breakout)
- **Ranging**: ADX ≤ 20 → Enables Strategy 2 (Reversion)
- **Neutral**: ADX 20-25 → No signals (indecisive market)
### BB Width Filter
- **Purpose**: Confirms volatility expansion/contraction
- **Wide Bands**: Current width ≥ 1.0× 50-bar average → Trending environment
- **Narrow Bands**: Current width ≤ 0.8× 50-bar average → Ranging environment
- **Logic**: Both ADX and BB Width must agree on market state before signaling
### Combined Logic
- **Strategy 1 fires**: When BOTH ADX shows trending AND bands are wide
- **Strategy 2 fires**: When BOTH ADX shows ranging AND bands are narrow
- **Visual Display**: Table at bottom-right shows ADX value, BB Width ratio, and current market state
---
## Visual Elements
### Bollinger Bands
- **Gray line**: 20-period SMA (basis/mean)
- **Green line**: Upper band (basis + 2 standard deviations)
- **Red line**: Lower band (basis - 2 standard deviations)
### Strategy 1 Markers
- **Long B**: Green triangle below bar with "Long B" text
- **Short B**: Orange triangle above bar with "Short B" text
- **Defended Zones**: Green/red boxes showing pullback support/resistance areas
- **Targets**: Green/orange crosses showing T1-T4 and stop loss levels
### Strategy 2 Markers
- **Long R**: Blue label below bar with "Long R" text
- **Short R**: Purple label above bar with "Short R" text
- **Trade Levels**: Horizontal lines extending 50 bars forward
- Blue solid = Entry price
- Red dashed = Stop loss
- Green/Orange dotted = Targets (T1-T4)
### Market State Table
- **ADX**: Current value with color coding (green=trending, orange=ranging, gray=neutral)
- **BB Width**: Ratio vs 50-bar average (e.g., "1.15x" = 15% wider than average)
- **State**: TREND / RANGE / NEUTRAL classification
---
## Settings & Customization
### Bollinger Bands
- **BB Length**: 20 (default) - period for moving average
- **BB Std Dev**: 2.0 (default) - standard deviation multiplier
### ATR & Risk
- **ATR Length**: 14 (default) - period for Average True Range calculation
- All stop losses and targets are derived from 1.5 × ATR
### Trend/Range Filters
- **ADX Length**: 14 (default)
- **ADX Trending Threshold**: 25 (higher = stronger trend required)
- **ADX Ranging Threshold**: 20 (lower = tighter ranging condition)
- **BB Width Average Length**: 50 (period for comparing current width)
- **BB Width Trend Multiplier**: 1.0 (width must be ≥ this × average)
- **BB Width Range Multiplier**: 0.8 (width must be ≤ this × average)
- **Use ADX Filter**: Toggle on/off
- **Use BB Width Filter**: Toggle on/off
### Strategy 1 (Breakout-Momentum)
- **Breakout Lookback**: 15 bars (how far back to search for initial breakout)
- **Min Pullback Bars**: 1 (minimum consolidation period)
- **Max Pullback Bars**: 12 (maximum consolidation period)
- **Show Defended Zone**: Display support/resistance boxes
- **Show Signals**: Display Long B / Short B markers
- **Show Targets**: Display stop loss and target levels
### Strategy 2 (Reversion)
- **Show Signals**: Display Long R / Short R markers
- **Show Trade Levels**: Display entry, stop, and target lines
---
## How to Use This Indicator
### Step 1: Identify Market State
- Check the table in bottom-right corner
- **TREND**: Look for Strategy 1 signals (Long B / Short B)
- **RANGE**: Look for Strategy 2 signals (Long R / Short R)
- **NEUTRAL**: Wait for clearer conditions
### Step 2: Wait for Signal
- Signals only fire when ALL conditions are met (structural + momentum + filters + room-to-target)
- Signals are relatively rare but high-probability
### Step 3: Execute Trade
- **Entry**: Close of signal candle
- **Stop Loss**: Shown as red cross (Strategy 1) or red dashed line (Strategy 2)
- **Targets**: Scale out at T1, T2, T3, T4 or hold for maximum R:R
### Step 4: Management
- Consider moving stop to breakeven after T1
- Trail stop using swing lows/highs in Strategy 1
- Exit full position at T2-T3 in Strategy 2 (mean reversion has limited upside)
---
## Key Principles
### Why This Works
1. **Market Adaptation**: Uses right strategy for right conditions (trend vs range)
2. **Confluence**: Multiple confirmations required (structure + momentum + volatility + room)
3. **Risk-Defined**: Every trade has pre-calculated stop and targets based on ATR
4. **Probability**: Filters reduce noise and increase win rate by waiting for ideal setups
### Common Pitfalls to Avoid
- ❌ Taking signals in NEUTRAL market state (indicators disagree)
- ❌ Overriding the stop loss (it's calculated for a reason)
- ❌ Expecting signals on every swing (quality over quantity)
- ❌ Using Strategy 1 in ranging markets or Strategy 2 in trending markets
- ❌ Ignoring the room-to-target check (signal won't fire if targets are blocked)
### Complementary Analysis
This indicator works best when combined with:
- Higher timeframe trend analysis
- Key support/resistance levels
- Volume analysis
- Market structure (swing highs/lows)
- Risk management rules (position sizing, max daily loss, etc.)
---
## Technical Details
### Indicators Used
- **Bollinger Bands**: 20-period SMA ± 2 standard deviations
- **ATR**: 14-period Average True Range for volatility measurement
- **ADX**: 14-period Average Directional Index for trend strength
- **EMA**: 10 and 20-period exponential moving averages (Strategy 1 filter)
- **MACD**: 12/26/9 settings (Strategy 1 momentum confirmation)
- **Volume**: Compared to 15-bar average (Strategy 1 confirmation)
### Calculation Methodology
- **ATRL** (Structural Risk): Previous swing high/low or defended zone boundary
- **ATRX** (ATR Risk): 1.5 × 14-period ATR from entry price
- **Stop Loss**: Minimum of ATRL and ATRX (tightest protection)
- **Targets**: Always calculated from ATRX (consistent R-multiples)
- **BB Width Ratio**: Current BB width ÷ 50-period SMA of BB width
---
## Performance Notes
### Strengths
- Adapts to changing market conditions automatically
- Clear, objective entry and exit criteria
- Pre-defined risk on every trade
- Filters reduce false signals significantly
- Works across multiple timeframes and instruments
### Limitations
- Signals are infrequent (by design - quality over quantity)
- Requires patience to wait for all conditions to align
- May miss explosive moves if pullback doesn't form properly (Strategy 1)
- Ranging markets can transition to trending (Strategy 2 risk)
- Filters may delay entry in fast-moving markets
### Best Timeframes
- **Strategy 1**: 1H, 4H, Daily (needs time for proper pullback structure)
- **Strategy 2**: 15M, 30M, 1H (mean reversion works best intraday)
- Both strategies can work on any timeframe if market conditions are right
### Best Instruments
- **Liquid markets**: Major stocks, indices, forex pairs, liquid crypto
- **Sufficient volatility**: ATR should be meaningful relative to price
- **Clear trend/range cycles**: Markets that respect technical levels
---
## IMPORTANT DISCLAIMER
### Risk Warning
**TRADING INVOLVES SUBSTANTIAL RISK OF LOSS AND IS NOT SUITABLE FOR ALL INVESTORS.**
This indicator is provided for **educational and informational purposes only**. It does not constitute financial advice, investment advice, trading advice, or any other sort of advice. You should not treat any of the indicator's content as such.
### No Guarantee of Profit
Past performance is not indicative of future results. No trading strategy, including this indicator, can guarantee profits or protect against losses. The market is inherently unpredictable and all trading involves risk.
### User Responsibility
- **Do Your Own Research**: Always conduct your own analysis before making trading decisions
- **Test First**: Backtest and paper trade this strategy before risking real capital
- **Risk Management**: Never risk more than you can afford to lose
- **Position Sizing**: Use appropriate position sizes relative to your account
- **Stop Losses**: Always use stop losses and respect them
- **Market Conditions**: Understand that market conditions change and past behavior may not repeat
### No Liability
The creator of this indicator accepts no liability for any financial losses incurred through the use of this tool. All trading decisions are made at your own risk. You are solely responsible for evaluating the merits and risks associated with the use of any trading systems, signals, or content provided.
### Not Financial Advice
This indicator does not take into account your personal financial situation, investment objectives, risk tolerance, or specific needs. You should consult with a licensed financial advisor before making any investment decisions.
### Technical Limitations
- Indicators can repaint or lag in real-time
- Past signals may look different than real-time signals
- Code bugs or errors may exist despite testing
- TradingView platform limitations may affect functionality
### Market Risks
- Markets can gap, causing stops to be executed at worse prices
- Slippage and commissions can significantly impact results
- High volatility can cause unexpected losses
- Counterparty risk exists in all leveraged products
---
## Version History
- **v1.0**: Initial release combining breakout-momentum and mean reversion strategies
- Includes ADX and BB Width filtering
- ATRL/ATRX risk calculation system
- 2-candle entry window for reversion trades
---
## Credits & License
This indicator combines concepts from classical technical analysis including Bollinger Bands (John Bollinger), ATR (Welles Wilder), and ADX (Welles Wilder). The specific implementation and combination of filters is original work.
**Use at your own risk. Trade responsibly.**
---
*For questions, suggestions, or to report bugs, please comment below or contact the author.*
**Remember: The best indicator is the one between your ears. Use this tool as part of a comprehensive trading plan, not as a standalone solution.**

Robrechtian Long-Medium Breakout Trend SystemRobrechtian Long–Medium-Term Breakout Trend System
A professional, rule-based trend-following strategy designed to capture large, sustained price movements using pure price action and breakouts.
This system follows long-established trend-following philosophy: no prediction, no volatility targeting, and no profit targets. Only disciplined entries, position additions, and exits driven entirely by trend structure.
Core Principles
Breakout-driven entries: Initial positions are taken only when price breaks above/below the 80-day Donchian channel, confirming a long–medium-term trend shift.
Short-term confirmation: Breakouts must also exceed the 20-day channel, reducing false positives.
Trend-direction filter: A 50-day moving average slope filter ensures alignment with the broader trend.
Explosive bar filter: Entries avoid excessively large, single-candle expansions (>2.5× ATR(20)) to prevent chasing exhaustion spikes.
Pyramiding into strength: Additional units are added only when price makes fresh 20-day breakouts in the direction of the trend. No scaling out. No adding on dips.
Exit only on trend violation: Positions are closed exclusively when price breaks the opposite 80-day channel. This preserves unlimited upside while enforcing disciplined exits.
Pure trend philosophy: No volatility targeting, no smoothing, no discretionary overrides, no optimization for short-term performance.
Intended Use
This system is designed primarily for diversified futures portfolios, where diversification across dozens of globally liquid markets creates robustness and stability. However, it may also be used on individual assets for educational and analytical purposes.
The system embraces the core trend-following logic:
Small losses, big winners, and unlimited upside when trends persist.
⚠️ WARNINGS / DISCLAIMERS
⚠️ Warning 1 — This strategy is not optimized for single stocks
The Robrechtian Trend System is designed for multi-asset futures portfolios, not single equities.
Performance on individual tickers may vary greatly due to lack of diversification.
⚠️ Warning 2 — Trend following includes substantial drawdowns
Deep drawdowns are a normal and expected feature of all long-term trend-following systems.
The strategy does not attempt to smooth returns or manage volatility.
If you seek steady, low-volatility equity curves, this system is not suitable.
⚠️ Warning 3 — No volatility targeting or risk smoothing
This system intentionally avoids volatility-based position sizing.
Trades may experience larger fluctuations than systems using risk parity or vol targeting.
⚠️ Warning 4 — Not financial advice
This script is for educational and research purposes only.
Past performance does not guarantee future results.
Use at your own risk.
⚠️ Warning 5 — TradingView backtests have known limitations
TradingView does not simulate:
futures contract roll logic
slippage
real bid/ask spreads
liquidity conditions
limit-up/limit-down behavior
Results may vary from live market execution.

Trend Breakout & Ratchet Stop System [Market Filter]Description:
This strategy implements a robust trend-following system designed to capture momentum moves while strictly managing downside risk through a multi-stage "Ratchet" exit mechanism and broad market filters.
It is designed for swing traders who want to align individual stock entries with the overall market direction.
How it works:
1. Market Regime Filters (The "Safety Check") Before taking any position, the strategy checks the health of the broader market to avoid "catching falling knives."
Broad Market Filter: By default, it checks NASDAQ:QQQ (adjustable). If the benchmark is trading below its SMA 200, the strategy assumes a Bear Market and suppresses all new long entries.
Volatility Filter (VIX): Uses CBOE:VIX to gauge fear. If the VIX is above a specific threshold (Default: 32), entries are paused, and existing positions can optionally be closed to preserve capital.
2. Entry Logic Entries are based on Momentum and Trend confirmation. A position is opened if filters are clear AND one of the following occurs:
Golden Cross: SMA 25 crosses over SMA 50.
SMA Breakouts: A "Three-Bar-Break" logic confirms a breakout above the SMA 50, 100, or 200 (price must establish itself above the moving average).
3. The "Ratchet" Exit System The exit logic evolves as the trade progresses, tightening risk like a ratchet:
Stage 0 (Initial Risk): Starts with a standard percentage Stop Loss from the entry price.
Stage 1 (Breakeven/Lock): Once the price rises by Profit Step 1 (e.g., +10%), the Stop Loss jumps to a tighter level and locks there. This secures the initial move.
Stage 2 (Trailing Mode): If the price continues to rise to Profit Step 2 (e.g., +15%), the Stop Loss converts into a dynamic Trailing Stop relative to the Highest High. This allows the trade to run as long as the trend persists.
Additional Exits:
Dead Cross: Closes position if SMA 25 crosses under SMA 50.
VIX Panic: Emergency exit if volatility spikes above the threshold.
Settings & Customization:
SMAs: Adjustable lengths for all Moving Averages.
Filters: Toggle Market/VIX filters on/off and choose your benchmark ticker (e.g., SPY or QQQ).
Risk Management: Fully customizable percentages for the Ratchet steps (Initial SL, Stage 1 Trigger, Trailing distance).

Support & Resistance Zone Hunter [BOSWaves]Support & Resistance Zone Hunter - Dynamic Structural Zones with Real-Time Breakout Intelligence
Overview
The Support & Resistance Zone Hunter is a professional-grade structural mapping framework designed to automatically detect high-probability support and resistance areas in real time. Unlike traditional static levels or manually drawn zones, this system leverages pivot detection, range thresholds, and optional volume validation to create dynamic zones that reflect the true structural architecture of the market.
Zones evolve as price interacts with their boundaries. The first touch of a zone determines its bias - bullish, bearish, or neutral - and the system tracks the full lifecycle of each zone from formation, testing, and bias establishment to potential breakout events. Diamond-shaped breakout signals highlight structurally significant price expansions while filtering noise using a configurable cooldown period.
By visualizing market structure in this way, traders gain a deeper understanding of price behavior, trend momentum, and areas where liquidity and reactive forces are concentrated.
Theoretical Foundation
The Support & Resistance Zone Hunter is built on the premise that meaningful structural zones arise from two core principles:
Pivot-Based Turning Points : Only significant highs and lows that represent actual swings in price are considered.
Contextual Validation : Zones must pass minimum range criteria and optional volume thresholds to ensure their relevance.
Markets naturally generate numerous micro-pivots that do not carry predictive significance. By filtering out minor swings and validating zones against volume and range, the system isolates levels that are more likely to attract future price interaction or act as catalysts for breakout moves.
This framework captures not only where price is likely to react but also the direction of potential pressure, providing a statistically grounded, visually intuitive representation of market structure.
How It Works
The Support & Resistance Zone Hunter constructs zones through a multi-layered process that blends pivot logic, range validation, and real-time bias determination:
1. Pivot Detection Core
The indicator identifies pivot highs and pivot lows using a configurable lookback period. Zones are only considered valid when both a top and bottom pivot are present.
2. Zone Qualification Engine
Prospective zones must satisfy two conditions:
Range Threshold : The distance between pivot high and low must exceed the minimum percentage set by the user.
Volume Requirement : If enabled, the current volume must exceed the 50-period moving average.
Only zones meeting these criteria are drawn, reducing noise and emphasizing high-probability structural levels.
3. Zone Lifecycle
Once a valid top and bottom pivot exist:
The zone is created starting from the pivot formation bar.
Zones remain active until both boundaries have been touched by price.
The first boundary touched establishes bias: resistance first → bullish bias ,support first → bearish bias, neither → neutral.
Inactive zones stop expanding but remain visible historically to maintain a clear structural context.
4. Visual Rendering
Active zones are displayed as filled boxes with color corresponding to their bias. Top, bottom, and midpoint lines are drawn for reference. Once a zone becomes inactive, its lines are removed while the filled box remains as a historical footprint.
5. Breakout Detection
Breakout signals occur when price closes above the top boundary or below the bottom boundary of an active zone. The system applies a cooldown period and requires price to return to the zone since the previous breakout to prevent signal spam. Bullish and bearish breakouts are visually represented by diamond-shaped markers with configurable colors.
Interpretation
The Support & Resistance Zone Hunter provides a structural view of market balance:
Bullish Zones : Form when resistance is tested first, indicating upward pressure and potential continuation.
Bearish Zones : Form when support is tested first, reflecting downward pressure and continuation risk.
Neutral Zones : Fresh zones that have not yet been interacted with, representing undiscovered liquidity.
Breakout Diamonds : Highlight significant structural price expansions, helping traders identify confirmed continuation moves while filtering noise.
Zones do not simply indicate past levels; they dynamically reflect the evolving battle between buyers and sellers, providing actionable context for both trend continuation and reversion strategies.
Strategy Integration
The Support & Resistance Zone Hunter is versatile and can be applied across multiple trading approaches:
Trend Continuation : Use bullish and bearish zones to confirm directional bias. Breakout diamonds indicate structural continuation opportunities.
Reversion Entries : Neutral zones often act as magnets in ranging markets, allowing for high-probability mean-reversion setups.
Breakout Trading : Diamonds mark true structural expansions, reducing false breakout risk and guiding stop placement or momentum entries.
Liquidity Zone Alignment : Combining the indicator with order block, breaker, or volume-based tools helps validate zones against broader market participation.
Technical Implementation Details
Pivot Engine : Two-sided pivot detection based on configurable lookback.
Zone Qualification : Minimum range requirement and optional volume filter.
Bias Logic : Determined by the first boundary touched.
Zone Lifecycle : Active until both boundaries are touched, historical visibility retained.
Breakout Signals : Diamond markers with cooldown filtering and price-return validation.
Visuals : Transparent filled zones with live top, bottom, and midpoint lines.
Suggested Optimal Parameters
Pivot Lookback : 10 - 30 for intraday, 20 - 50 for swing trading.
Minimum Range % : 0.5 - 2% for crypto or indices, 1 - 3% for metals or forex.
Volume Filter : Enable for assets with inconsistent liquidity; disable for consistently liquid markets.
Breakout Cooldown : 5 - 20 bars depending on volatility.
These suggested parameters should be used as a baseline; their effectiveness depends on the asset and timeframe, so fine-tuning is expected for optimal performance.
Performance Characteristics
High Effectiveness:
Markets with clear pivot structure and reliable volume.
Trending symbols with consistent retests.
Assets where zones attract repeated price interaction.
Reduced Effectiveness:
Random walk markets lacking structural pivots.
Low-volatility periods with minimal price reaction.
Assets with irregular volume distribution or erratic price action.
Integration Guidelines
Use zone color as contextual bias rather than a standalone signal.
Combine with structural tools, order blocks, or volume-based indicators for confluence.
Validate zones on higher timeframes to refine lower timeframe entries.
Treat breakout diamonds as confirmation of continuation rather than independent triggers.
Disclaimer
The Support & Resistance Zone Hunter provides structural zone mapping and breakout analytics. It does not predict price movement or guarantee profitability. Success requires disciplined risk management, proper parameter calibration, and integration into a comprehensive trading strategy.

DEMA Flow [Alpha Extract]A sophisticated trend identification system that combines Double Exponential Moving Average methodology with advanced HL median filtering and ATR-based band detection for precise trend confirmation. Utilizing dual-layer smoothing architecture and volatility-adjusted breakout zones, this indicator delivers institutional-grade flow analysis with minimal lag while maintaining exceptional noise reduction. The system's intelligent band structure with asymmetric ATR multipliers provides clear trend state classification through price position analysis relative to dynamic threshold levels.
🔶 Advanced DEMA Calculation Engine
Implements double exponential moving average methodology using cascaded EMA calculations to significantly reduce lag compared to traditional moving averages. The system applies dual smoothing through sequential EMA processing, creating a responsive yet stable trend baseline that maintains sensitivity to genuine market structure changes while filtering short-term noise.
// Core DEMA Framework
dema(src, length) =>
EMA1 = ta.ema(src, length)
EMA2 = ta.ema(EMA1, length)
DEMA_Value = 2 * EMA1 - EMA2
DEMA_Value
// Primary Calculation
DEMA = dema(close, DEMA_Length)
2H
🔶 HL Median Filter Smoothing Architecture
Features sophisticated high-low median filtering using rolling window analysis to create ultra-smooth trend baselines with outlier resistance. The system constructs dynamic arrays of recent DEMA values, sorts them for median extraction, and handles both odd and even window lengths for optimal smoothing consistency across all market conditions.
// HL Median Filter Logic
hlMedian(src, length) =>
window = array.new_float()
for i = 0 to length - 1
array.push(window, src)
array.sort(window)
// Median Extraction
lenW = array.size(window)
median = lenW % 2 == 1 ?
array.get(window, lenW / 2) :
(array.get(window, lenW/2 - 1) + array.get(window, lenW/2)) / 2
// Smooth DEMA Calculation
Smooth_DEMA = hlMedian(DEMA_Value, HL_Filter_Length)
🔶 ATR Band Construction Framework
Implements volatility-adaptive band structure using Average True Range calculations with asymmetric multiplier configuration for optimal trend identification. The system creates upper and lower threshold bands around the smoothed DEMA baseline with configurable ATR multipliers, enabling precise trend state determination through price breakout analysis.
// ATR Band Calculation
atrBands(src, atr_length, upper_mult, lower_mult) =>
ATR = ta.atr(atr_length)
Upper_Band = src + upper_mult * ATR
Lower_Band = src - lower_mult * ATR
// Band Generation
= atrBands(Smooth_DEMA, ATR_Length, Upper_ATR_Mult, Lower_ATR_Mult)
15min
🔶 Intelligent Flow Signal Engine
Generates binary trend states through band breakout detection, transitioning to bullish flow when price exceeds upper band and bearish flow when price breaches lower band. The system maintains flow state persistence until opposing band breakout occurs, providing clear trend classification without whipsaw signals during normal volatility fluctuations.
🔶 Comprehensive Visual Architecture
Provides multi-dimensional flow visualization through color-coded DEMA line, trend-synchronized candle coloring, and bar color overlay for complete chart integration. The system uses institutional color scheme with neon green for bullish flow, neon red for bearish flow, and neutral gray for undefined states with configurable band visibility.
🔶 Asymmetric Band Configuration
Features intelligent asymmetric ATR multiplier system with default upper multiplier of 2.1 and lower multiplier of 1.5, optimizing for market dynamics where upside breakouts often require stronger momentum confirmation than downside breaks. This configuration reduces false signals while maintaining sensitivity to genuine flow changes.
🔶 Dual-Layer Smoothing Methodology
Combines DEMA's inherent lag reduction with HL median filtering to create exceptional smoothing without sacrificing responsiveness. The system first applies double exponential smoothing for initial noise reduction, then applies median filtering to eliminate outliers and create ultra-clean flow baseline suitable for high-frequency and institutional trading applications.
🔶 Alert Integration System
Features comprehensive alert framework for flow state transitions with customizable notifications for bullish and bearish flow confirmations. The system provides real-time alerts on crossover events with clear directional indicators and exchange/ticker integration for multi-symbol monitoring capabilities.
🔶 Performance Optimization Framework
Utilizes efficient array management with optimized median calculation algorithms and minimal variable overhead for smooth operation across all timeframes. The system includes intelligent bar indexing for median filter initialization and streamlined flow state tracking for consistent performance during extended analysis periods.
🔶 Why Choose DEMA Flow ?
This indicator delivers sophisticated flow identification through dual-layer smoothing architecture and volatility-adaptive band methodology. By combining DEMA's reduced-lag characteristics with HL median filtering and ATR-based breakout zones, it provides institutional-grade flow analysis with exceptional noise reduction and minimal false signals. The system's asymmetric band structure and comprehensive visual integration make it essential for traders seeking systematic trend-following approaches across cryptocurrency, forex, and equity markets with clear entry/exit signals and comprehensive alert capabilities for automated trading strategies.
