RSI Exit + BB-RSI Combo📊 RSI Exit + BB-RSI Combo Indicator
This indicator combines RSI overbought/oversold exit signals with Bollinger Band re-entry conditions to highlight potential reversal or retracement zones.
1️⃣ RSI Exit Signal
- When RSI drops below 70 after being overbought → 🔴 "RSI" label
- When RSI rises above 30 after being oversold → 🟢 "RSI" label
- Works on 15m / 30m / 1h / 4h / 1D timeframes
2️⃣ BB-RSI Combo Signal
- When an RSI divergence forms and
- The candle body re-enters the Bollinger Band on 1H+ timeframe
→ Combo signal (💎 diamond) is shown
💡 How to Use
- Use RSI exit signals to spot overextension corrections
- Use combo signals to identify high-probability reversal or rebound setups
- Suitable for both swing and short-term trading
Buscar en scripts para "bollingerband"

SFC Bollinger Band and Bandit概述 (Overview)
SFC 布林通道與海盜策略 (SFC Bollinger Band and Bandit Strategy) 是一個基於 Pine Script™ v6 的技術分析指標,結合布林通道 (Bollinger Bands)、移動平均線 (Moving Averages) 以及布林海盜 (Bollinger Bandit) 交易策略,旨在為交易者提供多時間框架的趨勢分析與進出場訊號。該腳本支援風險管理功能,並提供視覺化圖表與交易訊號提示,適用於多種金融市場。
This script, written in Pine Script™ v6, combines Bollinger Bands, Moving Averages, and the Bollinger Bandit strategy to provide traders with multi-timeframe trend analysis and entry/exit signals. It includes risk management features and visualizes data through charts and trading signals, suitable for various financial markets.
功能特點 (Key Features)
布林通道 (Bollinger Bands)
提供可調整的標準差參數 (σ1, σ2),支援多層布林通道顯示。
進場訊號基於價格穿越布林通道上下軌,並結合連續K線確認機制。
Provides adjustable standard deviation parameters (σ1, σ2) for multi-layer Bollinger Bands display.
Entry signals are based on price crossing the upper/lower bands, combined with a consecutive bar confirmation mechanism.
移動平均線 (Moving Averages)
支援簡單移動平均線 (SMA) 或指數移動平均線 (EMA),可自訂快、中、慢線週期。
Supports Simple Moving Average (SMA) or Exponential Moving Average (EMA) with customizable fast, medium, and slow line periods.
布林海盜策略 (Bollinger Bandit Strategy)
基於變動率 (ROC) 與布林通道動態止損,提供做多與做空訊號。
包含動態止損均線與平倉天數設定,增強交易靈活性。
Utilizes Rate of Change (ROC) and Bollinger Bands with dynamic stop-loss for long and short signals.
Includes dynamic stop-loss moving average and liquidation days for enhanced trading flexibility.
多時間框架分析 (Multi-Timeframe Analysis)
支援六個時間框架 (5分、15分、1小時、4小時、日線、週線) 的趨勢分析。
通過表格顯示各時間框架的連續上漲/下跌趨勢,輔助交易決策。
Supports trend analysis across six timeframes (5m, 15m, 1h, 4h, daily, weekly).
Displays consecutive up/down trends in a table to aid decision-making.
風險管理 (Risk Management)
提供基於 ATR 或布林通道的停利/停損設定。
自動計算交易手數,根據報價貨幣匯率調整風險敞口。
Offers take-profit/stop-loss settings based on ATR or Bollinger Bands.
Automatically calculates trading lots, adjusting risk exposure based on quote currency exchange rates.
視覺化與提示 (Visualization and Alerts)
繪製布林通道、移動平均線、海盜策略動態止損線及交易訊號。
提供多時間框架趨勢表格、交易手數標籤及浮水印。
支援交易訊號快訊,方便即時監控。
Plots Bollinger Bands, Moving Averages, Bandit strategy stop-loss lines, and trading signals.
Includes multi-timeframe trend tables, trading lot labels, and watermark.
Supports alert conditions for real-time trade monitoring.
使用說明 (Usage Instructions)
設置參數 (Parameter Setup)
布林通道 (Bollinger Bands): 可調整週期 (預設21)、標準差 (σ1=1, σ2=2) 及停利/停損依據 (ATR 或 BAND)。
移動平均線 (Moving Averages): 可選擇顯示快線 (10)、中線 (20)、慢線 (60),並切換 SMA/EMA。
布林海盜 (Bollinger Bandit): 調整通道週期 (50)、平倉均線週期 (50) 及 ROC 週期 (30)。
時間框架 (Timeframes): 自訂六個時間框架,預設為 5分、15分、1小時、4小時、日線、週線。
Adjust Bollinger Band period (default 21), standard deviations (σ1=1, σ2=2), and take-profit/stop-loss basis (ATR or BAND).
Configure Moving Averages (fast=10, medium=20, slow=60) and toggle SMA/EMA.
Set Bollinger Bandit parameters: channel period (50), liquidation MA period (50), ROC period (30).
Customize six timeframes (default: 5m, 15m, 1h, 4h, daily, weekly).
交易訊號 (Trading Signals)
買入訊號 (Buy): 價格穿越下軌且滿足連續K線條件。
賣出訊號 (Sell): 價格穿越上軌且滿足連續K線條件。
海盜策略訊號: 基於 ROC 與布林通道穿越,結合動態止損。
Buy signal: Price crosses below lower band with consecutive bar confirmation.
Sell signal: Price crosses above upper band with consecutive bar confirmation.
Bandit strategy signals: Based on ROC and band crossings with dynamic stop-loss.
視覺化 (Visualization)
布林通道以不同顏色顯示上下軌與中軌。
移動平均線以快、中、慢線區分顏色。
趨勢表格顯示各時間框架的趨勢狀態 (🔴上漲, 🟢下跌, ⚪中性)。
海盜策略顯示動態止損線與交易狀態。
Bollinger Bands display upper, lower, and middle bands in distinct colors.
Moving Averages use different colors for fast, medium, and slow lines.
Trend table shows timeframe trends (🔴 up, 🟢 down, ⚪ neutral).
Bandit strategy displays dynamic stop-loss and trading status.

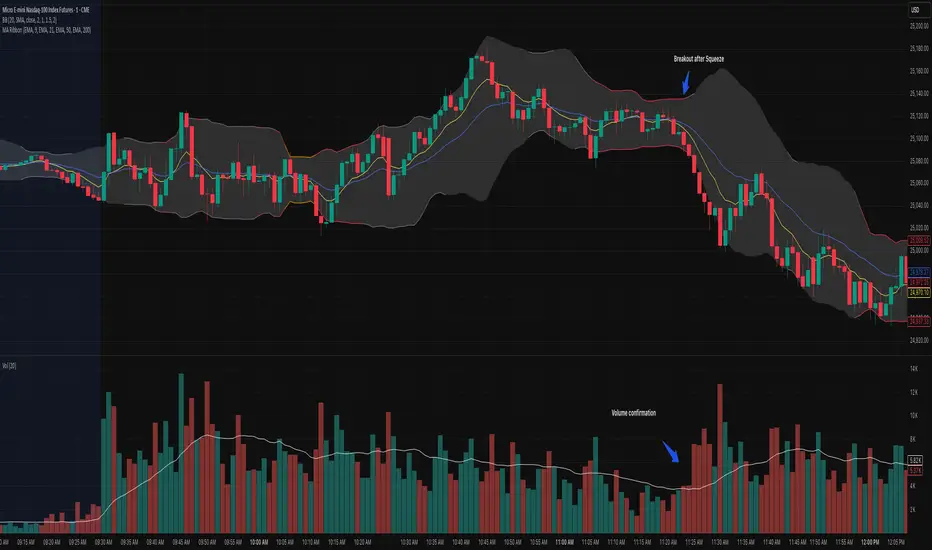
Bollinger Bands Squeeze📈 Bollinger Bands Squeeze
This indicator enhances traditional Bollinger Bands by integrating Keltner Channel layers to visualize market compression and volatility expansion — allowing traders to easily identify when a squeeze is building or releasing.
🔍 Overview
This is a refined version of the classic Bollinger Bands, designed to detect volatility squeezes using multiple Keltner Channel thresholds.
The script plots standard Bollinger Bands and dynamically colors the bands according to the degree of compression relative to the Keltner Channels.
⚙️ How It Works
Bollinger Bands are calculated from a selected moving average (SMA, EMA, SMMA, WMA, or VWMA) and standard deviation multiplier.
Keltner Channels are derived from ATR (True Range) using three sensitivity levels (1.0, 1.5, and 2.0× multipliers).
When Bollinger Bands contract inside a Keltner Channel, the script marks a squeeze state:
🟠 High Compression (Orange): Very tight volatility — expect breakout soon.
🔴 Mid Compression (Red): Moderate contraction — volatility is building.
⚫ Low Compression (Gray/Black): Early compression phase.
🧩 Inputs & Customization
Length : Period for both Bollinger and Keltner calculations.
Basis MA Type: Choose from SMA, EMA, SMMA (RMA), WMA, or VWMA.
StdDev Multiplier : Controls Bollinger Bandwidth.
Keltner Multipliers (1.0 / 1.5 / 2.0) : Adjust compression thresholds.
Offset : Shifts the bands visually on the chart.
🕹️ Best Use Cases
Identify pre-breakout conditions before volatility expansion.
Combine with volume, momentum, or trend indicators (e.g., RSI) for confirmation.
Ideal for scalping, breakout trading, or volatility-based entries during session opens.
RSI Bollinger Bands [DCAUT]█ RSI Bollinger Bands
📊 ORIGINALITY & INNOVATION
The RSI Bollinger Bands indicator represents a meaningful advancement in momentum analysis by combining two proven technical tools: the Relative Strength Index (RSI) and Bollinger Bands. This combination addresses a significant limitation in traditional RSI analysis - the use of fixed overbought/oversold thresholds (typically 70/30) that fail to adapt to changing market volatility conditions.
Core Innovation:
Rather than relying on static threshold levels, this indicator applies Bollinger Bands statistical analysis directly to RSI values, creating dynamic zones that automatically adjust based on recent momentum volatility. This approach helps reduce false signals during low volatility periods while remaining sensitive to genuine extremes during high volatility conditions.
Key Enhancements Over Traditional RSI:
Dynamic Thresholds: Overbought/oversold zones adapt to market conditions automatically, eliminating the need for manual threshold adjustments across different instruments and timeframes
Volatility Context: Band width provides immediate visual feedback about momentum volatility, helping traders distinguish between stable trends and erratic movements
Reduced False Signals: During ranging markets, narrower bands filter out minor RSI fluctuations that would trigger traditional fixed-threshold signals
Breakout Preparation: Band squeeze patterns (similar to price-based BB) signal potential momentum regime changes before they occur
Self-Referencing Analysis: By measuring RSI against its own statistical behavior rather than arbitrary levels, the indicator provides more relevant context
📐 MATHEMATICAL FOUNDATION
Two-Stage Calculation Process:
Stage 1: RSI Calculation
RSI = 100 - (100 / (1 + RS))
where RS = Average Gain / Average Loss over specified period
The RSI normalizes price momentum into a bounded 0-100 scale, making it ideal for statistical band analysis.
Stage 2: Bollinger Bands on RSI
Basis = MA(RSI, BB Length)
Upper Band = Basis + (StdDev(RSI, BB Length) × Multiplier)
Lower Band = Basis - (StdDev(RSI, BB Length) × Multiplier)
Band Width = Upper Band - Lower Band
The Bollinger Bands measure RSI's standard deviation from its own moving average, creating statistically-derived dynamic zones.
Statistical Interpretation:
Under normal distribution assumptions with default 2.0 multiplier, approximately 95% of RSI values should fall within the bands
Band touches represent statistically significant momentum extremes relative to recent behavior
Band width expansion indicates increasing momentum volatility (strengthening trend or increasing uncertainty)
Band width contraction signals momentum consolidation and potential regime change preparation
📊 COMPREHENSIVE SIGNAL ANALYSIS
Visual Color Signals:
This indicator features dynamic color fills that highlight extreme momentum conditions:
Green Fill (Above Upper Band):
Appears when RSI breaks above the upper band, indicating exceptionally strong bullish momentum
Represents dynamic overbought zone - not necessarily a reversal signal but a warning of extreme conditions
In strong uptrends, green fills can persist as RSI "rides the band" - this indicates sustained momentum strength
Exit of green zone (RSI falling back below upper band) often signals initial momentum weakening
Red Fill (Below Lower Band):
Appears when RSI breaks below the lower band, indicating exceptionally weak bearish momentum
Represents dynamic oversold zone - potential reversal or continuation signal depending on trend context
In strong downtrends, red fills can persist as RSI "rides the band" - this indicates sustained selling pressure
Exit of red zone (RSI rising back above lower band) often signals initial momentum recovery
Position-Based Signals:
Upper Band Interactions:
RSI Touching Upper Band: Dynamic overbought condition - momentum is extremely strong relative to recent volatility, potential exhaustion or continuation depending on trend context
RSI Riding Upper Band: Sustained strong momentum, often seen in powerful trends, not necessarily an immediate reversal signal but warrants monitoring for exhaustion
RSI Crossing Below Upper Band: Initial momentum weakening signal, particularly significant if accompanied by price divergence
Lower Band Interactions:
RSI Touching Lower Band: Dynamic oversold condition - momentum is extremely weak relative to recent volatility, potential reversal or continuation of downtrend
RSI Riding Lower Band: Sustained weak momentum, common in strong downtrends, monitor for potential exhaustion
RSI Crossing Above Lower Band: Initial momentum strengthening signal, early indication of potential reversal or consolidation
Basis Line Signals:
RSI Above Basis: Bullish momentum regime - upward pressure dominant
RSI Below Basis: Bearish momentum regime - downward pressure dominant
Basis Crossovers: Momentum regime shifts, more significant when accompanied by band width changes
RSI Oscillating Around Basis: Balanced momentum, often indicates ranging market conditions
Volatility-Based Signals:
Band Width Patterns:
Narrow Bands (Squeeze): Momentum volatility compression, often precedes significant directional moves, similar to price coiling patterns
Expanding Bands: Increasing momentum volatility, indicates trend acceleration or growing uncertainty
Narrowest Band in 100 Bars: Extreme compression alert, high probability of upcoming volatility expansion
Advanced Pattern Recognition:
Divergence Analysis:
Bullish Divergence: Price makes lower lows while RSI touches or stays above previous lower band touch, suggests downward momentum weakening
Bearish Divergence: Price makes higher highs while RSI touches or stays below previous upper band touch, suggests upward momentum weakening
Hidden Bullish: Price makes higher lows while RSI makes lower lows at the lower band, indicates strong underlying bullish momentum
Hidden Bearish: Price makes lower highs while RSI makes higher highs at the upper band, indicates strong underlying bearish momentum
Band Walk Patterns:
Upper Band Walk: RSI consistently touching or staying near upper band indicates exceptionally strong trend, wait for clear break below basis before considering reversal
Lower Band Walk: RSI consistently at lower band signals very weak momentum, requires break above basis for reversal confirmation
🎯 STRATEGIC APPLICATIONS
Strategy 1: Mean Reversion Trading
Setup Conditions:
Market Type: Ranging or choppy markets with no clear directional trend
Timeframe: Works best on lower timeframes (5m-1H) or during consolidation phases
Band Characteristic: Normal to narrow band width
Entry Rules:
Long Entry: RSI touches or crosses below lower band, wait for RSI to start rising back toward basis before entry
Short Entry: RSI touches or crosses above upper band, wait for RSI to start falling back toward basis before entry
Confirmation: Use price action confirmation (candlestick reversal patterns) at band touches
Exit Rules:
Target: RSI returns to basis line or opposite band
Stop Loss: Fixed percentage or below recent swing low/high
Time Stop: Exit if position not profitable within expected timeframe
Strategy 2: Trend Continuation Trading
Setup Conditions:
Market Type: Clear trending market with higher highs/lower lows
Timeframe: Medium to higher timeframes (1H-Daily)
Band Characteristic: Expanding or wide bands indicating strong momentum
Entry Rules:
Long Entry in Uptrend: Wait for RSI to pull back to basis line or slightly below, enter when RSI starts rising again
Short Entry in Downtrend: Wait for RSI to rally to basis line or slightly above, enter when RSI starts falling again
Avoid Counter-Trend: Do not fade RSI at bands during strong trends (band walk patterns)
Exit Rules:
Trailing Stop: Move stop to break-even when RSI reaches opposite band
Trend Break: Exit when RSI crosses basis against trend direction with conviction
Band Squeeze: Reduce position size when bands start narrowing significantly
Strategy 3: Breakout Preparation
Setup Conditions:
Market Type: Consolidating market after significant move or at key technical levels
Timeframe: Any timeframe, but longer timeframes provide more reliable breakouts
Band Characteristic: Narrowest band width in recent 100 bars (squeeze alert)
Preparation Phase:
Identify band squeeze condition (bands at multi-period narrowest point)
Monitor price action for consolidation patterns (triangles, rectangles, flags)
Prepare bracket orders for both directions
Wait for band expansion to begin
Entry Execution:
Breakout Confirmation: Enter in direction of RSI band breakout (RSI breaks above upper band or below lower band)
Price Confirmation: Ensure price also breaks corresponding technical level
Volume Confirmation: Look for volume expansion supporting the breakout
Risk Management:
Stop Loss: Place beyond consolidation pattern opposite extreme
Position Sizing: Use smaller size due to false breakout risk
Quick Exit: Exit immediately if RSI returns inside bands within 1-3 bars
Strategy 4: Multi-Timeframe Analysis
Timeframe Selection:
Higher Timeframe: Daily or 4H for trend context
Trading Timeframe: 1H or 15m for entry signals
Confirmation Timeframe: 5m or 1m for precise entry timing
Analysis Process:
Trend Identification: Check higher timeframe RSI position relative to bands, trade only in direction of higher timeframe momentum
Setup Formation: Wait for trading timeframe RSI to show pullback to basis in trending direction
Entry Timing: Use confirmation timeframe RSI band touch or crossover for precise entry
Alignment Confirmation: All timeframes should show RSI moving in same direction for highest probability setups
📋 DETAILED PARAMETER CONFIGURATION
RSI Source:
Close (Default): Standard price point, balances responsiveness and reliability
HL2: Reduces noise from intrabar volatility, provides smoother RSI values
HLC3 or OHLC4: Further smoothing for very choppy markets, slower to respond but more stable
Volume-Weighted: Consider using VWAP or volume-weighted prices for additional liquidity context
RSI Length Parameter:
Shorter Periods (5-10): More responsive but generates more signals, suitable for scalping or very active trading, higher noise level
Standard (14): Default and most widely used setting, proven balance between responsiveness and reliability, recommended starting point
Longer Periods (21-30): Smoother momentum measurement, fewer but potentially more reliable signals, better for swing trading or position trading
Optimization Note: Test across different market regimes, optimal length often varies by instrument volatility characteristics
RSI MA Type Parameter:
RMA (Default): Wilder's original smoothing method, provides traditional RSI behavior with balanced lag, most widely recognized and tested, recommended for standard technical analysis
EMA: Exponential smoothing gives more weight to recent values, faster response to momentum changes, suitable for active trading and trending markets, reduces lag compared to RMA
SMA: Simple average treats all periods equally, smoothest output with highest lag, best for filtering noise in choppy markets, useful for long-term position analysis
WMA: Weighted average emphasizes recent data less aggressively than EMA, middle ground between SMA and EMA characteristics, balanced responsiveness for swing trading
Advanced Options: Full access to 25+ moving average types including HMA (reduced lag), DEMA/TEMA (enhanced responsiveness), KAMA/FRAMA (adaptive behavior), T3 (smoothness), Kalman Filter (optimal estimation)
Selection Guide: RMA for traditional analysis and backtesting consistency, EMA for faster signals in trending markets, SMA for stability in ranging markets, adaptive types (KAMA/FRAMA) for varying volatility regimes
BB Length Parameter:
Short Length (10-15): Tighter bands that react quickly to RSI changes, more frequent band touches, suitable for active trading styles
Standard (20): Balanced approach providing meaningful statistical context without excessive lag
Long Length (30-50): Smoother bands that filter minor RSI fluctuations, captures only significant momentum extremes, fewer but higher quality signals
Relationship to RSI Length: Consider BB Length greater than RSI Length for cleaner signals
BB MA Type Parameter:
SMA (Default): Standard Bollinger Bands calculation using simple moving average for basis line, treats all periods equally, widely recognized and tested approach
EMA: Exponential smoothing for basis line gives more weight to recent RSI values, creates more responsive bands that adapt faster to momentum changes, suitable for trending markets
RMA: Wilder's smoothing provides consistent behavior aligned with traditional RSI when using RMA for both RSI and BB calculations
WMA: Weighted average for basis line balances recent emphasis with historical context, middle ground between SMA and EMA responsiveness
Advanced Options: Full access to 25+ moving average types for basis calculation, including HMA (reduced lag), DEMA/TEMA (enhanced responsiveness), KAMA/FRAMA (adaptive to volatility changes)
Selection Guide: SMA for standard Bollinger Bands behavior and backtesting consistency, EMA for faster band adaptation in dynamic markets, matching RSI MA type creates unified smoothing behavior
BB Multiplier Parameter:
Conservative (1.5-1.8): Tighter bands resulting in more frequent touches, useful in low volatility environments, higher signal frequency but potentially more false signals
Standard (2.0): Default setting representing approximately 95% confidence interval under normal distribution, widely accepted statistical threshold
Aggressive (2.5-3.0): Wider bands capturing only extreme momentum conditions, fewer but potentially more significant signals, reduces false signals in high volatility
Adaptive Approach: Consider adjusting multiplier based on instrument characteristics, lower multiplier for stable instruments, higher for volatile instruments
Parameter Optimization Workflow:
Start with default parameters (RSI:14, BB:20, Mult:2.0)
Test across representative sample period including different market regimes
Adjust RSI length based on desired responsiveness vs stability tradeoff
Tune BB length to match your typical holding period
Modify multiplier to achieve desired signal frequency
Validate on out-of-sample data to avoid overfitting
Document optimal parameters for different instruments and timeframes
Reference Levels Display:
Enabled (Default): Shows traditional 30/50/70 levels for comparison with dynamic bands, helps visualize the adaptive advantage
Disabled: Cleaner chart focusing purely on dynamic zones, reduces visual clutter for experienced users
Educational Value: Keeping reference levels visible helps understand how dynamic bands differ from fixed thresholds across varying market conditions
📈 PERFORMANCE ANALYSIS & COMPETITIVE ADVANTAGES
Comparison with Traditional RSI:
Fixed Threshold RSI Limitations:
In ranging low-volatility markets: RSI rarely reaches 70/30, missing tradable extremes
In trending high-volatility markets: RSI frequently breaks through 70/30, generating excessive false reversal signals
Across different instruments: Same thresholds applied to volatile crypto and stable forex pairs produce inconsistent results
Threshold Adjustment Problem: Manually changing thresholds for different conditions is subjective and lagging
RSI Bollinger Bands Advantages:
Automatic Adaptation: Bands adjust to current volatility regime without manual intervention
Consistent Logic: Same statistical approach works across different instruments and timeframes
Reduced False Signals: Band width filtering helps distinguish meaningful extremes from noise
Additional Information: Band width provides volatility context missing in standard RSI
Objective Extremes: Statistical basis (standard deviations) provides objective extreme definition
Comparison with Price-Based Bollinger Bands:
Price BB Characteristics:
Measures absolute price volatility
Affected by large price gaps and outliers
Band position relative to price not normalized
Difficult to compare across different price scales
RSI BB Advantages:
Normalized Scale: RSI's 0-100 bounds make band interpretation consistent across all instruments
Momentum Focus: Directly measures momentum extremes rather than price extremes
Reduced Gap Impact: RSI calculation smooths price gaps impact on band calculations
Comparable Analysis: Same RSI BB appearance across stocks, forex, crypto enables consistent strategy application
Performance Characteristics:
Signal Quality:
Higher Signal-to-Noise Ratio: Dynamic bands help filter RSI oscillations that don't represent meaningful extremes
Context-Aware Alerts: Band width provides volatility context helping traders adjust position sizing and stop placement
Reduced Whipsaws: During consolidations, narrower bands prevent premature signals from minor RSI movements
Responsiveness:
Adaptive Lag: Band calculation introduces some lag, but this lag is adaptive to current conditions rather than fixed
Faster Than Manual Adjustment: Automatic band adjustment is faster than trader's ability to manually modify thresholds
Balanced Approach: Combines RSI's inherent momentum lag with BB's statistical smoothing for stable yet responsive signals
Versatility:
Multi-Strategy Application: Supports both mean reversion (ranging markets) and trend continuation (trending markets) approaches
Universal Instrument Coverage: Works effectively across equities, forex, commodities, cryptocurrencies without parameter changes
Timeframe Agnostic: Same interpretation applies from 1-minute charts to monthly charts
Limitations and Considerations:
Known Limitations:
Dual Lag Effect: Combines RSI's momentum lag with BB's statistical lag, making it less suitable for very short-term scalping
Requires Volatility History: Needs sufficient bars for BB calculation, less effective immediately after major regime changes
Statistical Assumptions: Assumes RSI values are somewhat normally distributed, extreme trending conditions may violate this
Not a Standalone System: Like all indicators, should be combined with price action analysis and risk management
Optimal Use Cases:
Best for swing trading and position trading timeframes
Most effective in markets with alternating volatility regimes
Ideal for traders who use multiple instruments and timeframes
Suitable for systematic trading approaches requiring consistent logic
Suboptimal Conditions:
Very low timeframes (< 5 minutes) where lag becomes problematic
Instruments with extreme volatility spikes (gap-prone markets)
Markets in strong persistent trends where mean reversion rarely occurs
Periods immediately following major structural changes (new trading regime)
USAGE NOTES
This indicator is designed for technical analysis and educational purposes to help traders understand the interaction between momentum measurement and statistical volatility bands. The RSI Bollinger Bands has limitations and should not be used as the sole basis for trading decisions.
Important Considerations:
No Predictive Guarantee: Past band touches and patterns do not guarantee future price behavior
Market Regime Dependency: Indicator performance varies significantly between trending and ranging market conditions
Complementary Analysis Required: Should be used alongside price action, support/resistance levels, and fundamental analysis
Risk Management Essential: Always use proper position sizing, stop losses, and risk controls regardless of signal quality
Parameter Sensitivity: Different instruments and timeframes may require parameter optimization for optimal results
Continuous Monitoring: Band characteristics change with market conditions, requiring ongoing assessment
Recommended Supporting Analysis:
Price structure analysis (support/resistance, trend lines)
Volume confirmation for breakout signals
Multiple timeframe alignment
Market context awareness (news events, session times)
Correlation analysis with related instruments
The indicator aims to provide adaptive momentum analysis that adjusts to changing market volatility, but traders must apply sound judgment, proper risk management, and comprehensive market analysis in their decision-making process.

Multiple Symbol Trend Screener [Pineify]Multiple Symbol Trend Screener Pineify – Ultimate Multi-Indicator Scanner for TradingView
Empower your trading with deep market insights across multiple symbols using this feature-rich Pine Script screener. The Multiple Symbol Trend Screener Pineify enables traders to monitor and compare trends, reversals, and consolidations in real-time across the biggest equity symbols on TradingView, through a synergistic blend of popular technical indicators.
Key Features
Monitor up to 15 symbols and their trends simultaneously
Integrates 7 professional-grade indicators: MA Distance, Aroon, Parabolic SAR (PSAR), ADX, Supertrend, Keltner Channel, and BBTrend
Color-coded table display for instant visual assessment
Customizable lookback periods, indicator types, and calculation methods
SEO optimized for multi-symbol trend detection, screener, and advanced TradingView indicator
How It Works
This indicator leverages TradingView’s Pine Script v6 and request.security() to process multiple symbols across selected timeframes. Data populates a dynamic table, updating each cell based on the calculated value of every underlying indicator. MA Distance highlights deviation from moving averages; Aroon flags emerging trend strength; PSAR marks potential trend reversals; ADX assesses trend momentum; Supertrend detects bullish/bearish phases; Keltner Channel and BBTrend offer volatility and power insights.
Set up your preferred symbols and timeframes
Each indicator runs its calculation per symbol using its parameter group
All results are displayed in a table for a comprehensive dashboard view
Trading Ideas and Insights
Traders can use this screener for cross-market comparison, directional bias, entry/exit filtering, and comprehensive trend evaluation. The screener is excellent for swing trading, day trading, and portfolio tracking. It enables confirmation across multiple frameworks — for example, spotting momentum with ADX before confirming direction with Supertrend and PSAR.
Identify correlated movements or divergences across selected assets
Spot synchronized trend changes for basket trading ideas
Filter symbols by volatility, strength, or trend status for precise trade selection
How Multiple Indicators Work Together
The screener’s edge lies in its intelligent correlation of popular indicators. MA Distance measures the proximity to chosen moving averages, ideal for spotting overbought/oversold conditions. Aroon reveals the strength of new price trends, PSAR indicates reversal signals, and ADX quantifies the momentum of these trends. Supertrend provides a directional phase, while Keltner Channel & BBTrend analyze volatility shifts and band compressions. This amalgamation allows for a robust, multi-dimensional market snapshot, capturing details missed by single-indicator tools.
By displaying all key metrics side-by-side, the screener enables holistic decision-making, revealing confluence zones and contradiction areas across multiple tickers and timeframes.
Unique Aspects
Original implementation combining seven independent trend and momentum indicators for each symbol
Rich customization for symbols, timeframes, and all indicator parameters
Intuitive color-coding for quick reading of bullish/bearish/neutral signals
Comprehensive dashboard for instant actionable insights
How to Use
Load the indicator onto your TradingView chart
Go to the script’s settings and input your preferred symbols and relevant timeframes
Set your desired parameters for each indicator group: Moving Average type, Aroon length, PSAR values, ADX smoothing, etc.
Observe the results in the top-right table, then use it to filter candidates and validate trade setups
The screener is suitable for all timeframes and asset classes available on TradingView. Make sure your chart’s timeframe matches the one used in the scanner for optimal accuracy.
Customization
Choose up to 15 symbols to monitor in a single dashboard
Customize lookback periods, indicator types, colors, and display settings
Configure alerting options and thresholds for advanced trade automation
Conclusion
The Multiple Symbol Trend Screener Pineify sets a new standard for multi-asset screening on TradingView. By elegantly merging seven proven technical indicators, the screener delivers powerful trend detection, reversal analysis, and volatility monitoring — all in one dashboard. Take your trading to new heights with in-depth, customizable market surveillance.

TTM Squeeze Range Lines (with Forward Extension) By Gautam KumarThis TTM Squeeze Range Lines script helps visualize breakout levels by marking the recent squeeze’s high and low, making it easier to identify potential trade setups. Each signal line is extended for visibility, showing possible entry levels after a squeeze.
Interpreting the LinesLight blue background marks periods when the TTM squeeze is active (tight volatility).
Green line is drawn at the highest price during the squeeze, extended forward—this is commonly used as the breakout level for long entries.
Red line shows the lowest price during the squeeze, indicating the bottom of the range—potential stop loss positioning or an invalidation level.
When the squeeze background disappears, the horizontal lines will have just appeared and extended forward for several bars after the squeeze ends.
If the price breaks above the green line (the squeeze high), it signals a possible momentum breakout, which traders often use as a long entry.
The red line can be used for placing stop losses or monitoring failed breakouts if price falls below this level.
Best Practices
Combine these levels with volume and momentum confirmation for strong entries.
Adjust the extension length (number of bars forward) from the settings menu to fit your preference.
For systematic trading, use these breakout signals alongside chart pattern or histogram confirmation.
This makes it easy to visualize strong entry zones based on the end of squeeze compression, supporting both discretionary and automated swing trading approaches

BBKC Combined Channels OverlayBBKC Combined Channels Overlay (Volatility & Mean Reversion)This indicator provides a clean, single-view envelope combining the Bollinger Bands (BB) and Keltner Channels (KC) directly onto your price chart. It is an essential tool for traders operating with Volatility Compression (The Squeeze) and Mean Reversion strategies in fast-moving markets like Futures, High BTC Beta Equities, and Crypto. The goal of this tool is twofold: to visually frame the market's current volatility state and to identify high-probability entry points based on expansion or extreme contraction. How to Use the BBKC Overlay: Spotting the Squeeze (Accumulation Phase):The Squeeze is identified when the Bollinger Bands (BB) contract and fit inside the Keltner Channels (KC).The area is clearly marked with a subtle Orange Background Highlight on the main chart. This is the Accumulation phase, signaling low volatility before a potential large directional move. Trading Mean Reversion: When price pushes aggressively outside the outermost bands (the BB Upper/Lower), it signals an extreme volatility expansion and over-extension. This is a strong setup for mean reversion—a high-probability trade targeting a snap-back towards the central Basis Line (SMA).Customizing for Extreme Compression: For traders looking only for the tightest, highest-probability Squeezes, adjust the following setting: KC Multiplier (ATR): Lower this value from the default of 1.5 down to 1.25 or 1.0. This narrows the KC, forcing the Bollinger Bands to contract even further to trigger the Squeeze signal, thus filtering for only the most minimal volatility. Recommended Synergy: For a complete volatility system, pair this BBKC Combined Channels Overlay (your visualization tool) with the BBKC Squeeze Indicator (the sub-pane momentum histogram).Overlay (Main Chart): Shows where the Squeeze is occurring and identifies mean reversion targets. Squeeze Indicator (Lower Pane): Shows if the Squeeze is active and the directional momentum building up, helping you time the breakout entry for the Manipulation/Distribution phase.

Bollinger Keltner Squeeze Indicator (BBKC)Bollinger Keltner Squeeze Indicator (BBKC)This single-pane indicator combines the power of Bollinger Bands (BB) and Keltner Channels (KC) to accurately identify periods of low volatility compression—the famous Squeeze—which often precedes large, directional moves.Designed for traders utilizing Accumulation, Manipulation, Distribution (AMD) strategies, this tool makes spotting the 'Accumulation' phase simple and visually clear, perfect for high BTC Beta equities or futures markets like MES and MNQ.Key Features:Clear Squeeze Visualization:The background of the main chart is shaded Orange when the Squeeze is active (BB is inside KC). This immediately highlights periods of extreme compression.A simple Red/Green Dot below the chart confirms the Squeeze state (Red = Squeeze ON, Green = Squeeze OFF).Momentum Histogram:A built-in momentum oscillator smooths price action and guides the anticipated direction of the breakout.Teal/Orange Bars: Indicate momentum direction while the Squeeze is active (building pressure).Bright Green/Red Bars: Indicate momentum direction after the Squeeze has broken (expansion/breakout).How to Find Maximum Volatility Compression (The "Tightest" Squeeze)To align this indicator with a strategy focused on catching only the most extreme volatility compression—the key to those explosive moves—traders should adjust the Keltner Channel Multiplier setting.Setting Name: KC Multiplier (ATR)Default Value: 1.5Recommended Adjustment: To filter for only the absolute tightest squeezes (where price is least volatile), decrease this multiplier value, typically down to 1.25 or even 1.0.By lowering the KC Multiplier (ATR), you narrow the Keltner Channel boundaries. This requires the Bollinger Bands to compress even further to fit inside, ensuring the indicator only signals the Squeeze state during moments of truly minimal volatility, setting you up for maximum opportunity.

10MAs + BB10 MAs riboon + Bollinger Bands
I used two basic Multiple MA ribbons. so I just merge them to one indicaotor

BB Crosses Optimized - [JTCAPITAL]BB Crosses Optimized - is a modified way to use Bollinger Bands combined with volatility filtering (ATR) and flexible smoothing methods for Trend-Following.
The indicator works by calculating in the following steps:
Source Selection & Smoothing
The script begins by letting the user select a preferred price source (default is Close, but options include Open, High, Low, HL2, etc.). This raw input is then passed through a smoothing process.
Multiple smoothing techniques can be chosen: SMA, EMA, HMA, DEMA, TEMA, RMA, and FRAMA. Each method reduces short-term noise differently, ensuring flexibility for traders who prefer faster or slower reaction speeds in trend detection.
Bollinger Band Construction
Once the smoothed source is prepared, Bollinger Bands are calculated. The middle band is a moving average of the smoothed data over the defined BB Period . The upper and lower bands are then generated by adding and subtracting the Standard Deviation × Deviation multiplier . These dynamic bands capture volatility and help define breakout zones.
ATR Volatility Measurement
Parallel to the band calculation, the Average True Range (ATR) is computed over the chosen ATR Period . This measures market volatility. The ATR can optionally act as a filter, refining buy and sell levels so signals adapt to current market conditions rather than being fixed to price alone.
Bollinger Band Signals
-If the smoothed price closes above the upper band, a potential bullish event is marked.
-If the smoothed price closes below the lower band, a potential bearish event is marked.
Trend Line Construction
When a bullish event occurs, the script anchors a trend-following line beneath price. If ATR filtering is enabled, the line is set at Low – ATR , otherwise at the simple Low. Conversely, when a bearish event occurs, the line is anchored above price at High + ATR (or just High without the filter). The line is designed to only move in the direction of the trend—if price action does not exceed the prior value, the previous level is held. This prevents unnecessary whipsaws and keeps the indicator aligned with dominant momentum.
Final Trend Detection
The slope of the trend line defines the trend itself:
-Rising line → bullish trend.
-Falling line → bearish trend.
Visual Output
The indicator plots the trend line with dynamic coloring: Blue for bullish phases, Purple for bearish phases. A subtle filled background area emphasizes the active trend zone for clearer chart interpretation.
Buy and Sell Conditions:
- Buy Signal : Triggered when smoothed price closes above the upper Bollinger Band. Trend line then anchors below price (with or without ATR offset depending on settings).
- Sell Signal : Triggered when smoothed price closes below the lower Bollinger Band. Trend line then anchors above price (with or without ATR offset).
Additional filtering is possible via:
- ATR Toggle : Switch ATR on or off to adapt the strategy to either volatile or steady markets.
- Smoothing Method : Adjust smoothing to speed up or slow down responsiveness.
- Deviation Multiplier : Tight or wide bands adjust the sensitivity of signals.
Features and Parameters:
- Source : Choose between Close, Open, High, Low, HL2, etc.
- Average Type : Options include SMA, EMA, HMA, DEMA, TEMA, RMA, FRAMA.
- ATR Period : Defines how ATR volatility is measured.
- BB Period : Lookback length for Bollinger Band construction.
- Deviation : Multiplier for the standard deviation in Bollinger Bands.
- Smoothing Period : Controls how much the source data is smoothed.
- ATR Filter On/Off : Enables or disables ATR integration in signal calculation.
Specifications:
Smoothing (MA Types)
Smoothing is essential to reduce chart noise. By offering multiple MA choices, traders can balance between lag (SMA, RMA) and responsiveness (EMA, HMA, FRAMA). This flexibility allows the indicator to adapt across asset classes and trading styles.
Bollinger Bands
Bollinger Bands measure price deviation around a moving average. They help identify volatility expansion and contraction. In this script, the bands serve as breakout triggers—price crossing outside suggests momentum strong enough to sustain a trend.
Standard Deviation
Standard Deviation is a statistical measure that quantifies the dispersion of price data around the mean. With a multiplier applied, it creates bands that contain a probabilistic portion of price action. Crossing beyond these suggests a higher likelihood of trend continuation.
ATR (Average True Range)
ATR measures the degree of volatility. Instead of simply reacting to price crossing the bands, ATR ensures the trend line placement adapts to current conditions. In volatile markets, wider buffers prevent premature signals; in calmer markets, tighter placement keeps signals responsive.
Trend Line Logic
The trend line only adjusts in the direction of the trend. If new values do not exceed the prior, the line remains unchanged. This prevents false reversals and makes the line a reliable visual confirmation of trend direction.
Signal Detection
The indicator does not repaint: signals are based on confirmed closes relative to the Bollinger Bands. This makes it more reliable for both live trading and backtesting scenarios.
Visual Enhancements
The use of dual plots and fill shading creates a clearer separation of bullish vs. bearish phases. This helps traders visually align entries and exits without second-guessing.
Enjoy!

FlowSpike ES — BB • RSI • VWAP + AVWAP + News MuteThis indicator is purpose-built for E-mini S&P 500 (ES) futures traders, combining volatility bands, momentum filters, and session-anchored levels into a streamlined tool for intraday execution.
Key Features:
• ES-Tuned Presets
Automatically optimized settings for scalping (1–2m), daytrading (5m), and swing trading (15–60m) timeframes.
• Bollinger Band & RSI Signals
Entry signals trigger only at statistically significant extremes, with RSI filters to reduce false moves.
• VWAP & Anchored VWAPs
Session VWAP plus anchored VWAPs (RTH open, weekly, monthly, and custom) provide high-confidence reference levels used by professional order-flow traders.
• Volatility Filter (ATR in ticks)
Ensures signals are only shown when the ES is moving enough to offer tradable edges.
• News-Time Mute
Suppresses signals around scheduled economic releases (customizable windows in ET), helping traders avoid whipsaw conditions.
• Clean Alerts
Long/short alerts are generated only when all conditions align, with optional bar-close confirmation.
Why It’s Tailored for ES Futures:
• Designed around ES tick size (0.25) and volatility structure.
• Session settings respect RTH hours (09:30–16:00 ET), the period where most liquidity and institutional flows concentrate.
• ATR thresholds and RSI bands are pre-tuned for ES market behavior, reducing the need for manual optimization.
⸻
This is not a generic indicator—it’s a futures-focused tool created to align with the way ES trades day after day. Whether you scalp the open, manage intraday swings, or align to weekly/monthly anchored flows, FlowSpike ES gives you a clear, rules-based signal framework.

RSI/Stochastic with overlays a moving average + Bollinger BandsCompact oscillator panel that lets you switch the base between RSI and Stochastic %K, then overlays a moving average + Bollinger Bands on the oscillator values (not on price) to read momentum strength and squeeze/expansion.
What’s added
Selectable base: RSI ↔ Stochastic %K (plots %D when Stoch is chosen).
MA + BB on oscillator to gauge momentum trend (MA) and volatility (bands).
Adjustable bands 70/50/30 with optional fill, plus optional regular divergence and alerts.
How to read
Bull bias: %K above osc-MA and pushing/closing near Upper BB; confirm with %K > %D.
Bear bias: %K below osc-MA and near Lower BB; confirm with %K < %D.
Squeeze: BB on oscillator tightens → expect momentum breakout.
Overextension: repeated touches of Upper/Lower BB in 70/30 zones → strong trend; watch for %K–%D recross.
Quick settings (start here)
Stoch: 14 / 3 / 3; Bands: 70/50/30.
Osc-MA: EMA 14.
BB on oscillator: StdDev 2.0 (tune 1.5–2.5).
Note
Analysis tool, not financial advice. Backtest across timeframes and use risk management.

Outside the Bollinger Bands Alerting Indicator Overview
The Outside the Bollinger Bands Alerting Indicator is a comprehensive technical analysis tool that combines multiple proven
indicators into a single, powerful system designed to identify high-probability reversal patterns at Bollinger Band extremes. This
indicator goes beyond simple band touches to detect sophisticated pattern formations that often signal strong directional moves.
Key Features & Capabilities
🎯 Advanced Pattern Recognition
Bollinger Band Breakout Patterns
- Detects "pierce-and-reject" formations where price breaks through a Bollinger Band but immediately reverses back inside
- Identifies failed breakouts that often lead to strong moves in the opposite direction
- Combines multiple confirmation signals: engulfing candle patterns, MACD momentum, and ATR volatility filters
- Visual alerts with symbols positioned below (bullish) or above (bearish) candles
Tweezer Top & Bottom Patterns
- Identifies consecutive candles with nearly identical highs (tweezer tops) or lows (tweezer bottoms)
- Requires at least one candle to breach the respective Bollinger Band
- Confirms reversal with directional close requirements
- Customizable tolerance settings for pattern sensitivity
- Visual alerts with ❙❙ symbols for easy identification
📊 Multi-Indicator Integration
Bollinger Bands Indicator
- Dual-band configuration with outer (2.0 std dev) and inner (1.5 std dev) bands that can be adjusted to suit your own parameters
- Configurable MA types: SMA, EMA, SMMA (RMA), WMA, VWMA
- Customizable length, source, and offset parameters
- Color-coded band fills for visual clarity
Moving Average Suite
- EMA 9, 21, 50, and 200 (individually toggleable)
- Special "SMA 3 High" for help visualizing and detecting Bollinger Band break-outs
- Dynamic color coding based on price relationship
Optional Ichimoku Cloud overlay
- Complete Ichimoku implementation with customizable periods
- Dynamic cloud coloring based on trend direction
- Toggleable overlay that doesn't interfere with other indicators
🚨 Comprehensive Alert System
Real-Time JSON Alerts
- Sends structured data on every confirmed bar close
- Includes all indicator values: BB levels, EMAs, MACD, RSI
- Contains signal states and crossover conditions
- Perfect for automated trading systems and webhooks
{"timestamp":1753118700000,"symbol":"ETHUSD","timeframe":"5","price":3773.3,"bollinger_bands":{"upper":3826.95,"basis":3788.32,"lower":3749.68},"emas":{"ema_9":3780.45,"ema_21":3788.92,"ema_50":3800.79,"ema_200":3787.74,"sma_3_high":3789.45},"macd":{"macd":-10.1932,"signal":-11.3266,"histogram":1.1334},"rsi":{"rsi":40.5,"rsi_ma":39.32,"level":"neutral"}}
Specific Alert Conditions
- MACD histogram state changes (rising to falling, falling to rising)
- RSI overbought/oversold crossovers
- All pattern detections (BB Bounce, Tweezer patterns)
- Bollinger Band breakout alerts
🎨 Visual Elements
Pattern Identification
- ♻ symbols for Bollinger Band breakout patterns (green for bullish, red for bearish)
- ❙❙ symbols for tweezer patterns (green below for bottoms, red above for tops)
- Color-coded band fills for trend visualization
Chart Overlay Options
- All moving averages with distinct colors
- Bollinger Bands with inner and outer boundaries
- Optional Ichimoku cloud with trend-based coloring
Trading Applications
Reversal Trading
- Identify high-probability reversal points at extreme price levels
- Use failed breakout patterns for entry signals
- Combine multiple timeframes for enhanced accuracy
Trend Analysis
- Monitor moving average relationships for trend direction
- Use Ichimoku cloud for trend strength assessment
- Track momentum with MACD and RSI integration
Risk Management
- ATR-based volatility filtering reduces false signals
- Multiple confirmation requirements improve signal quality
- Real-time alerts enable prompt decision making
Suggested Use
- Use on multiple timeframes for confluence
- Combine with support/resistance levels for enhanced accuracy
- Set up alerts for hands-free monitoring
- Customize settings based on market volatility and trading style
- Consider volume confirmation for stronger signals

VIX CCI Oscillator [Compression + EMA Trigger + Bounce Glow]VIX CCI OSCILLATOR
ADJ CHART FOR YOUR LIKING
NOT AS SMOOTH AS PREVIOUS VERSION (STOCH)
SHOWS TIGER SIGNAL ON EMA
SAMEOUTPUT
HUD Box: emoji-coded tactical feedback
bounce 100 "💥 Expansion" :
bounce 0.8 "🔴 Overbought" :
bounce 0.618 "📉 Distribution" :
bounce 0.5 "🧠 Midline" :
bounce 0.382 "📈 Accumulation" :
bounce 0.2 "🟢 Oversold" :
bounce0.0 "💣 Expansion" : "⚪ Neutral"
Tiger EMA/STOCH
This logic checks if the oscillator is trending above or below its 48-period EMA,
If above, it paints the line GREEN🟢 (bullish),
If below, it paints it RED🔴 (bearish),
If compression is active, it overrides both with purple🟣 to highlight tactical squeeze conditions,
⚠️WARNING⚠️
ALWAYS REMEMBER THIS CHART IS VIX/USD
IN MOST CASES SPY MOVES VICE VERSA
I AM NOT RESPOSIBLE FOR YOUR OWN ACTIONS/TRADE IDEAS

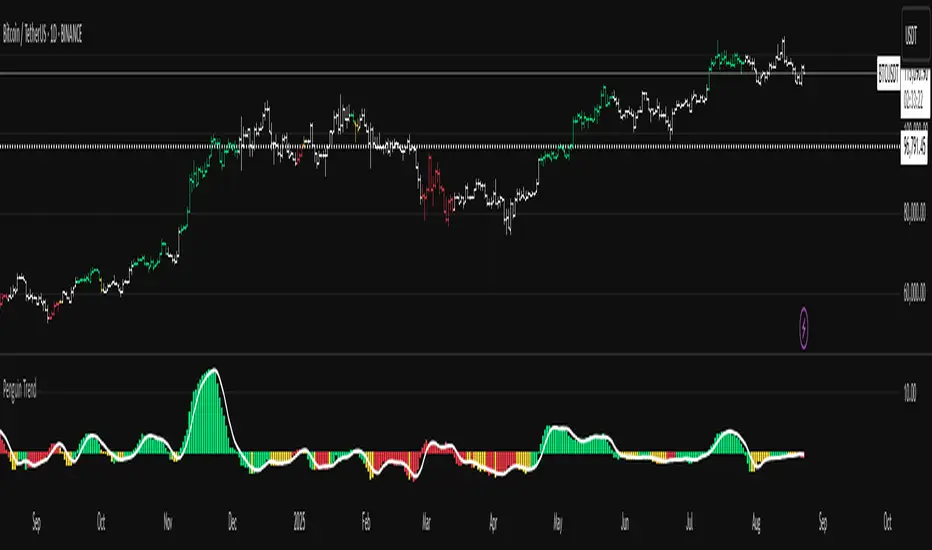
Penguin Volatility State StrategyThe Penguin Volatility State Strategy is a comprehensive technical analysis framework designed to identify the underlying "state" or "regime" of the market. Instead of just providing simple buy or sell signals, its primary goal is to classify the market into one of four distinct states by combining trend, momentum, and volatility analysis.
The core idea is to trade only when these three elements align, focusing on periods of volatility expansion (a "squeeze breakout") that occur in the direction of a confirmed trend and are supported by strong momentum.
Key Components
The strategy is built upon two main engines
The Volatility Engine (Bollinger Bands vs. Keltner Channels)
This engine detects periods of rapidly increasing volatility. It measures the percentage difference (diff) between the upper bands of Bollinger Bands (which are based on standard deviation) and Keltner Channels (based on Average True Range). During a volatility "squeeze," both bands are close. When price breaks out, the Bollinger Band expands much faster than the Keltner Channel, causing the diff value to become positive. A positive diff signals a volatility breakout, which is the moment the strategy becomes active.
The Trend & Momentum Engine (Multi-EMA System)
This engine determines the market's direction and strength. It uses:
A Fast EMA (e.g., 12-period) and a Slow EMA (e.g., 26-period): The crossover of these two moving averages defines the primary, underlying trend (similar to a MACD).
An Ultra-Fast EMA (e.g., 2-period of ohlc4): This is used to measure the immediate, short-term momentum of the price.
The Four Market States
By combining the Trend and Momentum engines, the strategy categorizes the market into four visually distinct states, represented by the chart's background color. This is the most crucial aspect of the system.
💚 Green State: Strong Bullish
The primary trend is UP (Fast EMA > Slow EMA) AND the immediate momentum is STRONG (Price > Fast EMA).
Interpretation: This represents a healthy, robust uptrend where both the underlying trend and short-term price action are aligned. It is considered the safest condition for taking long positions.
❤️ Red State: Strong Bearish
Condition: The primary trend is DOWN (Fast EMA < Slow EMA) AND the immediate momentum is WEAK (Price < Fast EMA).
Interpretation: This represents a strong, confirmed downtrend. It is considered the safest condition for taking short positions.
💛 Yellow State: Weakening Bullish / Pullback
Condition: The primary trend is UP (Fast EMA > Slow EMA) BUT the immediate momentum is WEAK (Price < Fast EMA).
Interpretation: This is a critical warning signal for bulls. While the larger trend is still up, the short-term price action is showing weakness. This could be a minor pullback, a period of consolidation, or the very beginning of a trend reversal. Caution is advised.
💙 Blue State: Weakening Bearish / Relief Rally
Condition: The primary trend is DOWN (Fast EMA < Slow EMA) BUT the immediate momentum is STRONG (Price > Fast EMA).
Interpretation: This signals that a downtrend is losing steam. It often represents a short-covering rally (a "bear market rally") or the first potential sign of a market bottom. Bears should be cautious and consider taking profits.
How the Strategy Functions
The strategy uses these four states as its foundation for making trading decisions. The entry and exit arrows (Long, Short, Close) are generated based on a set of rules that can be customized by the user. For instance, a trader can configure the strategy to
Only take long trades during the Green State.
Require a confirmed volatility breakout (diff > 0) before entering a trade.
Use the "RSI on Diff" indicator to ensure that the breakout is supported by accelerating momentum.
Summary
In essence, the Penguin Volatility State Strategy provides a powerful "dashboard" for viewing the market. It moves beyond simple indicators to offer a contextual understanding of price action. By waiting for the alignment of Trend (the State), Volatility (the Breakout), and Momentum (the Acceleration), it helps traders to identify higher-probability setups and, just as importantly, to know when it is better to stay out of the market.
License / disclaimer
© waranyu.trkm — MIT License. Educational use only; not financial advice.

EMA Envelope + SMA + Purple DotThis indicator combines three tools into one:
📈 EMA Envelope with wedge and range contraction signals to highlight volatility squeezes.
🔵 SMA with optional smoothing (SMA/EMA/WMA/SMMA/VWMA) and optional Bollinger Bands.
🟣 Purple Dot “PowerBars” that mark strong momentum bars when price ROC (%) and volume exceed user-defined thresholds.
It also includes:
Background highlighting of contraction zones (bullish/bearish/neutral colors).
A summary table showing PowerBar count and return (%) over custom lookback periods.
Flexible display settings (table position, dark/light theme, highlight toggle).
Designed for traders who want to track momentum bursts, volatility contraction, and trend strength all in one tool.

Crypto Breakout Buy/Sell Sequence
⚙️ Components & Sequence Multiple Timeframe (What It Does)
1. Bollinger Bands – Form the foundation by measuring volatility and creating the dynamic range where squeezes and breakouts occur.
2. Squeeze Dots – Show when price compresses inside the bands, signaling reduced volatility before expansion.
3. Breakout Event (Brk Dot) – Fires when price expands beyond the squeeze zone, confirming volatility expansion. (This paints Intra, before candle close)
4. Buy Signal – Confirms entry after a breakout is validated. (This paints at candle close)
5. Pump Signal – Flags sudden surges that extend sharply from the bands, often linked to strong inflows.
6. Momentum Stream – Tracks the strength of movement following the breakout, from continuation (🟢) to slowing (🟡) to exhaustion (🔴). (Resets at Pump Signal)
7. Overbought Indicator – Confirms when momentum has reached overheated conditions, often aligning with band extremes.
8. Sell Signal – Prints when exhaustion/reversal conditions are met, closing the trade cycle.
The Crypto Breakout Buy/Sell Sequence is a no-repaint event indicator that maps a full trade cycle using Bollinger-band-based volatility states: Bollinger Bands → Squeeze → Breakout → Buy → Pump → Momentum → Top Test → Overbought → Sell. Each stage is rule-based and designed to be read on standard candlesticks.
How It Works (System Logic)
Volatility framework: Bollinger Bands define dynamic range and compression/expansion.
Initiation: Squeeze → Breakout confirms expansion; Buy validates participation after expansion begins.
Management: Pump highlights unusual acceleration; Momentum stream tracks continuation → slowing → exhaustion.
Exhaustion/Exit: Top Testing + Overbought build the exhaustion case; Sell marks the sequence end.
How To Use (Quick Guide)
Wait for Squeeze → Breakout → Buy to establish a structured start.
Manage with Momentum:
🟢 continuation, 🟡 slowing, 🔴 exhaustion pressure.
Monitor extremes: Top Testing and/or Overbought = tighten risk.
Exit on Sell or on your risk rules when exhaustion builds.
Limitations & Good Practice
Signals reflect price/volatility behavior, not certainty.
Strong trends can remain extended; Overbought/Top Test ≠ instant reversal.
Always confirm with your own risk rules, position sizing, and market context.
Initial public release: integrated Squeeze/Breakout/Buy → Momentum → Exhaustion → Sell cycle; improved label clarity; cleaned defaults.
Disclaimer
For educational purposes only. Not financial advice. Past performance does not guarantee future results. Test before live use.
Thank You

Penguin TrendMeasures the volatility regime by comparing the upper Bollinger Band to the upper Keltner Channel and colors bars with a lightweight trend state. Supports SMA/EMA/WMA/RMA/HMA/VWMA/VWAP and a selectable calculation timeframe. Default settings preserve the original look and behavior.
Penguin Trend visualizes expansion vs. compression in price action by comparing two classic volatility envelopes. It computes:
Diff% = (UpperBB − UpperKC) / UpperKC × 100
* Diff > 0: Bollinger Bands are wider than Keltner Channels -> expansion / momentum regime.
* Diff < 0: BB narrower than KC -> compression / squeeze regime.
A white “Average Difference” line smooths Diff% (default: SMA(5)) to help spot regime shifts.
Trend coloring (kept from original):
Bars are colored only when Diff > 0 to emphasize expansion phases. A lightweight trend engine defines four states using a fast/slow MA bias and a short “thrust” MA applied to ohlc4:
* Green: Bullish bias and thrust > fast MA (healthy upside thrust).
* Red: Bearish bias and thrust < fast MA (healthy downside thrust).
* Yellow: Bullish bias but thrust ≤ fast MA (pullback/weakness).
* Blue: Bearish bias but thrust ≥ fast MA (bear rally/short squeeze).
Note: By default, Blue renders as Yellow to preserve the original visual style. Enable “Use true BLUE color” if you prefer Aqua for Blue.
How it works (under the hood):
* Bollinger Bands (BB): Basis = selected MA of src (default SMA(20)). Width = StdDev × Mult (default 2.0).
* Keltner Channels (KC): Basis = selected MA of src (default SMA(20)). Width = ATR(kcATR) × Mult (defaults 20 and 2.0).
* Diff%: Safe division guards against division-by-zero.
* MA engine: You can choose SMA / EMA / WMA / RMA / HMA / VWMA / VWAP for BB/KC bases, Diff smoothing, and the trend components (VWAP is session-anchored).
* Calculation timeframe: Set “Calculation timeframe” to compute all internals on a chosen TF via request.security() while viewing any chart TF.
Inputs (key ones):
* Calculation timeframe: Empty = use chart TF; if set (e.g., 60), all internals compute on that TF.
* BB: Length, StdDev Mult, MA Type.
* KC: Basis Length, ATR Length, Multiplier, MA Type.
* Smoothing: Average Length & MA Type for the “Average Difference” line.
* Trend Engine: Fast/Slow lengths & MA type; Signal (kept for completeness); Thrust length & MA type (defaults replicate original behavior).
* Display: Paint bars only when Diff > 0; optional Zero line; optional true Blue color.
How to use:
1. Regime changes: Watch Diff% or Average Diff crossing 0. Above zero favors momentum/continuation setups; below zero suggests compression and potential breakout conditions.
2. State confirmation: Use bar colors to qualify expansion: Green/Red indicate expansion aligned with trend thrust; Yellow/Blue flag weaker/contrarian thrust during expansion.
3. Multi-timeframe analysis: Run calculations on a higher TF (e.g., H1/H4) while trading a lower TF chart to smooth noise.
Alerts:
* Diff crosses above/below 0.
* Average Diff crosses above/below 0.
* State changes: GREEN / RED / YELLOW / BLUE.
Notes & limitations:
* VWAP is session-anchored and best on intraday data. If not applicable on the selected calculation TF, the script automatically falls back to EMA.
* Default parameters (SMA(20) for BB/KC, multipliers 2.0, SMA(5) smoothing, trend logic and bar painting) preserve the original appearance.
Release notes:
v6.0 — Rewritten in Pine v6 with structured inputs and guards. Multi-MA support (SMA/EMA/WMA/RMA/HMA/VWMA/VWAP). Calculation timeframe via request.security() for multi-TF workflows. Safe division; optional zero line; optional true Blue color. Original visuals and behavior preserved by default.
License / disclaimer:
© waranyu.trkm — MIT License. Educational use only; not financial advice.
All-in-One EMA & BBThis script combines Bollinger Bands and multiple EMAs into one powerful tool. It includes:
1) Bollinger Bands with customizable MA type and colors.
2) EMA 21 on Daily and Weekly timeframes.
3) EMA 21, 50, 100, 200 on current chart timeframe.
4) Toggle options for each indicator for a clean, flexible view.
Ideal for traders seeking multi-timeframe trend analysis and volatility insights.

Multi-Length Quad Bollinger BandsHere is a Pine Script code for TradingView that plots four separate Bollinger Bands on your chart. The lengths are preset to 14, 50, 100, and 200, but every aspect—including lengths, standard deviations, colors, and the source price—is fully customizable through the script's settings menu.
The 14 and 50-period bands are enabled by default, while the 100 and 200-period bands are disabled to keep the chart clean initially. You can easily toggle any of them on or off.

逆勢布林+RSI策略 for SOL可以直接套用到 SOLUSDT, SOLPERP, 或其他 SOL 合約。
在策略回測介面中選擇 5min 或 15min 看策略表現。
若要調整停利%或 RSI 數值,改變 rsi < 25 與 (shortEntryPrice - close) / shortEntryPrice >= 0.035 即可。
This can be directly applied to SOLUSDT, SOLPERP, or other SOL futures.
In the strategy backtesting interface, select 5-minute or 15-minute periods to view strategy performance.
To adjust the take-profit percentage or RSI value, set RSI < 25 and (shortEntryPrice - close) / shortEntryPrice >= 0.035.

RSI+BOLLINGER (LONG & SHORT)This indicator combines two of the most popular tools in technical analysis, the Relative Strength Index (RSI) and Bollinger Bands (BB), to generate both long (BUY) and short (SELL) trading signals.
Strategy:
Entries (Buy/Short): Entry signals are based on the RSI.
A BUY is suggested when the RSI crosses above an oversold level (default: 29), indicating a possible upward reversal.
A SHORT is suggested when the RSI crosses below an overbought level (default: 71), indicating a possible downward reversal.
Exits (Position Closure): Exit signals are based on Bollinger Bands.
A long position is closed when the price crosses below the upper Bollinger Band.
A short position is closed when the price crosses above the lower Bollinger Band.
Key Features:
Cascade Filter: Includes a smart filter that prevents opening new consecutive trades if the price hasn't moved significantly in favor of a new entry, optimizing signal quality.
Automation Alerts: Generates detailed alerts in JSON format for each event (buy, sell, close), designed for easy integration with trading bots and automated systems via webhooks.
Fully Configurable: All parameters of the RSI, Bollinger Bands, and strategy filters can be adjusted from the indicator’s settings menu.

BB with Heikin Ashi + Reversal CheckThis indicator combines Bollinger Bands (BB) with Heikin Ashi candles to detect potential reversal points after price breaks the BB boundaries. It works on any symbol and timeframe, retrieving Heikin Ashi data via request.security().
Core Features
Heikin Ashi Candle Plot
Smooths price action by using Heikin Ashi candles instead of regular candles.
Candles are plotted directly on the chart with green (bullish) and red (bearish) colors.
Bollinger Bands (BB)
Calculated from Heikin Ashi close price.
Includes Basis (MA), Upper Band, and Lower Band, with customizable MA type, length, and standard deviation multiplier.
Break & Reversal Detection
The indicator tracks whether the price has broken above the Upper Band (p1) or below the Lower Band (p2).
It remembers the last breakout direction until the opposite breakout occurs (mutually exclusive logic).
Signal Logic
Long Signal (▲):
Price was previously below the Lower Band and then reversed upward (BB Lower rising + Heikin Ashi candle rising).
Short Signal (▼):
Price was previously above the Upper Band and then reversed downward (BB Upper falling + Heikin Ashi candle falling).
Alerts
Custom alert conditions trigger when Long or Short signals occur, allowing automated notifications or bot integration.
Use Cases
✅ Swing Trading / Trend Reversal – Identify potential bottom/top reversals after BB breakouts.
✅ Mean Reversion Strategies – Enter trades when the price reverts to the BB mean after an extreme breakout.
✅ Multi-Timeframe Analysis – Works with any timeframe and symbol via request.security().
Customization
MA Type: SMA, EMA, RMA, WMA, VWMA
BB Length & StdDev Multiplier
Timeframe & Symbol Selection
