Bollinger Band Alert with RSI Filter IndicatorThis code is for a technical analysis indicator called Bollinger Band Alert with RSI Filter. It uses two tools: Bollinger Bands and Relative Strength Index (RSI) to identify potential trading signals in the market.
Bollinger Bands are lines plotted two standard deviations away from a simple moving average of the price of a stock or asset. They help traders determine whether prices are high or low on a relative basis.
The RSI is a momentum indicator that measures the strength of recent price changes to evaluate whether an asset is overbought or oversold.
The code has some input parameters that a user can change, such as length and multiplier, which are used to calculate the Bollinger Bands, and upper and lower RSI levels to define the overbought and oversold zones.
The code then uses if statements to generate alerts if certain conditions are met. The alert condition is triggered if the close price of an asset crosses above or below the upper or lower Bollinger Bands, and if the RSI is either above or below the overbought or oversold threshold levels.
Finally, the code generates plots to visualize the Bollinger Bands and displays triangles above or below the bars indicating when to enter a long or short position based on the strategy's criteria.
Buscar en scripts para "bollingerband"

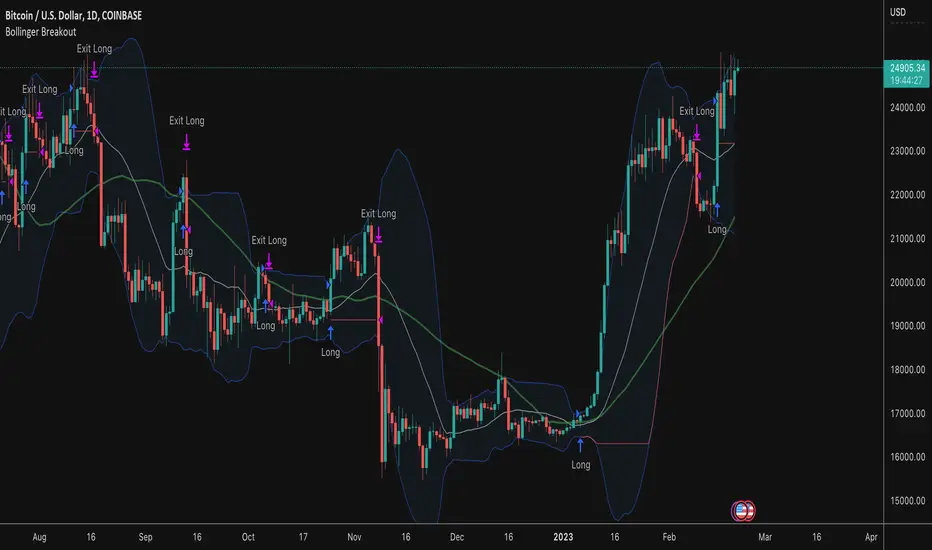
Bollinger Band BreakoutThis strategy buys when price crosses above an upper Bollinger Band and sells when the lower band is breached. What makes this strategy different than others:
Long only with filtering for only showing strong tickers
Filter out trades below a moving average on both the current timeframe and a longer period timeframe to keep you out of bear markets
Optional ability to set a tighter initial stop level to increase exposure and decrease downside risk on freshly opened trades while you wait for the lower Bollinger Band trailing stop to catch up
Take entries/exits on wicks/stops or wait for candle closes before entry
Select which dates to backtest
Customize Bollinger Band parameters including the ability to have different values for the upper and lower band standard deviation
Dual Bollinger Band Mean ReversionSimple but solid mean reversion indicator with sl and tp levels. Most of the code is based on the built in bollinger bands script. Designed for scalping 1-5 minute timeframes.
The indicator consists of two sets of bollinger bands.
Price has to close below the lower (fast) bollinger band, above the moving average of the (slower) bollinger band.
If price now closes above the lower (fast) bb, the indicator draws a label at the open of the next candle (which would be a potential entry point). Take profit becomes the upper bollinger band, stop loss the same distance below the open of the candle.
I've built in a simple backtesting function that calculates the potential win/loss-ratio. Loss and profit levels are 1:1. Exit strategy could be improved on.
Adjusting the lengths depending on the asset proves to be a good idea.
The slower bollinger bands can help to identify ranging markets and/or trends following regular bollinger bands theory.
Feel free to comment with any changes that you'd like to be made.

Bollinger Band strategy with split, limit, stopEntering a short position after breaking the upper Bollinger Band, entering a long position when entering after breaking the lower Bollinger Band
Provides templates for how to display position average price, stop loss, and profit price using the plot function on the chart, and how to buy splits
After entering the position, if the price crosses the mid-band line, the stop loss is adjusted to the mid-band line.

[Floride] 4 Layers of Bollinger Shadow
This is the indicator I named 4LBS. That means four layers of bollinger shadow.
This is an indicator that I made to see how far past prices could affect the future prices.
And I found some very interesting and beautiful things about it, and I wanted to share them with you, so I publish this indicator.
*-*-*-*-*-*-*-*-*-*-*-*-*-*-*-*-*-*-*-*-*-*-*-*-*-*-*-*-*-*-*-*-*-*-*-*-*-*-*-*-*-*-*-*-*-*-*-*-*-*-*-*-*-*-*-*-*-*-*-*-*-*-*-*-*-
Hello, nice to meet you all. my name as a trader is Floride.
First of all, I am not good at English, so there may be many grammatically incorrect sentences below.
I ask for your understanding in advance. Thanks for your understanding.
*-*-*-*-*-*-*-*-*-*-*-*-*-*-*-*-*-*-*-*-*-*-*-*-*-*-*-*-*-*-*-*-*-*-*-*-*-*-*-*-*-*-*-*-*-*-*-*-*-*-*-*-*-*-*-*-*-*-*-*-*-*-*-*-*-
What is it?
bollinger Bands usually has one moving average line. And there's two bands that uses same period value of standard deviation as the former MA. And this indicator, by the way, has a 4 shadow bands
that uses twice,three,four,five time the value of the MA's period.
Appearance -
This indicator has four layers, and there are also other layers between them.
You can turn on or off all the shadow layers.
Uses of Indicator and Examples
examples of actual use
1. market strongness diagnosis
-It seems all layers of shadow has some degree resist/support forces.
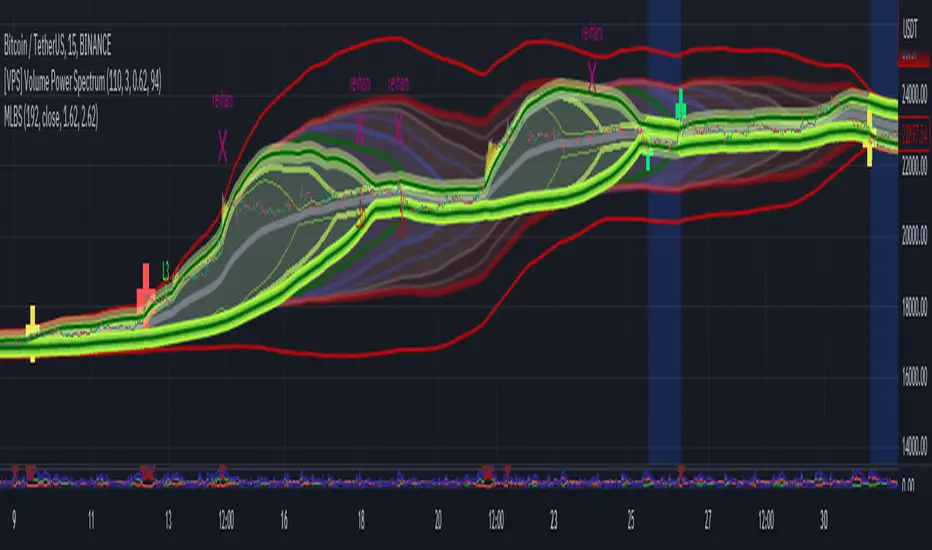
This indicator has the 4th layer - "L4". (indicated by red lines).
I saw emergence of volatility quite frequently when this last layer breaks through.
When price breaks through this area or line, shade appear on the L4 layer in red. and red cross appear on the that point. This is I called Marlin signal.
If you saw red color shadow in this indicator, then the market may have quite high volatility.
(of course, there's not 100%. Please be careful about this.)
But I've also checked in quite several markets. when this volatility emerges, then also that market seems to started to building quite directional power afterwards.
I mean, after the marlin signal, market tends to have bigger volatility, and tends to go one direction.
again, it's not 100%. but probability is quite high.
But maybe depending on the type of market you need some adjustment.
Recommended values are M2-1.618, M3-2.618
Or M2-1, M3-2. default value is M2-1.618, M3-2.618
and also, if prices breakthrough the channels, or layers, It tends to break through the at once, in first bar. In other words, if price don't break through the first or second candle, it's very likely that the price won't break through channel for the time being.
2. market weakness diagnosis
Usually, without external momentum, the price converges to the average value and does not deviate from the band. And if price fails to break through the most inner first layer-"L1 - the green channel", In that case, the market is usually assumed to be weak, or has low volatility.
- you can set alarms on tuna, marlin signal. and you don't have to watch chart all the time.
3. Signals
I put two signals in this indicator.
One has the name "Tuna," and the second has the name "Marlin."
As you can already tell from the name's feeling, tuna is a weaker signal and marlin is a stronger signal.
Actual example of a signal
1. Tuna signal
- When the tuna signal appears, you can guess that the current market is generally not weak. or has quite good directional force. or medium volatility.
Below is important.
- If a tuna signal appears, there is a possibility that a marlin will appear later.
- In my opinion, it might be wise not to have a position without a tuna signal.
- Almost all of the marlin signal appeared shortly after the tuna signal appeared.
2. Marlin signal
- When marlin signal appears, with a high probability, volatility can increase large.
- In the backtesting of the stock, in some cases, the market moved quite frequently in the direction of the marlin signal.
- The emergence of marlin can be seen as a pretty strong indication of the emergences of direction.
Bollinger Pair TradeNYSE:MA-1.6*NYSE:V
Revision: 1
Author: @ozdemirtrading
Revision 2 Considerations :
- Simplify and clean up plotting
Disclaimer: This strategy is currently working on the 5M chart. Change the length input to accommodate your needs.
For the backtesting of more than 3 months, you may need to upgrade your membership.
Description:
The general idea of the strategy is very straightforward: it takes positions according to the lower and upper Bollinger bands.
But I am mainly using this strategy for pair trading stocks. Do not forget that you will get better results if you trade with cointegrated pairs.
Bollinger band: Moving average & standard deviation are calculated based on 20 bars on the 1H chart (approx 240 bars on a 5m chart). X-day moving averages (20 days as default) are also used in the background in some of the exit strategy choices.
You can define position entry levels as the multipliers of standard deviation (for exp: mult2 as 2 * standard deviation).
There are 4 choices for the exit strategy:
SMA: Exit when touches simple moving average (SMA)
SKP: Skip SMA and do not stop if moving towards 20D SMA, and exit if it touches the other side of the band
SKPXDSMA: Skip SMA if moving towards 20D SMA, and exit if it touches 20D SMA
NoExit: Exit if it touches the upper & lower band only.
Options:
- Strategy hard stop: if trade loss reaches a point defined as a percent of the initial capital. Stop taking new positions. (not recommended for pair trade)
- Loss per trade: close position if the loss is at a defined level but keeps watching for new positions.
- Enable expected profit for trade (expected profit is calculated as the distance to SMA) (recommended for pair trade)
- Enable VIX threshold for the following options: (recommended for volatile periods)
- Stop trading if VIX for the previous day closes above the threshold
- Reverse active trade direction if VIX for the previous day is above the threshold
- Take reverse positions (assuming the Bollinger band is going to expand) for all trades
Backtesting:
Close positions after a defined interval: mark this if you want the close the final trade for backtesting purposes. Unmark it to get live signals.
Use custom interval: Backtest specific time periods.
Other Options:
- Use EMA: use an exponential moving average for the calculations instead of simple moving average
- Not against XDSMA: do not take a position against 20D SMA (if X is selected as 20) (recommended for pairs with a clear trend)
- Not in XDSMA 1 DEV: do not take a position in 20D SMA 1*standart deviation band (recommended if you need to decrease # of trades and increase profit for trade)
- Not in XDSMA 2 DEV: do not take a position in 20D SMA 2*standart deviation band
Session management:
- Not in session: Session start and end times can be defined here. If you do not want to trade in certain time intervals, mark that session.(helps to reduce slippage and get more realistic backtest results)

OB EmaCross + BBThis is my setup and the way I like to trade.
It is based in an EMA cross ( 9 x 21) and the Bollinger Bands without the central Moving Average.
I prefer to use the EMA cross in the middle of the bands.
It is also possible to activate "Colored Bars" to paint the candles according to the EMA cross: green if the candles are above both EMAs, white when at least one of them are in between EMAs and red if they are both below EMAs.
My operational works like this:
- Buy when price is above EMAs
- Sell when price is belos EMAs
Of course, I use BB to give me the direction of the trend and I only enter in a trade when the price is in the same trend of the BB.
I avoid trades when the bands are getting narrowed.
I hope you enjoy my indicator and let me know if you have any suggestion! ;)

Ichimoku Cloud and Bollinger Bands (by Coinrule)The Ichimoku Cloud is a collection of technical indicators that show support and resistance levels, as well as momentum and trend direction. It does this by taking multiple averages and plotting them on a chart. It also uses these figures to compute a “cloud” that attempts to forecast where the price may find support or resistance in the future.
The Ichimoku Cloud was developed by Goichi Hosoda, a Japanese journalist, and published in the late 1960s. It provides more data points than the standard candlestick chart. While it seems complicated at first glance, those familiar with how to read the charts often find it easy to understand with well-defined trading signals.
The Ichimoku Cloud is composed of five lines or calculations, two of which comprise a cloud where the difference between the two lines is shaded in.
The lines include a nine-period average, a 26-period average, an average of those two averages, a 52-period average, and a lagging closing price line.
The cloud is a key part of the indicator. When the price is below the cloud, the trend is down. When the price is above the cloud, the trend is up.
The above trend signals are strengthened if the cloud is moving in the same direction as the price. For example, during an uptrend, the top of the cloud is moving up, or during a downtrend, the bottom of the cloud is moving down.
The Bollinger Bands are among the most famous and widely used indicators. A Bollinger Band is a technical analysis tool defined by a set of trendlines plotted two standard deviations (positively and negatively) away from a simple moving average ( SMA ) of a security's price, but which can be adjusted to user preferences. They can suggest when an asset is oversold or overbought in the short term, thus providing the best time for buying and selling it.
This strategy combines the Ichimoku Cloud with Bollinger Bands to better enter trades.
Long orders are placed when these basic signals are triggered.
Long Position:
Tenkan-Sen is above the Kijun-Sen
Chikou-Span is above the close of 26 bars ago
Close is above the Kumo Cloud
The closing price is greater than the upper standard deviation of the Bollinger Bands
Short Position:
Tenkan-Sen is below the Kijun-Sen
Chikou-Span is below the close of 26 bars ago
Close is below the Kumo Cloud
The upper standard deviation of the Bollinger Band is greater than the closing price
The script is backtested from 1 January 2022 and provides good returns.
The strategy assumes each order is using 30% of the available coins to make the results more realistic and to simulate you only ran this strategy on 30% of your holdings. A trading fee of 0.1% is also taken into account and is aligned to the base fee applied on Binance.
This script also works well on BTC 30m/1h, ETH 2h, MATIC 2h/30m, AVAX 1h/2h, SOL 45m timeframes

Bollinger Bands + EMA 9A 1 minute scalping strategy.
Uses Bollinger Bands (no basis line) and a 9 period EMA.
Waits for price to close below the lower Bollinger Band and the next candle to close bullish above the lower Bollinger Band but below the 9 Period EMA.
If all conditions are met, the script enters a long position with TP at the 9 Period EMA.

Best TradingView Strategy - For NASDAQ and DOW30 and other IndexThe script is totally based on momentum , volume and price. We have used :
1: Bollinger Band Squeezes to know when a breakout might happen.
2: Used Moving Averages(SMA and EMA) to know the direction.
3: The success Rate of this strategy is above 75% and if little price action is added it can easily surpass 90% success mark.
4: Do not worry about drawdowns , we have implemented trailing SL ,so you might see a little extra drawdown but in reality its pretty less.
5: I myself have tested this strategy for 41 days with a 250$ account and right now I have 2700$.

K's Reversal Indicator IK's reversal indicator I is a special combination between Bollinger bands and the MACD oscillator. It is a contrarian indicator that depends on the following conditions:
• A buy signal is generated whenever the current market price is below the 100-period lower Bollinger band while simultaneously, the MACD value must be above its signal line. At the same time, the previous MACD value must be below its previous signal line.
• A sell (short) signal is generated whenever the current market price is above the 100-period upper Bollinger band while simultaneously, the MACD value must be below its signal line. At the same time, the previous MACD value must be above its previous signal line.
The way to use K's reversal indicator is to combine it with your already long/short bias in a sideways/range market in order to maximize the probability of success.
Limitations of the indicator include the following:
• There are no clear exit rules that work well on average across the markets. Even though K’s reversal indicator gives contrarian signals, it does not show when to exit the positions.
• As with other indicators, it underperforms on some markets and is not to be used everywhere.
• False signals tend to occur during trending markets but there is no proven way to detect a false signal.

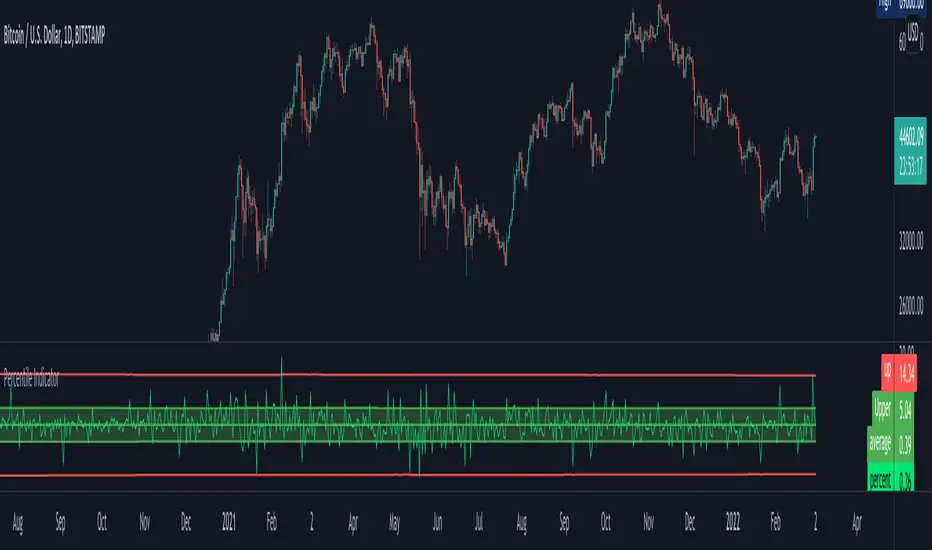
Percentile Major Move Indicator This indicator is a powerful tool for understanding how big of a move a product, crypto, or currency has recently had.
Anything inside of the green bars is a standard move with a 68% chance of happening based on your chart timeframe.
Any move that touches the red lines to the upside or downside has a 2%+ chance of happening in either direction.
This is a powerful indicator but just one point of data and should be used as such.
Bollinger Bands Fibonacci Ratios StrategyHello, everyone!
We have just released an innovative strategy for TradingView. It allows you to identify price pivot points and volatility.
This strategy is:
User-friendly
Configurable
Equipped with Bollinger Bands and smoothed ATR to measure volatility
Features
Thanks to the BB Fibo strategy, you can:
Trade stocks and commodities.
Identify price pivot points.
Choose any band for trading Long or Short positions.
Swap upper and lower bands applying Use Reverse Buy/Sell parameters.
Note! The upper bands are for the Long position. The lower bands are for the Short positions.
Parameters
We have equipped our strategy with more than 14 additional parameters. So, you can configure the EA according to your needs!
Inputs:
Length
Source: Open, High, Low, Close, HL2, HLC3, OHLC4
Offset
Fibonacci Ratio 1 — a Fibonacci factor for the 1st upper and lower indicator lines calculating.
Fibonacci Ratio 2 — a Fibonacci factor for the 2nd upper and lower indicator lines calculating.
Fibonacci Ratio 3 — a Fibonacci factor for the 3d upper and lower indicator lines calculating.
Use Reverse Buy — the strategy will use lower Bollinger bands instead of upper ones.
Fibonacci Buy — band selection for opening Long positions conditions.
Use Reverse Sell — the strategy will use upper Bollinger bands instead of lower ones.
Fibonacci Sell — band selection for opening Short positions conditions.
Style:
Basis — baseline color and style settings.
Upper 3 — the 3d upper line color and style.
Upper 2 — the 2nd upper line color and style.
Upper 1 — the 1st upper line color and style.
Lower 1 — the 1st lower line color and style.
Lower 2 — the 2nd lower line color and style.
Lower 3 — the 3d upper line color and style.
Background — the background color within the 3d upper and 3d lower indicator band.
Precision — the number of decimals for BB Fibo values.
Note! Try BB Fibo on your demo account first before going live.

Sideways Strategy DMI + Bollinger Bands (by Coinrule)Markets don’t always trade in a clear direction. At a closer look, most of the time, they move sideways. Relying on trend-following strategies all the time can thus lead to repeated false signals in such conditions.
However, before you can safely trade sideways, you have to identify the most suitable market conditions.
The main features of such strategies are:
Short-term trades, with quick entries and quick exits
Slightly contrarian and mean-reversionary
Require some indicator that tells you it’s a sideways market
This Sideways DMI + Bollinger Bands strategy incorporates such features to bring you a profitable alternative when the regular trend-following systems stop working.
ENTRY
1. The trading system requires confirmation for a sideways market from the Directional Movement Index (DMI) before you can start opening any trades. For this purpose, the strategy uses the absolute difference between positive and negative DMI, which must be lower than 20.
2. To pick the right moment to buy, the strategy looks at the Bollinger Bands (BB). It enters the trade when the price crosses over the lower BB.
EXIT
The strategy then exits when the move has been exhausted. Generally, in sideways markets, the price should revert lower. The position is closed when the price crosses back down below the upper BB.
The best time frame for this strategy based on our backtest is the 1-hr. Shorter timeframes can also work well on certain coins that are more volatile and trade sideways more often. However, as expected, these exhibit larger volatility in their returns. In general, this approach suits medium timeframes. A trading fee of 0.1% is taken into account. The fee is aligned to the base fee applied on Binance, which is the largest cryptocurrency exchange.
You can execute this strategy on your favourite exchange at coinrule.com.

Beacon - Anthony Crudele's IndicatorBeacon uses the current volatility of the market based on your trading time frame to determine support and resistance levels, whether a trend is intact or ready to revert back in the range. One of the most difficult things I went through as a trader was determining whether we are in a trend day or if we are in grind up or grind down mode. I created Beacon to give me a simple look at the market to determine what type of environment we are in. I use Bollinger Bands (3 standard deviation) to determine the volatility cycle. Once the BB make peaks I took my Fibonacci Retracement tool and did a retracement from the peak high of the BB to the peak low. I use 70%, 50% and 30% for my support and resistance levels. I use those levels because I tested pretty much every percent level and those percentages averaged the highest performance on all tick charts and time charts. You can use Beacon on whatever time frame or tick chart you are trading on and it will determine that specific volatility cycle.


Calendar's Bollinger BandsHI guys, I'm Calendar
I made my 2nd indicator for my followers.
This indicator made by merging 2 Bollinger Bands.(SDV =1, 2)

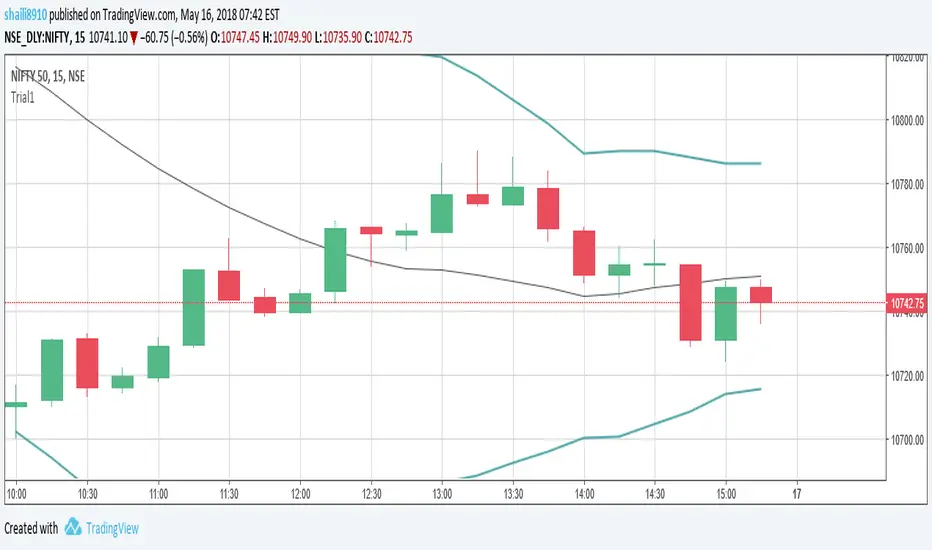
Bollinger Band Open Gap Alert V1This is the bare bones of what I'm trying to achieve through pine script. The purpose of the script is to:
1. On a 15m chart, calculate and plot upper & lower Bollinger bands and simple moving average of 20 periods. (DONE)
2. On a new day, when the first 15m candle of a session forms, I want to check if a) the low of the new candle is outside the upper Bollinger band (also known as an open gap up) or b) if the high of the candle is the outside the lower Bollinger band (also known as open gap down). In other words, I want to know if the Bollinger Bands are not touching the new candle's wicks/shadows. (DONE)
3. Alert me if the above happens. (DONE)
4. Run the indicator through an entire watch list. I'm not sure if that's possible, yet. (HELP)
For the above job, this is what I could come up with. I need guidance for the last step . And any suggestions for corrections or improvements would be greatly appreciated!
8EMA+BB-SubiProvides the facility to display 8 EMAs along with Bollinger Bands in the same indicator.

Oleg_Aryukov_StrategyTrader Oleg Aryukov's strategy, based on a variety of oscillators, allows him to try to catch reversals in cryptocurrencies.

BB Breakout + EMA Touch (50/100)Shows points only when BOTH happen on the same candle:
1️⃣ Price breaks through Bollinger Bands
2️⃣ Price touches (or crosses) EMA 50 or EMA 100

XAUUSD Pro Setup Suite manuel_lnt.fx is an advanced Pine Script v6 indicator designed exclusively for XAUUSD, built to automatically detect the 5 highest-probability setups in gold day trading.
It combines institutional price action, volatility patterns, mean reversion logic, and momentum confirmation to generate clean, filtered, and actionable signals.
The indicator automatically detects:
⸻
1️⃣ Break & Retest Premium (BR)
Identifies valid breaks of key levels and signals the retest with rejection wick, EMA20 trend confirmation, and neutral RSI.
→ Excellent for trend continuation.
⸻
2️⃣ Fakeout Liquidity Trap (FO)
Detects liquidity grabs above highs or below lows with an opposite close + engulfing candle confirmation.
→ The strongest setup for fast and explosive reversals on gold.
⸻
3️⃣ MACD Zero-Line Shift (MACD)
Signals when the MACD crosses the zero line while price breaks micro-structure.
→ Perfect for spotting the start of a new trend.
⸻
4️⃣ Bollinger Squeeze → Breakout (BB)
Recognizes volatility compression and signals when a breakout is likely to explode.
→ Ideal for clean breakout trades.
⸻
5️⃣ Mean Reversion on EMA50 (MR)
Highlights price extensions far away from the EMA50 with ATR confirmation and a reversal candle.
→ Great for pullbacks back toward the mean value.

Stochastic + Bollinger Bands Multi-Timeframe StrategyThis strategy fuses the Stochastic Oscillator from the 4-hour timeframe with Bollinger Bands from the 1-hour timeframe, operating on a 10-hour chart to capture a unique volatility rhythm and temporal alignment discovered through observational alpha.
By blending momentum confirmation from the higher timeframe with short-term volatility extremes, the strategy leverages what some traders refer to as “rotating volatility” — a phenomenon where multi-timeframe oscillations sync to reveal hidden trade opportunities.
🧠 Strategy Logic
✅ Long Entry Condition:
Stochastic on the 4H timeframe:
%K crosses above %D
Both %K and %D are below 20 (oversold zone)
Bollinger Bands on the 1H timeframe:
Price crosses above the lower Bollinger Band, indicating a potential reversal
→ A long trade is opened when both momentum recovery and volatility reversion align.
✅ Long Exit Condition:
Stochastic on the 4H:
%K crosses below %D
Both %K and %D are above 80 (overbought zone)
Bollinger Bands on the 1H:
Price reaches or exceeds the upper Bollinger Band, suggesting exhaustion
→ The long trade is closed when either signal suggests a potential reversal or overextension.
🧬 Temporal Structure & Alpha
This strategy is deployed on a 10-hour chart — a non-standard timeframe that may align more effectively with multi-timeframe mean reversion dynamics.
This subtle adjustment exploits what some traders identify as “temporal drift” — the desynchronization of volatility across timeframes that creates hidden rhythm in price action.
→ For example, Stochastic on 4H (lookback 17) and Bollinger Bands on 1H (lookback 20) may periodically sync around 10H intervals, offering unique alpha windows.
📊 Indicator Components
🔹 Stochastic Oscillator (4H, Length 17)
Detects momentum reversals using %K and %D crossovers
Helps define overbought/oversold zones from a mid-term view
🔹 Bollinger Bands (1H, Length 20, ±2 StdDev)
Measures price volatility using standard deviation around a moving average
Entry occurs near lower band (support), exits near upper band (resistance)
🔹 Multi-Timeframe Logic
Uses request.security() to safely reference 4H and 1H indicators from a 10H chart
Avoids repainting by using closed higher-timeframe candles only
📈 Visualization
A plot selector input allows toggling between:
Stochastic Plot (%K & %D, with overbought/oversold levels)
Bollinger Bands Plot (Upper, Basis, Lower from 1H data)
This helps users visually confirm entry/exit triggers in real time.
🛠 Customization
Fully configurable Stochastic and BB settings
Timeframes are independently adjustable
Strategy settings like position sizing, slippage, and commission are editable
⚠️ Disclaimer
This strategy is intended for educational and informational purposes only.
It does not constitute financial advice or a recommendation to buy or sell any asset.
Market conditions vary, and past performance does not guarantee future results.
Always test any trading strategy in a simulated environment and consult a licensed financial advisor before making real-world investment decisions.
