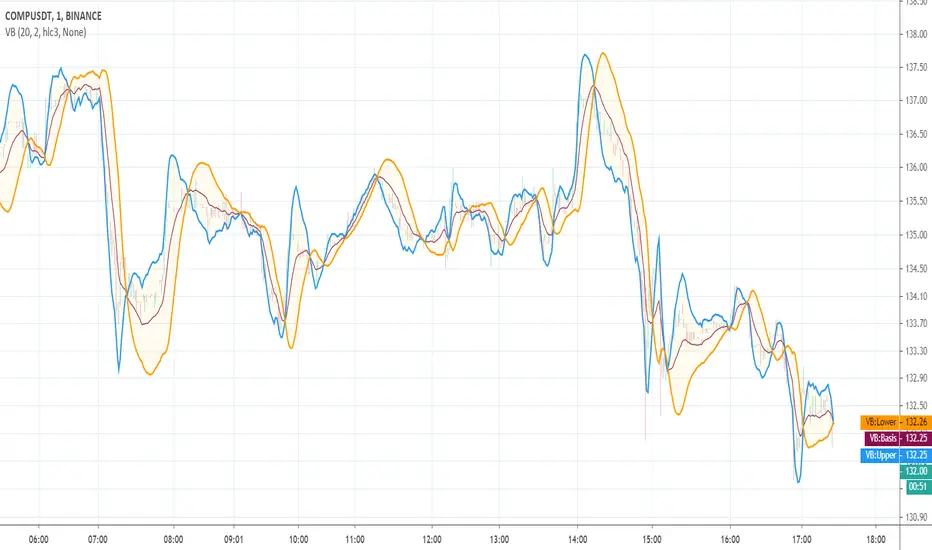
Vortex BandsA slighty modified version of Better Bollinger Bands. The idea of the experiment was to do a thing like the well-known Vortex Indicator, but an overlay:
Obvious trading rules are:
go Long when the blue line is above other two
go Short when the orange line is above other two
stop when price crosses the basis line
The tool is EXPERIMENTAL . Good luck!
Buscar en scripts para "bollingerband"
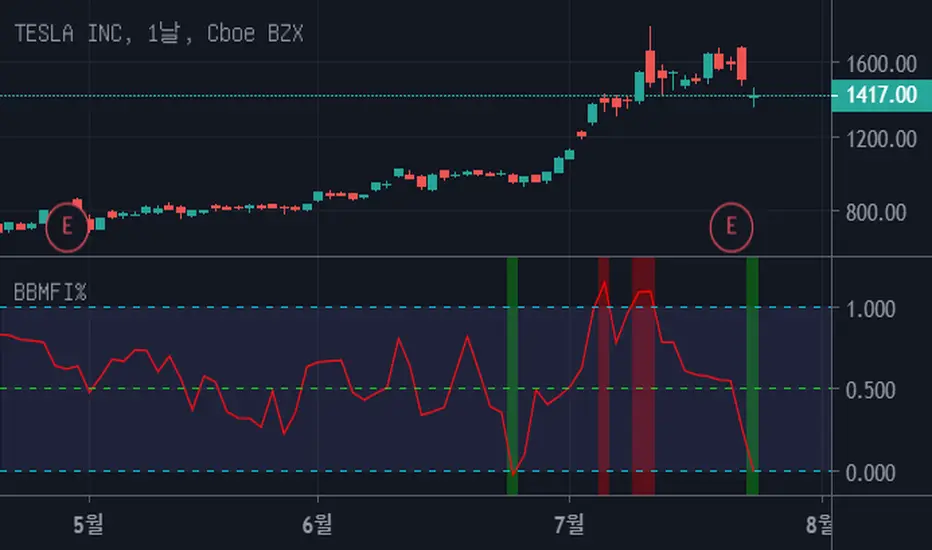
Bollinger Bands Money Flow Index %This script is similar to the previous one "Bollinger Bands Money Flow Index" but it's a little easier to interpret.
Fix the top line of the "BBMFI" to 1, and the bottom line to 0.
Indicates where "Money Flow Index" is located between the top and bottom lines.
If it's bigger than 1, it's overbuying. If it's less than 0, it's overselling.
Consider a trade if you are out of range from 0 to 1.
It's also a good trade timing to out of range and come back in.
Bollinger Bands Money Flow IndexThis script embodies the application of the Bollinger Band and Money Flow Index in John A. Bollinger's book "Bollinger on Bollinger Bands."
"Bollinger on Bollinger Bands" suggests a relatively method of analysis by applying the Bollinger Band to an indicator.
Here's one of the indicators, Money Flow Index.
Money Flow Index is an indicator of overbuying and overselling by reflecting the volume of transactions.
"Bollinger on Bollinger Bands" suggests using the Bollinger Band to create relative top and bottom lines for various indicators, such as Money Flow Index.
Original Money Flow Index is considered to be over-purchased if it is more than 80% and over-selling if it is less than 20%.
But if you put a bolinger band on it, you can set the standard for higher or lower over-selling and over-selling in a sustained bullish, bearish market.
This script uses the following values as the default values as recommended by "Bollinger on Bollinger Bands".
Money Flow Index for 10 days.
a bollinger band of forty days
standard deviation of 2
The above values are suitable for most stocks and markets, but sometimes there is too much or too little data inside the Bollinger Band.
It is recommended to modify each value little by little to adjust 85% to 90% of the total data to fit inside the Bollinger Band.
If the value is higher than the top line, it is considered over-purchased, and a red background color appears.
If the bottom line is crossed down, it is considered over-sold and the green background color appears.

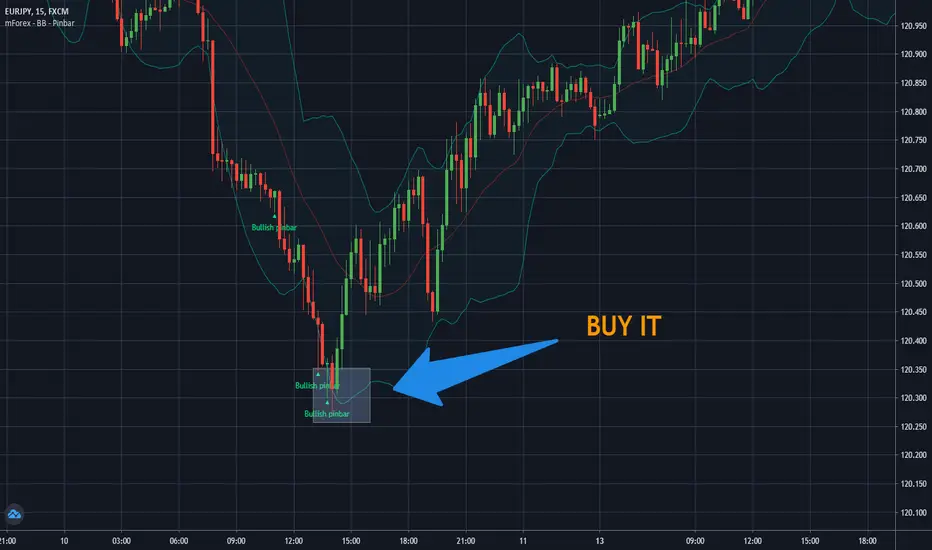
mForex - Bollinger Bands - Pinbar scalping systemTransaction setup parameters
Time frame: M5, M15
Currency pair: Any except XAU/USD
Trading strategies
=== BUY ===
Price break out of the lower Bollinger Bands
The Pinbar reversal candlestick appears and closes the candle on the lower Bollinger Bands
Stop loss: Nearest bottom + 3-5 pips
Profit target: 10-20 pips
=== SELL ===
Price break out of the upper Bollinger Bands
The Pinbar reversal candle appeared and closed below the upper
Stop loss: Nearest peak + 3-5 pips
Profit target: 10-20 pips
* If you have any questions or suggestions for this strategy, feel free to ask us.
Median Absolute Deviation Filtered SMA & BBMedian Absolute Deviation (MAD) is a robust measurement of variability and more resilient against outliers and small samples.
This experiment uses MAD as a means of filtering outliers from an SMA calculation. First we construct the equivalent of a Bollinger Band, but based on the median as the basis and a multiple( k ) of MAD as the outlier cutoff.
k can be set a number of ways. As a simple multiple (3 - very conservative / 2.5 - moderately conservative / 2 - poorly conservative). Alternatively MAD can be used as an estimator of standard deviation by using a multiple of 1.4826 (SD1 - 1.4826 / SD2 - 2.9652 / SD3 - 4.4478).
Once we have a cutoff range an SMA is calculated with the outliers filtered out. Additionally a Bollinger band can be output using the filtered SMA as the basis and a multiple of the MAD instead of SD for the bands.

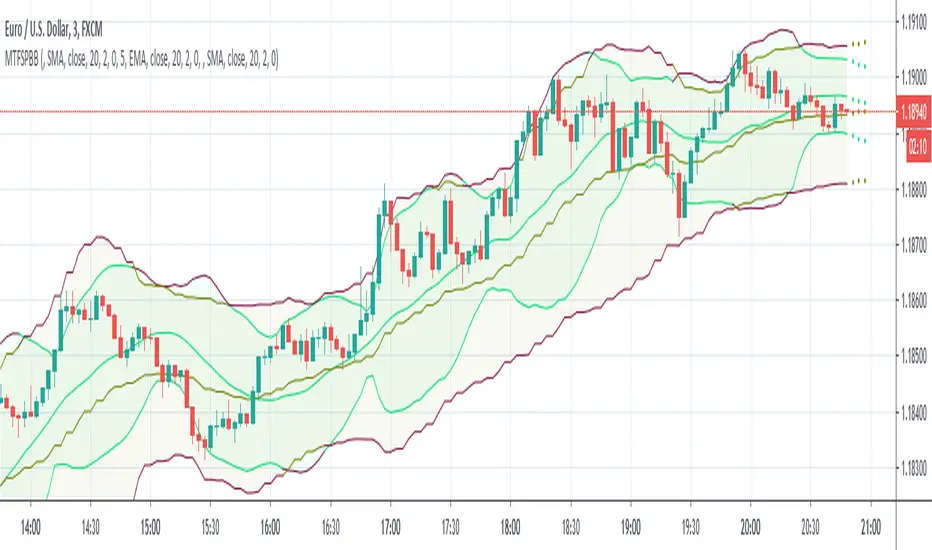
MultiTimeFrame Shifting Predictive Bollinger BandsThis is the optimized version of my MTFSBB indicator with capability of possible bands prediction in case of negative shifting (to the left).
Make me happy by using it and sending me your ideas about the prediction.
Double BB + Multi Ema Use this indicator to identify the market trend, possible dynamic Supports or Resistances and possible setbacks or corrections.
Take the Moving Averages (50,75,100,200) as a reference to identify if the market is bullish or bearish.
Have as reference the Moving Averages (8,15,20,25) as possible dynamic Supports or Resistances.
Have the BB as a reference, to identify possible setbacks or changes in trends.

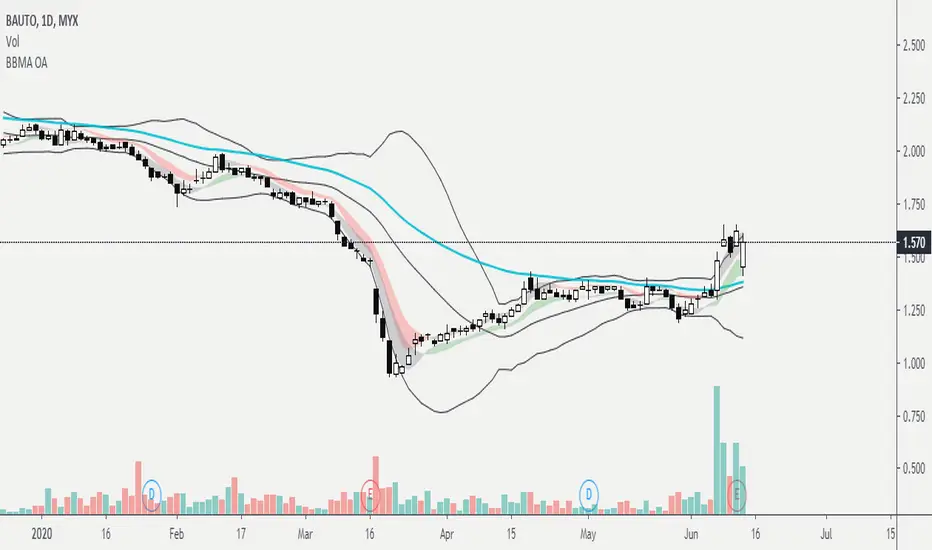
BBMA : Bollinger Band & Moving AverageBased on trading technique by Mr Oma Ally, Technical Analysis Guru.
1. Bollinger Band - standard setting, MA20, Dev = 2
2. EMA 50 ( Line Color = Aqua )
3. WMA High ( wma5 High and wma10 High )
Area Pink : WMA5 High < WMA10 High
Area Gray : WMA5 High > WMA10 High
4. WMA Low ( wma5 Low and wma10 Low )
Area Green : WMA5 Low > WMA10 Low
Area Gray : WMA5 Low < WMA10 Low
5. If you wish to see wma lines, adjust the transparency at the menu.
This is just an indicator setting.
For technique and how to apply for trading, kindly please refer to web/youtube/class/etc :)
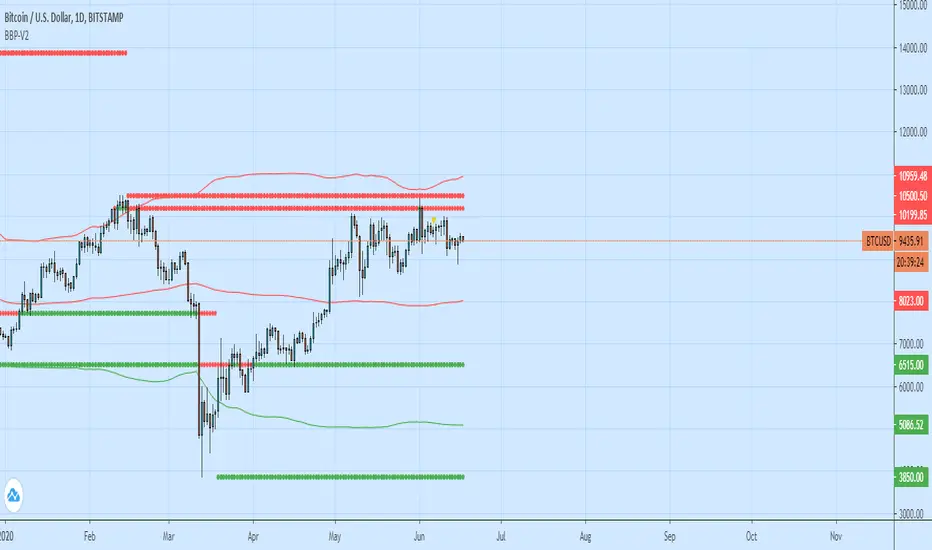
Bollinger Bands + Pivots - V2It drawes a higest or lowest pivot when price intersects with bollinger bands.

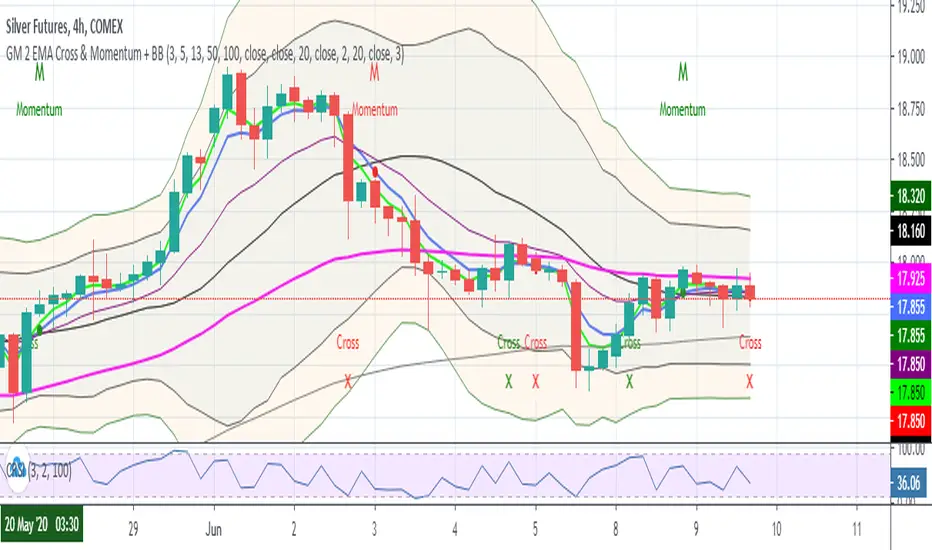
GM 2 EMA Cross + BBScript for seeing the below EMAs
3
5
13
50
100
This also plots a red cross when -ve crossover of 3 by 5 EMA & green cross when +ve crossover of 3 by 5 EMA
Bollinger Bands
2
3
MultiTimeFrame Shifting Bollinger BandsJust 3 Bollinger Bands with different adjustable timeframes plus shifting (left/right) capability and non-integer deviation values.
I wrote this because I couldn't find the perfect BB indicator that matches my needs. Feel free to use it.

GM EMA BB {EMA(5-26-50) + BB(2-3)}A modified script that shows the EMA of 5, 26, 50 along with nested Bollinger Bands of 2 & 3 mult.
Useful for Growth Module students

CBG Swing HighLow MAThis indicator will show the swing high and lows for the number of bars back. It's very easy to use and shows good support and resistance levels.
I then took it a step further and added a moving average with all the standard types in my indicators:
SMA
EMA
Weighted
Hull
Symmetrical
Volume Weighted
Wilder
Linear Regression
I then added Bollinger Bands to show the standard deviation from the midline.
Finally, I added a simple bar coloring scheme: green if above the upper BB, Red if below and orange if in the middle.
I am just testing this out so please use with caution. If anyone in the community wants to run some backtests, that would be great and we would all appreciate it.
Of course you can keep it all simple and turn off all the moving averages and bollinger bands.
Enjoy! :-)

Gap driven intraday trade (better in 15 Min chart)// Based on yesterday's High, Low, today's open, and Bollinger Band (20) in current minute chart,
// Defined intraday Trading opportunity: Stop, Entry, T0, Target (S.E.T.T)
// Back test in 60, 30, 15, 5 Min charts with SPY, QQQ, XOP, AAPL, TSLA, NVDA, UAL
// In 60 and 30 min chart, the stop and target are too big. 5 min is too small.
// 15 min Chart is the best time frame for this strategy;
// -------------------------------------------------------------------------------
// There will be Four lines in this study:
// 1. Entry Line,
// 1.1 Green Color line to Buy, If today's open price above Yesterday's High, and current price below BB upper line.
// 1.2 Red Color line to Short, if today's open price below Yesterday's Low, and current above BB Lower line.
//
// 2. Black line to show initial stop, one ATR in current min chart;
//
// 3. Blue Line (T0) to show where trader can move stop to make even, one ATR in current min chart;
//
// 4. Orange Line to show initial target, Three ATR in current min chart;
//
// Trading opportunity:
// If Entry line is green color, Set stop buy order at today's Open;
// Whenever price is below the green line, Prepare to buy;
//
// If Entry line is Red color, Set Stop short at today's Open;
// Whenever price is above the red line, Prepare to short;
//
// Initial Stop: One ATR in min chart;
// Initial T0: One ATR in min chart;
// Initial Target: Three ATR in min chart;
// Initial RRR: Reward Risk Ratio = 3:1;
//
// Maintain: Once the position moves to T0, Move stop to "Make even + Lunch (such as, Entry + $0.10)";
// Allow to move target bigger, such as, next demand/supply zone;
// When near target or demand/supply zone or near Market close, move stop tightly;
//
// Close position: Limit order filled, or near Market Close, or trendline break;
//
// Key Step: Move stop to "Make even" after T0, Do not turn winner to loser;
// Willing to "in and out" many times in one day, and trade the same direction, same price again and again.
//
// Basic trading platform requests:
// To use this strategy, user needs to:
// 1. Scan Stocks Before market open:
// Prepare a watch list for top 10 ETF and Top 90 stocks which are most actively traded.
// Stock might be limited by price range, Beta, optionable, ...
// Before market open, Run a scan for these stocks, find which has GAP and inside BB;
// create watch list for that day.
//
// 2. Attach OSO and OCO orders:
// User needs to Send Entry, Stop (loss), and limit (target) orders at one time;
// Order Send order ( OSO ): Entry order sends Stop order and limit order;
// Order Cancel order ( OCO ): Stop order and limit order, when one is filled, it will cancel the other instantly;

(NKC) MTF Squeeze Pro MultiTimeframe Squeeze Momentum Pro
Dots indicate squeeze
Fills indicate momentum


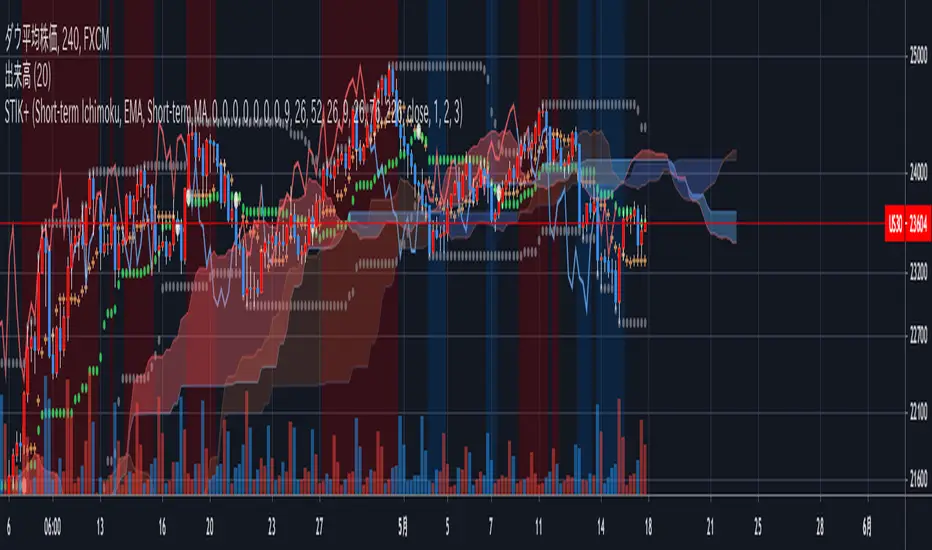
Short-Term Ichimoku Kinko-hyo+This Ichimoku Kinko-Hyo is an indicator which has been changed for short-term trading and, It has a “target price theory(one of three theory of Ichimoku Kinko-Hyo) function.”
Also, In this indicator, It can be plotting the “Span model”, “Super Bollinger Bands” which has Invented by a Japanese currency dealer Toshihiko Masaki, And Moving Average.
In addition, you can select setting only “clouds” and “Lagging span” or displaying Default Ichimoku Kinko-Hyo.
This indicator is modified original Ichimoku Kinko-Hyo, but It made based on the true usage of Ichimoku Kinko-Hyo.
For the evidence, I referred to the book supervised by Ichimoku-Sanjin the third generation.
Describe below about features↓↓↓.
- 2nd Cloud to check relation two Lead Lines and Lagging span.
- Background-color for discovering “Three Roles Improvement (In Japanese: 三役好転)” and “Three Roles Reversal (In Japanese: 三役逆転)”.
- Signal of Crossing Base Line and Conversion Line.
- mode selection of Ichimoku Kinko Hyo.
- Calculation feature for Target Price theory.
- A switch to replace Base Line and Conversion Line with 3 Moving Average lines.
- And others...
JSE Top 40 Comparative Relative StrengthThis code adapts the code by vitvlkv to be appropriate for comparison of JSE stocks with the Top 40 index. It also includes moving averages and Bollinger Bands to identify extreme conditions. You can change the colours and deselect moving averages to make the plot less cluttered. You can also change the selection to compare the stock against to JSE:J201 if you want to compare it to the All Share Index.

Mean Reversion w/ Bollinger BandsThis is a more advanced version of my original mean reversion script.
It employs the famous Bollinger Bands.
This robot will buy when price falls below the lower Bollinger Band, and sell when price moves above the upper Bollinger Band.
I've only tested it on the S&P 500, though you could try it out on other assets to see the backtest performance.
During the recent COVID-19 bear market drop, it produced several buy signals on the S&P which I followed, and made some nice gains so far.
I still think this would make a better investing strategy (buy undervalued / sell over-valued), rather than a trading strategy.
I use this robot for my long term portfolio.

Better Bollinger BandsIt is a highly configurable Bollinger Bands implementation.
You can choose different moving averages: EMA, SMA, WMA, VWMA, RMA (Wilder's EMA), ZLEMA, HMA (Hull MA), ALMA
Select between standard or mean deviation
You can use "High" or "Low" for upper and lower bands, which makes them much better for dynamic support-resistance
You can shift (offset) right the bands to use it as support and resistance in the future

Bollinger Bands Fibonacci Ratios (Automatic Timeframe)A Fibonacci Bollinger Bands indicator with automatic timeframe detection.
The timeframe reverts to the value specified in settings when viewing Daily, Monthly or seconds-based charts.
Based on: Bollinger Bands Fibonacci ratios by Shizaru (/script/bCy9urOG-Bollinger-Bands-Fibonacci-ratios/)

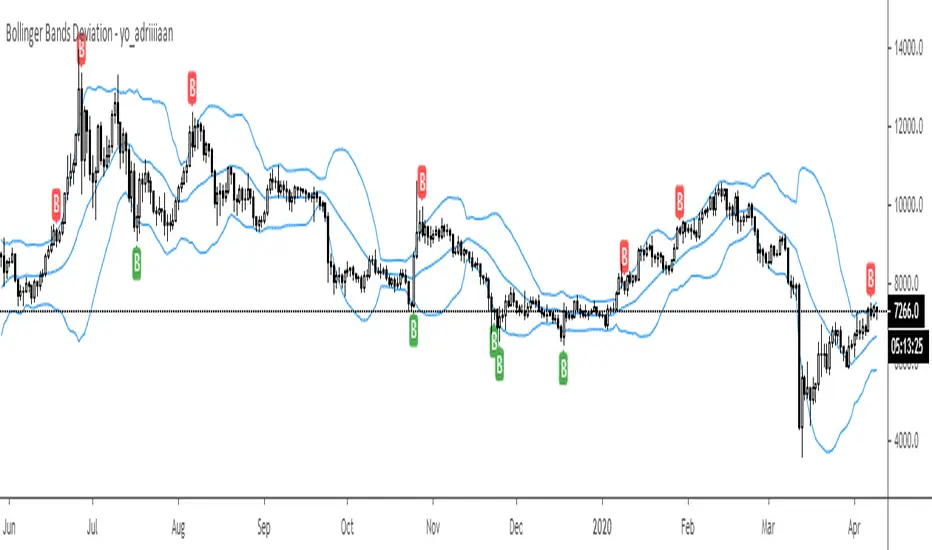
Bollinger Bands Deviation - yo_adriiiiaanBollinger Band Deviations
In theory price trades within 2 standard deviations 95% of the time. This is an attempt to capture that 5% that deviates from the bands.
Useful for taking profit or signaling a reversal.