Express - Strategy TesterWelcome to the Express - Strategy Tester.
This indicator is used for back-testing. Once you have found settings that you like, you can use my other published indicator "Express" to set alerts.
How to use: Apply to any chart, on any time frame. You will see LONG and SHORT signals on the chart. A LONG signal represents an entry/buy in, and a SHORT signal represents an exit/sell.
You can use the Express - Strategy Tester to scalp on low time frames such as the 5m, 15m, 30m etc. Or use it on higher time frames such as the 1hr, 2hr, 4hr.
You can use regular candles but Heikin Ashi are recommended for better accuracy.
When using Heikin Ashi, I have included a real price line which shows the actual price of the asset/chart at the close of each candle.
You cannot set alerts with this indicator!
Buscar en scripts para "bitcoin"

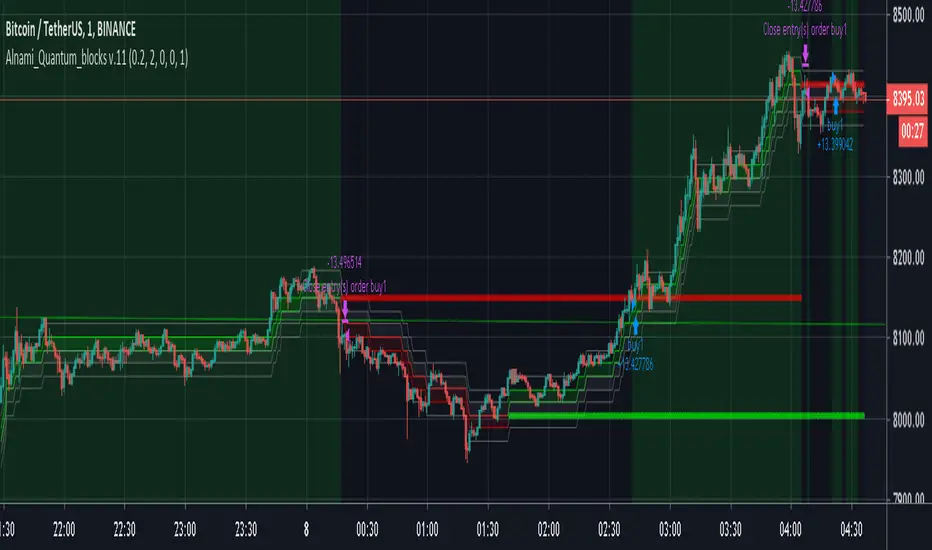
Alnami_Quantum_blocks v.11The (Al Nami Quantum Blocks v.11) script is based on Renko chart that is based on % move of the selected symbol. This is different from the traditional or ATR based Renko charts..
box size = user selected percentage x current price
Alnami Quantum Blocks Channel is composed of 5 levels that are calculated based on the box size:
1- Base
2- Green Box High (GBH) = Base + box size
3- Next Green Box trigger (GBN) = base + (box size x 2)
4- Red Box Low ( RBL ) = Base - box size
5- Next Red Box trigger ( RBN ) = base - (box size x 2)
Those levels will appear in the chart with the following order:
------GBN-------
------GBH-------
------BASE------
------RBL-------
------RBN-------
Usually when prices are trending up, the price will stay above the base for most of the time,, when it trending downwards, price stays below base most of the time..
Now how to time your entries based on the channel?
This strategy draws two levels, breakout level (top red line) and stop level (bottom green line).
If the price is above red line, place a buy order
If the price is below the green line, place a sell order
In version 11 of the Quantum blocks, you can choose to make the those two lines drawn using:
recent/near term price actions (less accurate) and fast - set the number of Legs to low value
or
wider term price actions (more accurate) and slow - set the number of Legs to high value
This version also tracks the last three changes for the red and green lines as following:
1- Above, Above, Above = 3
2- Above, Above, Below = 2
3- Above, Below, Below = 1
4- Below, Below, Below = 0
I did run full optimization for the settings of this strategy on Bitcoin (Binance:BTCUSDT) for the following multiple time frames using Amibroker scrips and data downloaded from Binance through a REST API call. The TFs were for 1min, 15min, 30min, 45min, 90min, 120min, 180min, and 240min.
pair Input Settings
btc TF Profit% Sys DD% Trade DD% sharpe% # Trades Win% Wave% # of Legs up lo
1 204 40.16 15.04 1.33 132 40.15 1.5 4 3 3
15 249 35 14.3 2.96 35 51.43 1.8 3 1 3
30 469 28.95 14.04 3.82 34 67.65 1.4 3 1 3
45 712 54.48 23.3 2.49 46 54.35 1.7 3 3 3
90 1114 40.51 21.41 3.3 48 54.17 1.4 2 3 3
120 602 25.32 16.8 2.82 51 43.14 1.2 2 3 3
180 960 35.9 20.09 3.33 42 52.38 0.9 2 2 3
240 819 46.84 28.27 3.48 46 65.22 0.6 2 3 3
I spent a lot of time and resource in providing the above, If this script/back tests helped in making some profits, then kindly express your appreciation and support to this work by sending some altcoins to any of the following wallets, this will encourage me sharing more stuff with the public:
BTC : 15VLCLZRkEhhZn6E4gNjMLVYnmCcUzKvWU
LTC : LN6mE6aZhEqVVfssmaQ3kk8PPspWQ5wToy
ETH : 0x7901035f2b6f334fa404d0ceb187d7bfcfdb72ce
Dompeet Pompeet (Breakout bot)Dompeet Pompeet is my first attempt at a viable swingtrading algo.
It uses volatility and some trend analysis to enter trade when the market is about to breakout or break down. Having a trailing stop locks in profits and prevents runaway losses for low drawdown and 2:1 profit factor.
Settings to use:
BTCUSD or XBTUSD
4hr Timeframe or 2hr or 1hr (not shorter)
Bars window: 13, 16 or 20 bars
Moving average settings: 100/10 EMA to confirm trend
Trade the Trend - check on to only take trades long in a confirmed uptrend (vice versa short), otherwise it will attempt to buy and sell counter trend, which increases profits but also increases loss rate.
Trailing stop, values from 2-5% give the best results.
Take with a pinch of salt, there are some bugs in pine script which are difficult to track down but overall I'm pleased with the idea.

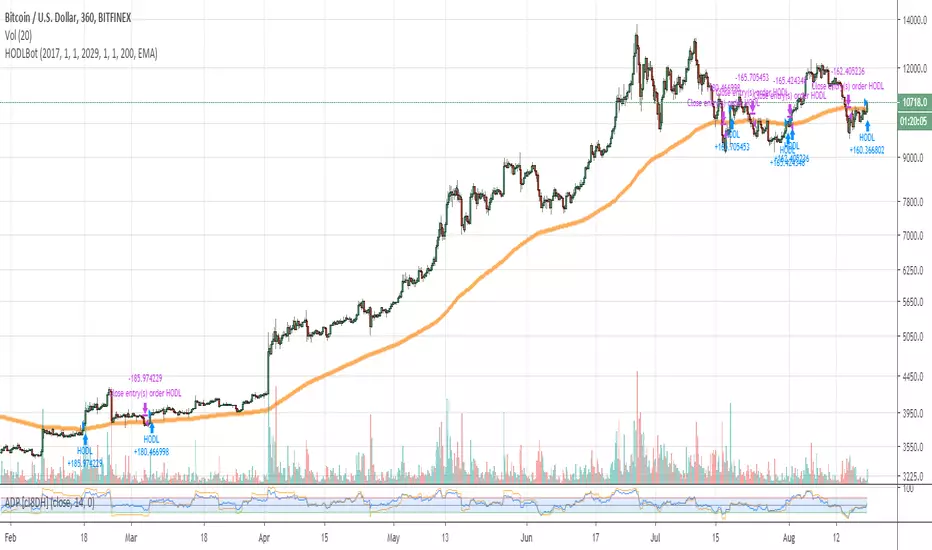
HODLBotHODLBot is a very simple script that HODLs BTC when price > 200 EMA on 6hr timeframe, and sells (closes long) when price < 200 EMA.
Designed to be used with just coins / not leveraged trading, to allow restful sleep knowing that you're not participating in brutal drawdowns like 2018 ^_^
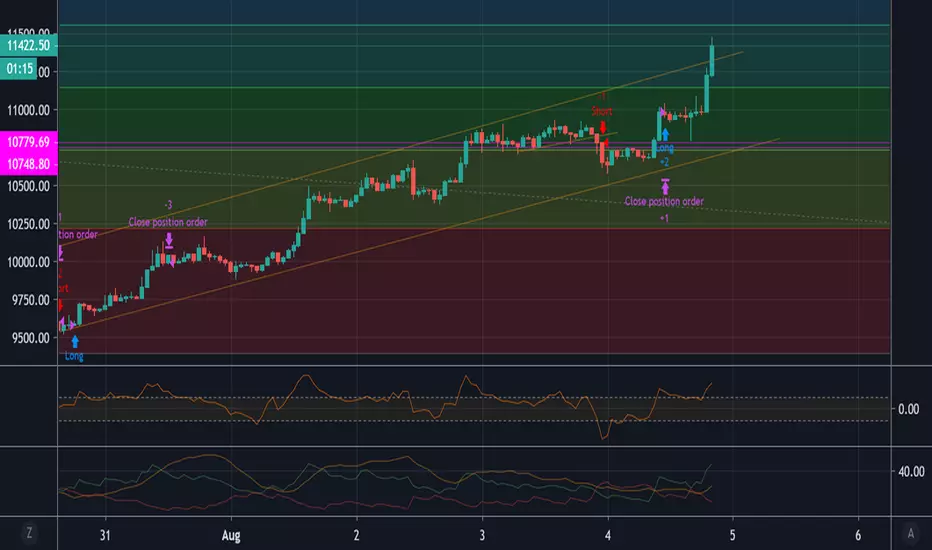
TipTopTraders - #1 Swing Trader Inidicator - 1H+ guaranteed $$$$The specifics of this script are quite simple. Using comparisons of BTC, DXY, and Gold indexes, the MA changes color in the direction of the trend in such a way that you get near-perfect entries and exits.
I've used this new script of mine for the last few months to clock in huge profits in the pump to 12K and the dump down to $9K - refer to chart:
This indicator makes trading so easy, you barely need other confirmations to trade off of it. The higher the time frame the better, but anything below 1 Hour charts can get a bit hairy, in which I would recommend using other contribution indicators for confirmations of trends.
If you want access to this script and everything else currently in development, then please do not hesitate to ask about pricing and membership via a PM.
Thanks!!!!!!!!

JackTrendChaser V3Hi everyone! I am so thrilled to announce this!
>> LIMITED TIME OFFER, read below! <<
My name is Jack and I have been trading trends using TA on Forex for 10 years now and have within the past two years been trading Bitcoin and other cryptocurrencies.
I am a part time trader and developer. On a daily basis I work as a software developer creating various algorythms for big data usage - such as machine learning etc. and I have found a passion in creating scripts to predict major trend moves. Which is why I would like to share this script (strategy) with you all!
Looking at the stats it looks amazing! 100% profitability - who doesn't want that?! But that doesn't mean it cannot be improved - I am daily looking into how I can improve this to become even more profitable.
Currently the script have been tested with BTC and ETH:
BTC = 100% profitability and 9 trades since 2016
ETH = 83% profitability and 6 trades since 2016 with a drawdown of $5.
Now - 9 and 6 trades since 2016 isn't many trades but it suites my way of trading perfectly! I aim for the major trends and try to hit the pullbacks as soon as possible.
You can use this script alone or with other complimenting indicators. I like to draw some support and resistance levels for even further verification.
TRIAL OFFER:
Everyone is offered a 15 days trail.
Let me know in the comments if you would like a trail. Please do not PM me for trails.
>> LIMITED TIME OFFER <<
Since this is my first script to publish on TradingView I am offering the FIRST 10 traders a LIFETIME access to the script for a very small price! After that everyone else will be able to buy acces for 1m, 6m, 1y or lifetime (but at a higher price).
So how do you become one of the first 10?! Simpel - just PM me for the details.
I will update this post when the first 10 has been chosen.
>> OBS: I might be away from TradingView up to 24hours at a time because of my job - but don't panic! I will keep track of every message and get back to everyone as soon as possible!
Best regards
Jack

Maverick - Strategy TesterWelcome to the Maverick - Strategy Tester.
This indicator is used for back-testing. Once you have found settings that you like, you can use my other published indicator "Maverick" to set alerts.
How to use: Apply to any chart, on any time frame. You will see LONG and SHORT signals on the chart. A LONG signal represents an entry/buy in, and a SHORT signal represents an exit/sell.
You can use the Maverick - Strategy Tester to scalp on low time frames such as the 5m, 15m, 30m etc. Or use it on higher time frames such as the 1hr, 2hr, 4hr.
You can use regular candles but Heikin Ashi are recommended for better accuracy.
When using Heikin Ashi, I have included a real price line which shows the actual price of the asset/chart at the close of each candle.
You cannot set alerts with this indicator!
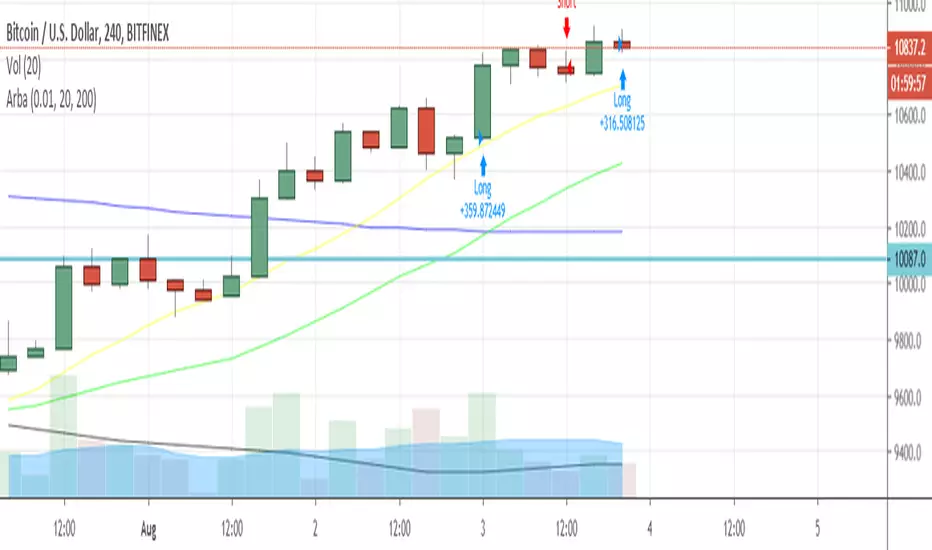
ArbaArba is a trading strategy automation to use in ranges of 4H and D and it may be configured by setting up the ranges of slow simple moving average and fast simple moving average.
The strategy filters in a number of possibilities for possible entries and exits for this specific pair.
You can use it connected to your Poloniex API keys to make automated trading in the above-mentioned timeframes.
3PDivLong
Test 2 : 27 June - 11 July 2019
- 5 m chart (best profit)
- 0.075% commission (Bitmex)
- leverage 1x

kiska clouds backtest editionkiska clouds: crypto twitter's next cloud meme
Crypto is a fast-paced, highly-volatile asset, therefore, many traditional strategies are thrown out of the window when applied to cryptocurrency markets. In trading, there are only two things known for sure: price and volume . Price and volume data is then manipulated using various math equations in an effort to discover patterns and/or make predictions. kiska clouds are no different.
The kiska clouds are a simple crossover strategy. The clouds are different because of the unique averages being used and the embedded momentum indicator .
To use the clouds is simple:
When the green line crosses above the pink line, you buy/long.
When the green line crosses below the pink line, you sell/short.
The clouds are indicative of the trend's momentum. Using the power of math, the larger the cloud indicates a higher amount of buying/selling pressure. As the cloud thins, momentum is slowing, and the trend may be reversing.
At the time of testing, the strategy had a profitability of 54.55% accuracy with 1133.41% net profit. While I think this could be automated into a bot, adding a human element with stop losses and further analysis will significantly improve the accuracy/profitability.
This indicator is the backtest version of the kiska clouds (). For a trial or to purchase this indicator, send me a message on Twitter @moonkiska or here on TradingView. You will be granted a 2-3 day trial period to the backtesting strategy.

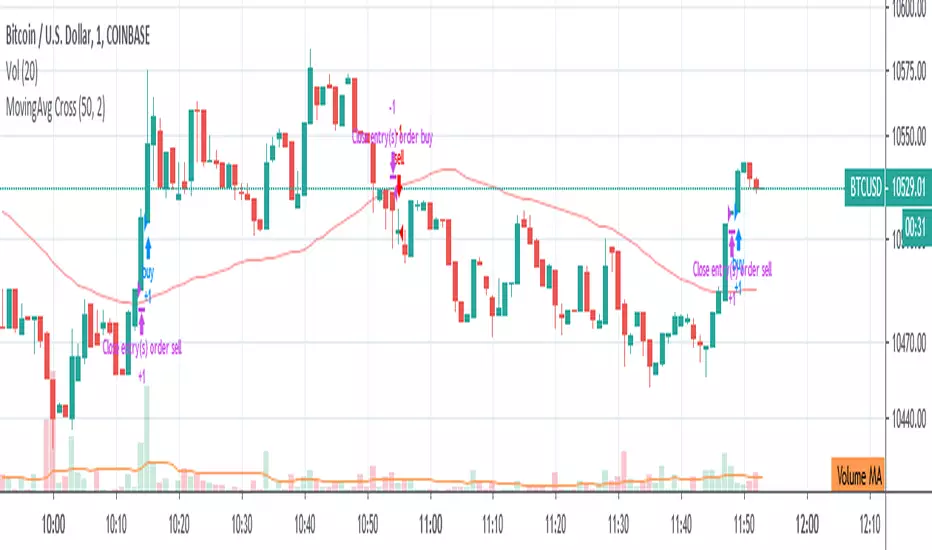
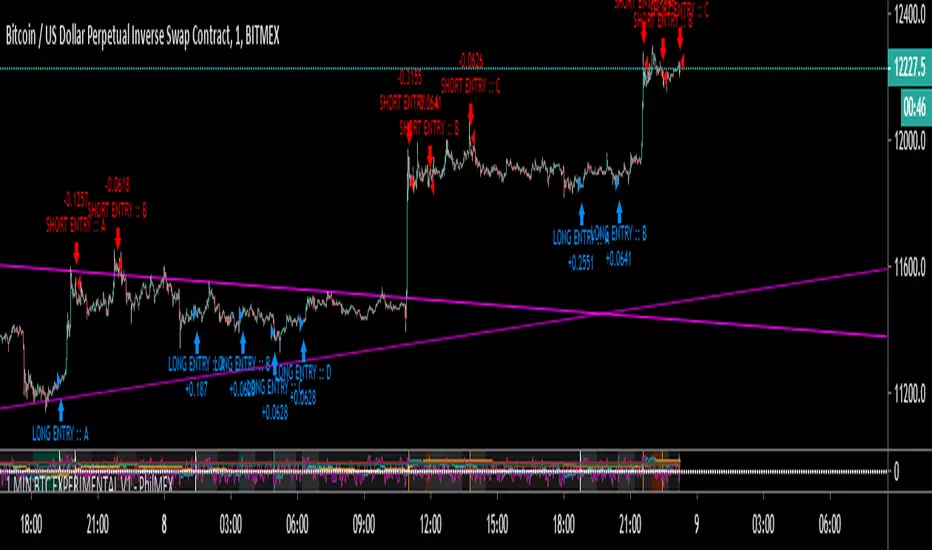
1 MIN BTC EXPERIMENTAL V1 - PhilMEXThis script is intented to work only on 1 minute chart.
It gives very clear signals for buy or sell and has no repainting.
Unfortunatelly I can only test it with the 7 last day due to limit for backtesting.
Do you know guys how can I extend this backtesting time period?
Please use it very carrefully. I'm not responsible for your loss.
If you want updates or more indicators like this one please give me a thumbs up ;)
Cyatophilum Scalping Bot V2 [ADVANCED SETTINGS] [BACKTEST]Advanced Settings version of Cyatophilum Scalping Bot V2
For people who like tweaking settings =)

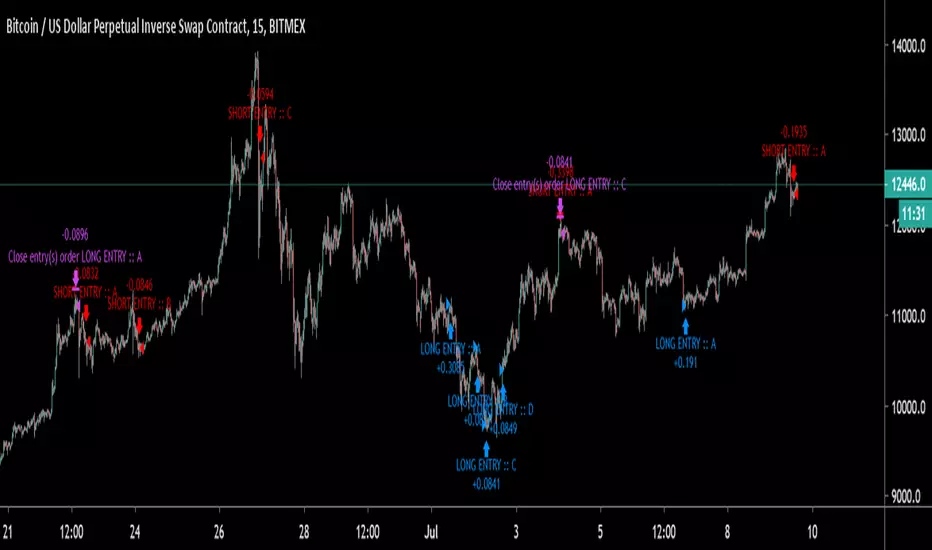
BTC crypto bot indicator 3 MIN - PhilMEXBTC Crypto bot indicator
Can be used on all BTC USD / XBT USD
Must be used on 3 minutes timeframe only
Signals are pretty accurate and this code has no repaint.
Hope this help for your trading and Bitmex.
Some updates may come soon.

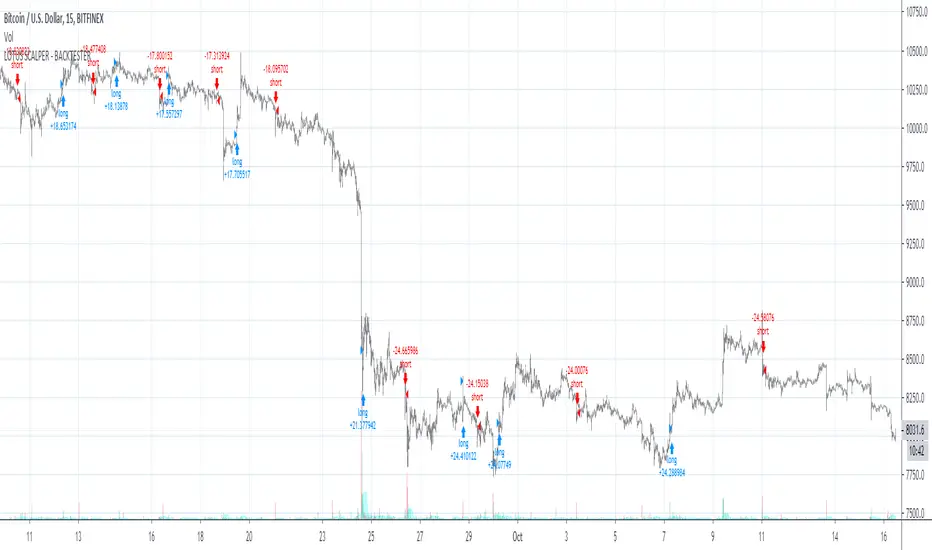
LOTUS BTC TRADERWelcome to the LOTUS BTC TRADER.
How to use:
This indicator only works on the BTC/USD or BTC/USDT 4 hour timeframe! Binance is recommended ( You don't have to trade on the binance chart but it it works best with this indicator).
Bull means the trend is moving up and Bear means the trend is moving down!
Alerts script is separate.

MACD Strategy by ForbesStrategy นี้เขียนขึ้นมาจากบทความของนิตยสารธุรกิจ ชื่อดัง Forbes
สำหรับผู้ที่อยากอ่านสามารถค้นหาได้โดยใช้คำค้นว่า Bitcoin Trading Strategy For Passive Investors
สำหรับผู้ทีจะทอสอบ backtest ให้ตั้งค่า commission (หรือค่าธรรมเนียมการเทรดด้วย) เพื่อให้ผลลัพท์ใกล้เคียงกับความเป็นจริงมากที่สุด
อย่างไรก็ตามจากการ backtest นั้น พบว่า Strategy นี้เหมาะกับ Timeframe Day มากที่สุด และโดยส่วนตัวคิดว่าเหมาะสำหรับการซื้อขายแบบ Spot เท่านั้น

Ema BacktesterA simple, but useful script for backtesting purposes. Find the optimal Settings for your strategy.
tips are always welcome at: 38uGQJDDZDL6wX48x4gYTccPeQ3ZHVYmY4 (btc)
I hope you enjoy the script :)

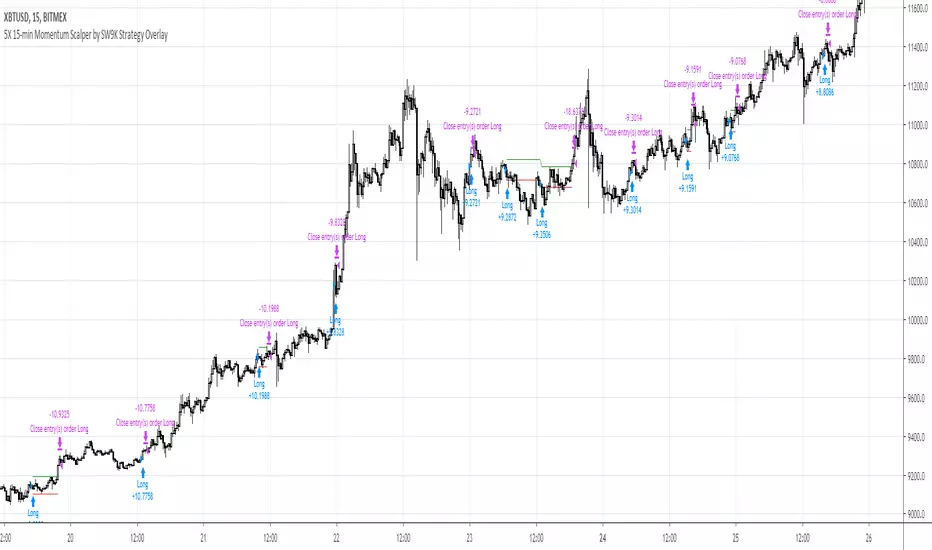
15MEX Momentum Scalper (5X)Working prototype to accurately scalp on the 15 min chart for $XBTUSD pair on BitMex. Designed to let winners run a bit, without any pre-set stop loss. Model is optimized to allow 5X leveraged underwater positions to recover into profitability. Do NOT overleverage with this strategy or you will be liquidated.
Simulated with trades since March 1, 2019, with 100k contract size entries.
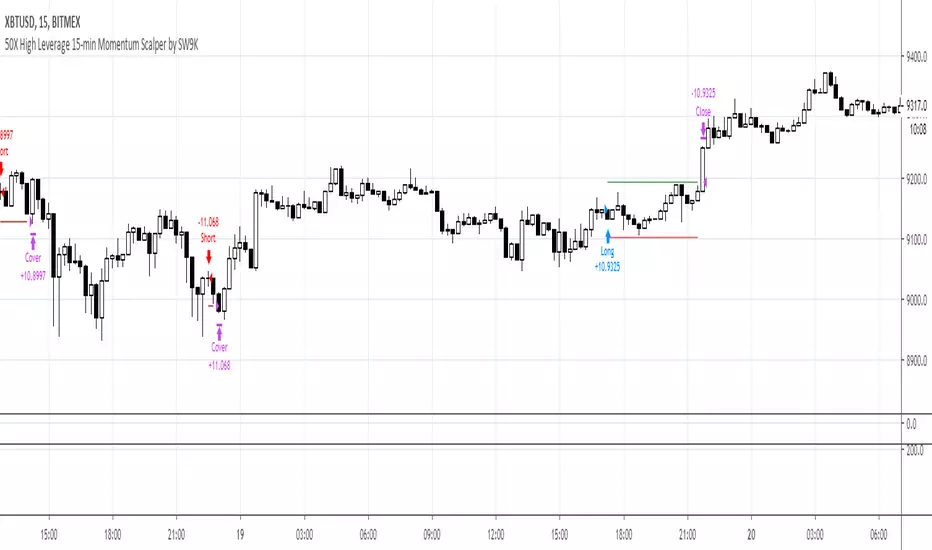
15MEX Momentum ScalperAlpha product project in development. Uses a combination of MACD and T3-CCI with tweaked settings to catch directional momentum and scalp a small move. Strategy is quantity of trades over quality of trades to build profits.
Use this strategy for 15-min Bitmex scalping on XBT contracts only. Recommend 100k contract size or less; backtested with 100k contracts.
Market enter, then use post-only limit exits and stop losses.
Setting is pre-optimized for 0.5% tp target and 0.5% sl of entry price. Recommend default 3 bars as basis for confirming recent MACD crossover as well as default 0.618 Fibonacci ratio as the T3-CCI basis.
Default risk level setting is approximately 2-3 trades a day. You can double the amount to 4-5 trades a day by enabling Aggressive mode. This may lead to larger profits and more entries, but with more frequent stop losses.
Future version will include trailing TPs/stops. Still undergoing optimization and refinement.
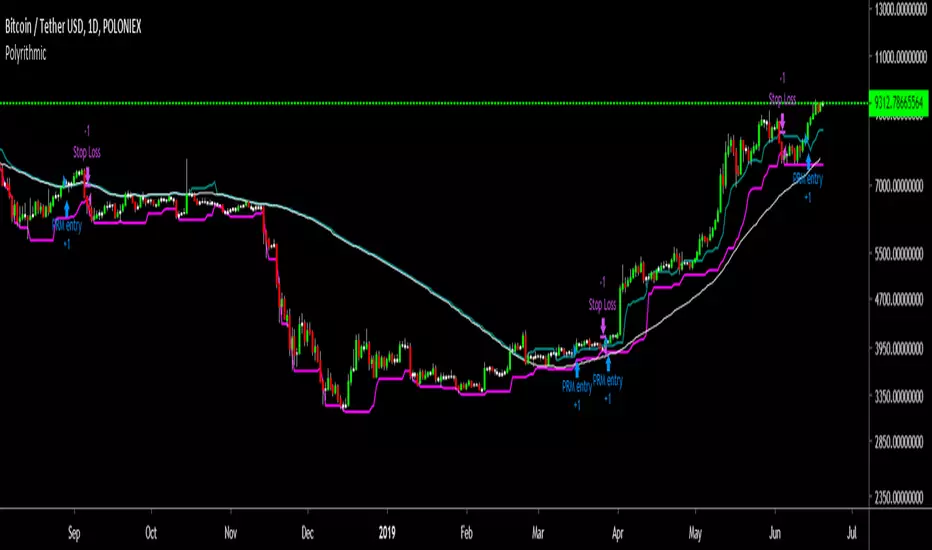
Polyrithmic Trend 2This script is designed to work on cryptocurrency.
This idea is to capture large amounts of the trend but to be able to get out when the support begins to break.
To use this script:
Buy signal:
- When the price is above the white moving average
- When the price goes over the buy line (higher / blue)
- When trading view says buy
Sell signal
- Move a stop up with the pink line and wait to be stopped out
3PDivLong
Test 2 : 31 May - 14 June 2019
- 5 m chart (best profit)
- 0.075% commission (Bitmex)
- max intraday loss = 5%
- leverage 1x
