[MACLEN] TRUE RANGEThis is a true range (TR) based strategy with weighted moving average (WMA) smoothing to remove noise.
In addition, it includes a risk management strategy using 4 "safes" in the same operation to always seek to make a profit.
This is for evaluation only, and it is not recommended to use with real money.
It is a work in progress. I read your comments.
Buscar en scripts para "bitcoin"

Follow the Crypto ShortsThis script allows to test the impact of variations in the number of BTCUSD Shorts Positions on its price. In particular, it compares the number of short positions with its moving average to decide if shorts are being liquidated. In case the number of short positions crosses below its moving average, it will generate a Long Position, which will be closed if shorts crosses above its moving average.

BEAM DCA Strategy MonthlyThis strategy is based on BEAM bands for BTC. The space between the original BEAM bands is broken up into 10 bands representing levels of risk for investing fresh capital.
The strategy will buy bitcoin when the price is in the bottom 5 bands, increasing the amount investmented as the price approaches the 1400 D SMA.
The strategy will limit sell bitcoin when the price is in the top 5 bands, increasing the amount sold as the price approaches the upper BEAM band.
Best used on Daily timeframe and on a chart with history of price data, i.e. INDEX:BTCUSD or BITSTAMP:BTCUSD
To use the strategy:
Set start date
Set day of month to invest
Set the maximum amount to be invested on any given month
Toggle buy/sell orders
Observe the backtest
You can see how the strategy backtests via the information boxes in the bottom right.
There is also functionality to adjust the bands for diminishing returns. Note, this should be used with great skepticism, as the adjustments were made by simple function fitting and not rigorous statistical processes.
That about sums it up! As you can see, even with just a small amount of capital invested at regular intervals can lead to huge realised gains using this version of BEAM bands!

MA Bollinger Bands + RSI This script uses the standard deviation of a given moving average along with an RSI direction.
When: rsi crossover neutral line + price crossover lower deviation boundary => long
When: rsi crossunder neutral line + price crossunder upper deviation boundary => short

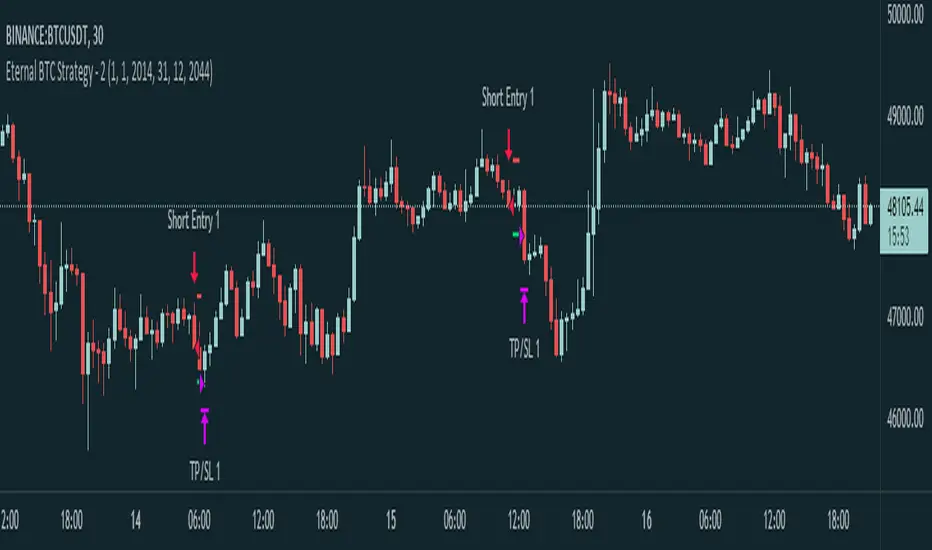
Eternal BTC Strategy - 2This is a summary of how this strategy works.
- Momentum, Volatility detection:
1. First of all detects market momentum
2. Uses volume indicators to make sure of the movement existence
- Trade execution:
3. Uses crossovers of some MAs
4. After crossovers, waits for trend analysis indicators signals to trigger the order
- Take profit & Stop loss:
5. Calculates SL and TP using a formula (combined of volume , MAs and others)
* This is just a simple representation of how this strategy works, It's coded in about a 2000 lines script.
This strategy works best on Bitcoin / TetherUS • BINANCE
No setting is needed to be applied by you, you'll just simply add the script and receive alarms.
Alarms are included opening of the trade, TP and SL touch.
Linear Regression Channel Breakout StrategyThis strategy is based on LonesomeTheBlue's Linear Regression Channel Indicator. First of all, I would like to thank LonesomeTheBlue. Breaking the Linear Regression Channel to close the candle triggers a Long or Short signal. If the slope of the Linear Regression Channel is positive, it is Short when it breaks out the lower line, and when the slope is negative, it is Long when it breaks out the upper line. The default is optimized for 8-hour candles, and for other hour candles, find the optimal value yourself. Below is a description of LonesomeTheBlue's Linear Regression Channel.
이 전략은 LonesomeTheBlue의 Linear Regression Channel Indicator를 기반으로 만들어졌습니다. 우선 LonesomeTheBlue님께 감사의 말씀을 드립니다. Linear Regression Channel을 돌파하여 봉 마감하면 Long 또는 Short 신호를 트리거합니다. Linear Regression Channel의 기울기가 양인 경우 하단 라인을 돌파하면 Short이고 그 기울기가 음인 경우 상단 라인을 돌파하면 Long입니다. 기본값은 8시간봉에 최적화 되어 있으며, 다른 시간봉은 직접 최적값을 찾아보십시오. 아래는 LonesomeTheBlue의 Linear Regression Channel에 대한 설명을 퍼왔습니다.
________________________________________________
There are several nice Linear Regression Channel scripts in the Public Library. and I tried to make one with some extra features too. This one can check if the Price breaks the channel and it shows where is was broken. Also it checks the momentum of the channel and shows it's increasing/decreasing/equal in a label, shape of the label also changes. The line colors change according to direction.
using the options, you can;
- Set the Source (Close, HL2 etc)
- Set the Channel length
- Set Deviation
- Change Up/Down Line colors
- Show/hide broken channels
- Change line width
meaning of arrows:
⇑ : Uptrend and moment incresing
⇗ : Uptrend and moment decreasing
⇓ : Downtrend and moment incresing
⇘ : Downtrend and moment decreasing
⇒ : No trend

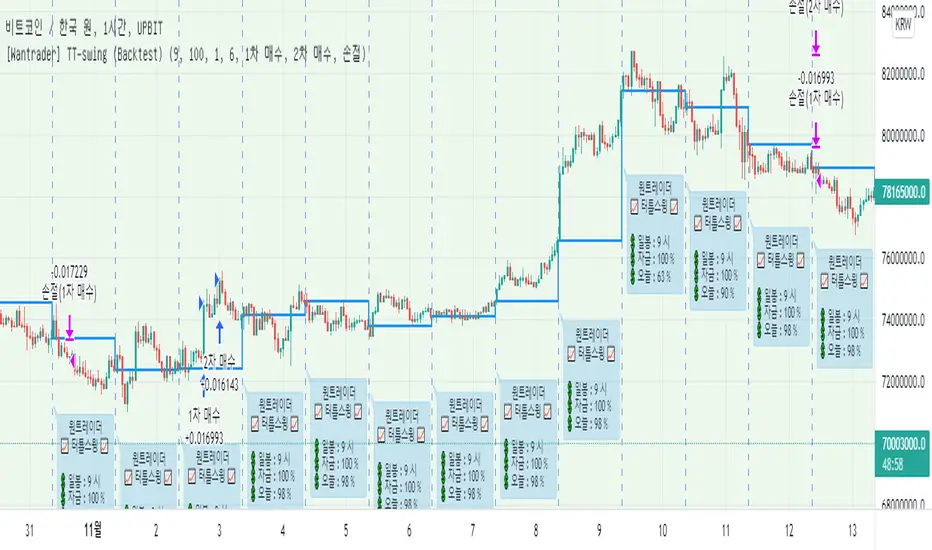
[Wantrader] Turtle Swing Strategy (Backtest)This is the Wantrader's turtle swing strategy.
It's a transformation of Richard Danis' Turtle Trading.
It's the best strategy for and
Please choose 1H time frame
If the date is the future than today, only show you until yesterday
No repaint
"It's a mid-term trend swing strategy."
- Enter a specific standard of reporting price and liquidate it at a new low price.
- It's a long-only strategy without short trade.
- It has high market adaptability in response to market volatility.
- We have minimized over-optimization factors so that they can work well in the future
"The efficiency has been increased by delicate control of entry volume."
- Control losses by managing funds in line with market changes
- Calculate the leverage on the day automatically
- It goes in more when it's advantageous and less when it's disadvantageous
- It's a welfare strategy that works against assets
"We further lowered the risk by cutting off and buying in installments"
- If you deviate from the trend of mid-term price indicators, you will escape.
- It was purchased in installments twice, increasing the confidence of entry
======================================================================
리처드 대니스의 터틀트레이딩을 변형한
원트레이더 터틀 스윙 전략 입니다.
비트코인, 이더리움 에 가장 잘 맞는 전략이며
1H 타임프레임으로 선택해주세요
백테스트 버전은 전일까지만 확인 가능합니다. (당일 진입 확인 불가)
리페인트는 발생하지 않습니다.
"중기 추세 스윙 전략입니다."
- 특정기준의 신고가에 진입, 신저가에 청산합니다.
- 숏은 없는 롱 온리 전략입니다.
- 시장 변동성에 따라 대응하여 시장 적응력이 높습니다.
- 과최적화 요소를 최소화 하여 미래에도 잘 작동 할 수 있도록 만들었습니다.
"섬세한 진입 물량 제어로 효율을 높였습니다."
- 시장 변화에 맞춰 자금관리를 하여 손실을 제어합니다.
- 당일 레버리지를 매일 자동으로 계산합니다.
- 유리할때 더 들어가고, 불리할때 적게 들어갑니다.
- 자산대비로 작동하는 복리 전략입니다.
"손절과 분할매수로 리스크를 더욱 낮췄습니다."
- 중기 가격지표 추세 (모멘텀에 가까움)를 이탈 시 탈출합니다.
- 2회에 걸쳐서 분할매수 하여, 진입 확신도를 높였습니다.
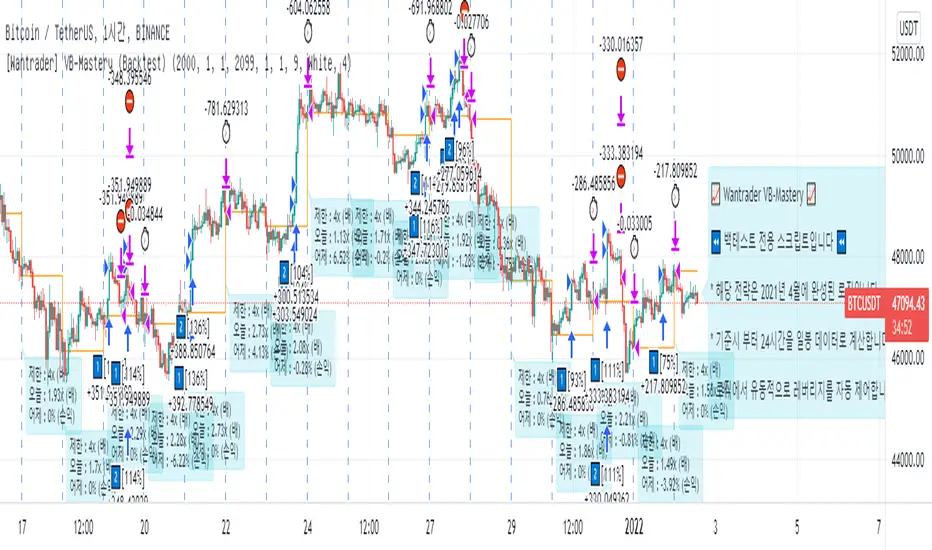
[Wantrader] Volatility Breakout Strategy - Mastery (Backtest)This is the Wantrader's volatility breakthrough version 9,
which developed Larry Williams' volatility breakthrough strategy.
It has been 4 months of development and 8 months of practice.
It's the best strategy for and .
Please choose 1H time frame.
If the date is the future than today, only show you until yesterday.
No repaint.
"As a long-only day trend strategy, we pursue profits in the downward / transverse / rising market."
- It will be exited based on the closing price of the day as a strategy to take only the day trend.
- It's a long-only strategy without short trade.
- It has high market adaptability in response to market volatility.
- We have minimized over-optimization factors so that they can work well in the future.
"The efficiency has been increased by delicate control of entry volume."
- Control losses by managing funds in line with market changes.
- Calculate the leverage on the day automatically.
- It goes in more when it's advantageous and less when it's disadvantageous
- It's a welfare strategy that works against assets
"We further lowered the risk by cutting off and buying in installments."
- If you judge that the trend has declined on the day, you will break off and respond to a sharp drop.
- It was purchased in installments twice, increasing the confidence of entry
========================================================================================
래리윌리엄스의 변동성돌파전략을 발전시킨
원트레이더 변동성돌파 버전9 입니다.
2021년 1월부터 4개월 동안 개발하여
2021년 4월 부터 '8개월 간의 실전테스트 기간을 가졌습니다.'
비트코인, 이더리움 에 가장 잘 맞는 전략이며
1H 타임프레임으로 선택해주세요
백테스트 버전은 전일까지만 확인 가능합니다. (당일 진입 확인 불가)
리페인트는 발생하지 않습니다.
롱 온리 당일 추세 전략으로 하락/횡보/상승 장에서 수익을 추구합니다.
- 당일 추세만 취하는 전략으로 일봉 종가 기준 청산됩니다.
- 숏은 없는 롱 온리 전략입니다.
- 시장 변동성에 따라 대응하여 시장 적응력이 높습니다.
- 과최적화 요소를 최소화 하여 미래에도 잘 작동 할 수 있도록 만들었습니다.
섬세한 진입 물량 제어로 효율을 높였습니다.
- 시장 변화에 맞춰 자금관리를 하여 손실을 제어합니다.
- 당일 레버리지를 매일 자동으로 계산합니다.
- 유리할때 더 들어가고, 불리할때 적게 들어갑니다.
- 자산대비로 작동하는 복리 전략입니다.
손절과 분할매수로 리스크를 더욱 낮췄습니다.
- 당일 추세가 꺾였다고 판단하면 손절하여, 급락에 대응합니다.
- 2회에 걸쳐서 분할매수 하여, 진입 확신도를 높였습니다.
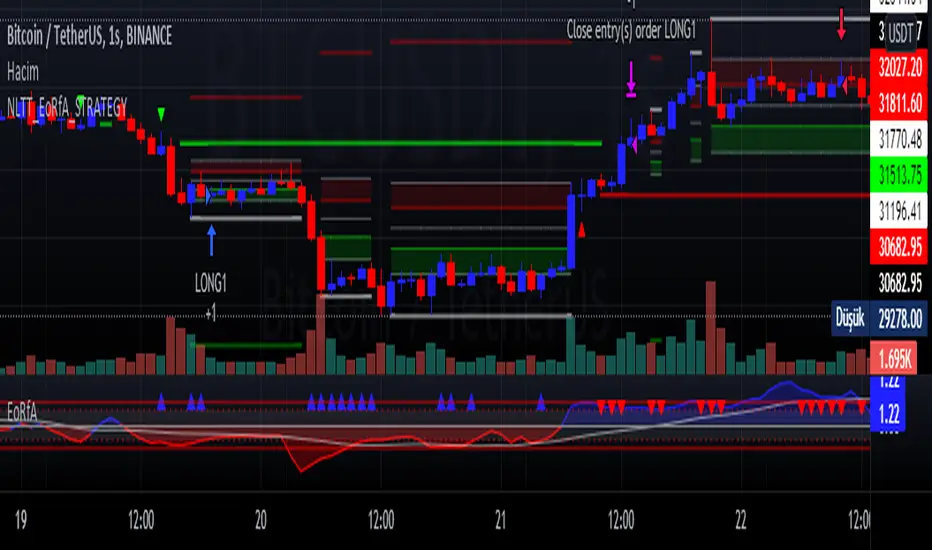
No-lose trading targets (Based on EoRfA) By Mustafa ÖZVERI simulated the NLTTa_EoRfA indicator with the Bitcoin-USD
For details about the indicator, visit my profile on tradingview
For Simulation, with default settings, we order
When on Long setup and price on green area
- open a long position that closes on red area
When on Short setup and price on red area
- open a short position that closes on green area
And we got
- about 15% profit
But only this value can not guarantee good results for trading. BE CAREFUL
Swing Multi Moving Averages Crypto and Stocks StrategySimple and efficient multi moving average strategy combined with risk management and time condition.
Indicators/ Tools used
Multi selection moving average type like SMA , EMA , SMMA , VWMA , VIDYA , FRAMA , T3 and much more
Limit 1 entry max per week, entry on monday exit on sunday or risk management tp/sl.
Rules for entry:
LONG:Close of the candle cross above the moving average while the previous close was below. All of this is happening during monday session.
SHORT:Close of the candle cross below the moving average while the previous close was above. All of this is happening during monday session.
Rules for exit:
We exit either on sunday or if we reach tp/sl levels.
Observations:
I recommend use the strategy 2 types, one for long and another for short, using different parameters since long and short movements behave differently.
For example for long we can use a shorter moving average longth and a higher tp/sl while for short we can use a bigger moving average length and a smaller tp/sl
If you have any questions let me know !

[BTCUSD] Folow Trend & Autotrade Binance FutureCommission = 4 USD per order >>> check in the Performance Summary
Slippage = 2 ticks
- I see from Kodify (tradingview.com/pine-wizards)
Risk: 1% per trade >>> check at the "List of trades"
* Auto trade BINANCE FUTURE by Webhook + Pro, Pro+, Premium Tradingview user.
1. H3 timeframe: Supertrend indicator.
- Long when the closes candle is above Green line.
- Short when the closes candle is below Red line.
2. H1 timeframe: Keltner channels indicator.
* Keltner channels setting:
+ Length = 50
+ Multiplier = 1
+ Use Exponential MA: true
+ Band style: Average true range.
- Long when the close candle crossover the Keltner Upper
- Short when the close candle crossunder the Keltner Lower
3. Entry rule:
Open Buy: Supertrend & Keltner channels are Long. Buy when closes candle crossunder Basis line and closed above Lower Keltner
Open Sell: Supertrend & Keltner channels are Short. Sell when closes candle crossover Basis line and closed below Upper Keltner
4. Stoploss is moving the trend.
Stoploss = Height of Keltner * 1.2.
5. Not repainting
6. Overview result backtesting:
a. Longterm: Every 2 years
2018 to 31/12/2020
2017 to 31/12/2019
2016 to 31/12/2018
2015 to 31/12/2017
2014 to 31/12/2016
2013 to 31/12/2015
2012 to 31/12/2014
b. Midterm: every year.
2020-2021
2019-2020
2018-2019
2017-2018
2016-2017
2015-2016
2014-2015
2013-2014
2012-2013
c. Shorterm:
2020 to today 13/11/2021

Orion Algo Strategy v2.0Hi everyone.
I decided to make the latest Orion Algo open to people. I don't have enough time to work on it lately, so I figured it would be best that everyone can have it to work on it. I took out some stuff from the original but it should give an idea on how things work. I made two strategies with this so far so you can use that to come up with your own. I recommend the DCA strategy because it gives you the most bang for Orion Algo's buck. It's pretty good at finding long entries.
Overall I hope you guys like this one. Also, Banano is the best crypto currency :)
-INFO-
Orion Algo is a trading algorithm designed to help traders find the highs and lows of the market before, during, and after they happen. We wanted to give an indicator to people that was simple to use. In fact we created the algorithm in such a way that it currently only needs a single input from the user. Since no indicator can predict the market perfectly, Orion should be used as just another tool (although quite a sharp one) for you to trade with. Fundamental knowledge of price action and TA should be used with Orion Algo.
Being an oscillator, Orion currently has a bias towards market volatility . So you will want to be trading markets over 30% volatility . We have plans to develop future versions that take this into account and adjust automatically for dead conditions. Also, while there are some similarities across all oscillators, what sets ours apart is the prediction curve. The prediction curve looks at the current signal values and gives it a relative score to approximate tops and bottoms 1-2 bars ahead of the signal curve. We also designed a velocity curve that attempts to predict the signal curve 2+ bars ahead. You can find the relative change in velocity in the Info panel. The bottom momentum wave is based on the signal curve and helps find overall market direction of higher time-frames while in a lower one.
Settings and How to Use them:
User Agreement – Orion Algo is a tool for you to use while trading. We aren’t responsible for losses OR the gains you make with it. By clicking the checkbox on the left you are agreeing to the terms.
Super Smooth – Smooths the main signal line based on the value inside the box. Lower values shift the pivot points to the left but also make things more noisy. Higher values move things to the right making it lag a bit more while creating a smoother signal. 8 is a good value to start with.
Theme – Changes the color scheme of Orion.
Dashboard – Turns on a dashboard with useful stats, such as Delta v, Volatility , Rsi , etc. Changing the value box will move the dashboard left and right.
Prediction – A secondary prediction model that attempts to predict a reversal before it happens (0-2bars). This can be noisy some times so make your best judgement. Curve will toggle a curve view of the prediction. Pivots will toggle bull/bear dots.
∆v – Delta v (change in velocity). This shows momentum of the signal. Crossing 0 signals a reversal. If you see the delta v changing direction, it may signify a reversal in the several bars depending on the overall momentum of the market.
Momentum Wave – Uses the signal as a macro trend indicator. Changes in direction of the wave can signify macro changes in the market. Average will toggle an averaging algorithm of the momentum waves and makes it easy to understand.
-STRATEGIES-
Simple - Just buy and sell on the dots
DCA - Uses the settings in the script for entries. If a buy dot appears then it will buy, if the price goes below the percentage it will wait for another dot before entering. This drastically improves DCA potential.

TripleEMA + StochasticRSI + ATR Scalping Strategy by TradeSmartCOINBASE:BTCUSD Hello everyone and welcome to our second script release!
This script is one of many upcoming scripts. This one is a test for us, how it works, how you guys like this kind of stuff, and for feedback what we should change/improve at.
So feel free to comment any suggestions you have.
SCRIPT IS OPTIMIZED FOR:
BTC/USD (Coinbase) 15 minute timeframe
(Keep in mind default settings does not include trading fees, you can set it at the properties)
I recommend using this script on a trading exchange where the fees are extremely low or on an exchange where you get paid to place limit orders.
(I am not a financial avdvisor and none of this is financial advice.)
Now you can modify the following:
Stochastic RSI
3 different EMA
Length of ATR (for stop loss and take profit)
Stop Loss and Take Profit Risk to Reward ratio
Choice between Capital Risk on each trade or Risk of % of Capital
Allowing Short/Long entries only
Limit between dates
Trading days 1-7
We will update the script with more and more features taking in consideration your requests.
Hope you like it! Don't forget to let us know what we should change or improve. Thanks, and have a great day!
STRATEGY ENTRY RULES
LONG
When EMAs are lining up (meaning for ex. 400 < 13 < 7), and the Stochastic RSI crosses upwards (meaning blue line crosses orange upwards), then go long.
SHORT
When EMAs are lining down (meaning for ex. 7 < 13 < 400), and the Stochastic RSI crosses downwards (meaning blue line crosses orange downwards), then go short.
TAKE PROFIT
When price hits the exit price (calculated from stop loss with the risk ratio)
STOP LOSS
When price hits stop loss then exit the position.
QUANTITY TO BUY (Risk per Trade % or Capital %)
Risk Per Trade % attribute: we can set how much money we want to risk on one trade. Meaning that if we lose that particular position, then a Risk Per Trade % value of our equity will be lost.
Example: if you set the Risk Per Trade % to 1 % and you have a 100$ account balance, then if you loose the trade you will loose 1$ max.
Capital % we can set with how big % of our capital we want to enter into a position. Meaning that we enter with a set % of our capital.
Example: if you set the Capital % to 1 % and you have a 100$ account balance, then you will enter the position with 1$.
First Release Settings: (2021-10-25) for BTC/USD (Coinbase) 15 minute timeframe
Stochastic RSI settings: (Not displayed in the script. If you want to see it you have to add it separately.)
K: 3
D: 2
RSI Length: 6
Stochastic Length: 16
RSI Source: hlc3
EMA 1: 5
Source One: Close
EMA 2: 12
Source Two: Close
EMA 3: 215
Source Three: Close
Length of ATR: 16
Stop Loss Multiplier (risk): 3.6
Exit Price Multiplier (reward): 1
Risk Percentage: 3
Allow Long Entries: yes
Allow Short Entries: yes
Valid Trading Days: 1234567
The valid trading days of the Limit Trading Time feature. Numbers represent the days: Sunday (1), Monday (2), Tuesday (3), …, Saturday (7)
If you like this one, follow for more scripts! Thank you for your support!

supertrend strategyHI,
today I have finished to study another strategy, this time I have done a supertrend with a positive backtest untill 2015 in ETH / BTC pair.
It is very simple to understand and there are only 4 parameters:
The first 2 parameters are about supertrend u can change it as u want.
The last 2 parameters are about trailing stop and target profit, personally I use target 9.6% and trail 8%.
That's all, this is a very simple and profittable strategy.
My personal setting are 4,7,8,9.6
For info write me in private
Please press like, comment or follow :)

[Crypto] DinhChienFX [2 orders]1. Supertrend indicator at Daily timeframe:
- Long trend: the close of candle is above the Green line of Supertrend Indicator.
- Short trend: the close of candle is below the Red line of Supertrend Indicator.
2. Keltner Channels:
- Only buy is above Upper Keltner.
- Only sell is below Lower Keltner.
3. ADX indicator:
- BUY when the ADX indicator crosses 46 + Supertrend is GREEN + Candle's close above Upper Keltner.
- SELL when the ADX indicator crosses 46 + Supertrend is RED + Candle's close below Upper Keltner.
4. Order 2: just active when the Order 1 is opening.
- At the fibonacci retracement 63% ~ Risk/reward 1/1.7
5. Not repaint:
6. Stoploss and Take Profit: risk/reward 1/1.05
- Stoploss = The height of Keltner Channels from lower to upper.
- Take profit = The height of Keltner Channels from lower to upper x 1.05
7. Alert for webhook:
* Historical data with 1 Entry.
- 2013 - 2016:
- 2016 - 2019:
- 2019 to 20/10/2021
---------
Every year:
2013-2014:
2014-2015:
2015-2016:
2016-2017:
2017-2018:
2018-2019:
2019-2020:
2020-2021:
2021-20/10/2021:

[astropark] Trend Skywalker V2 [strategy]Dear Followers,
today I'm glad to present you Trend Skywalker V2 , the evolution of Trend Skywalker V1 indicator that you can see here below:
This indicator works on every timeframe and market, it's quite responsive to market movements, so it's especially good on volatile markets.
In this new version you have 3 trend clouds available :
a short-term one (yellow)
a mid-term one (green)
a long-term one (blue)
You can also enable an option to show all trend clouds as one, the result will be similar to a special bollinger bands tool.
Of course you can edit trend clouds analysis period and color, also you can turn on or off the cloud that you prefer.
The indicator can run 4 different kinds of strategy : one for each trend cloud individually or a mixed one.
Also the indicator tracks for you a peak profit from entry: this tracker is a suggestion for you to take profits while price goes up!
All red-green circles you see in the chart is a reminder that a peak profit label was there in the past: what does this tell you?
if price starts losing the short-term trend and you had a lot of TP suggestions, maybe trend ended and you should start consider closing your trade before you give back all your profit.
On backtesting you can you test long and short setups individually or both, as well as performance in a specific time window.
This is a premium indicator , so send me a private message in order to get access to this script.

Bagheri IG Ether v2In this version, the winning ratio has been decreased, but the Risk to Reward Ratio (RRR) has been set to be better than the previous version.
This is a technical trading strategy for Ethereum ( BINANCE:ETHUSDT ). We built and developed it on MetaEditor and optimized it with MetaTrader optimizer.
The main indicators are Donchian Channel, Oscillator of ROC , Bears Power, Balance of Power , and Simple Moving Average ( SMA ). Default values in the input panel are the best combination of these indicators, but you can change any of them and try it for better results.
Please notice that this strategy has been optimized on the 1-minute chart of Ethereum .
For each position, you can see the Take Profit (TP) and Stop Loss (SL) levels. Also, you can find the values of mentioned TP and SL in points from the input panel of the script.
Attention: The price of Ethereum has 2 decimal places.
Therefore, 3000 points for TP means 30 USDT for trading 1 BINANCE:ETHUSDT .

RSI+CMO Hybrid StrategyThis strategy is based on the RSI+CMO Hybrid Index I created. I modified both the original RSI and CMO so that the RSI+CMO Index value ranges from -100 to +100 and defined as follows. When the RSI+CMO Hybrid Index values close above the Bull Level and below the Bear Level, the strategy will trigger long and short signals respectively. This newly defined hybrid RSI+CMO indicator showed better win rates and better profits than the original CMO strategy. The default setting for this strategy is optimized for an 8-hour candle. For candles at different times, try to find the optimal value yourself.
* I was going to open the script, but recently there was a case of stealing my script and publishing it without permission, so I decided not to disclose it.
▶ Modified RSI = Original RSI - 50
Therefore,
Original RSI (0 ~ 100) → Modified RSI (-50 ~ +50)
▶ Modified CMO = Original CMO * 0.5
Therefore,
Original CMO (-100 ~ +100) → Modified CMO (-50 ~ +50)
▶ RSI+CMO Hybrid Index = Modified RSI + Modified CMO
Therefore,
RSI+CMO Hybrid Index (-100 ~ +100)
________________________________________________________
이 전략은 기존의 RSI와 CMO 지표를 수정하여 새롭게 정의한 하이브리드 RSI+CMO 지표를 기반으로 만들어졌습니다. 지표 값의 범위가 -100에서 100의 범위를 가질 수 있도록 기존의 RSI와 CMO를 수정하여 만들었습니다. RSI+CMO Hybrid Index 값이 Bull Level 이상과 Bear Level 아래에서 봉마감을 하면 이 전략은 각각 롱과 숏 신호를 트리거합니다. 이렇게 새롭게 정의된 RSI+CMO 지표는 기존 CMO 전략 대비 승률과 수익이 더 우수합니다. 이 전략의 세팅 기본값은 8시간봉에 최적화 되어있습니다. 다른 시간대 봉에서는 최적값을 직접 찾아보십시오. 그리고 이전략은 RSI+CMO Hybrid Index와 함께 사용하면 Long과 Short 신호를 예측할 수 있어 편리합니다.
* 최근에 제 스크립트를 도용/표절하여 무단으로 퍼블리쉬한 사례가 발생하여 더 이상 스크립트는 공개하지 않기로 하였습니다.

MACD + DMI Scalping with Volatility Stop by (Coinrule)Trend-following strategies are cool because they allow you to catch potential high returns.
The main limit of such strategies are:
False signals > the asset is not experiencing a strong trend. The strategy gets stuck with a sideways move or, worst, with the beginning of a downtrend.
The sell signal may come later than the actual top, leading in some cases to turn a trade in profit into a loss.
This strategy tries to address these limitations to develop a trading system that optimises the entry and closes trade once the profit achieves a pre-set level.
ENTRY
The trading system uses the MACD and the DMI to confirm when is the best time for buying. Combining these two indicators prevents trading during downtrends and reduces the likelihood of getting stuck in a market with low volatility.
The system confirms the entry when:
The MACD histogram turns bullish.
When the positive DMI is greater than the negative DMI, there are more chances that the asset is trading in a sustained uptrend.
EXIT
The strategy comes with a fixed take profit combined with a volatility stop, which acts as a trailing stop to adapt to the trend's strength. Depending on your long term confidence in the asset, you can edit the fixed take profit to be more conservative or aggressive.
The position is closed when:
The price increases by 3%
The price crosses below the volatility stop.
The best time frame for this strategy based on our backtest is the 3-hr . The 4-hr can work well. In general, this approach suits medium to long term strategies
The strategy assumes each order to trade 30% of the available capital to make the results more realistic. A trading fee of 0.1% is taken into account. The fee is aligned to the base fee applied on Binance, which is the largest cryptocurrency exchange.

WEEKLY BTC TRADING SCRYPTWeekly BTC Trading Scrypt(WBTS)
This script is only suggested for cryptocurrencies and weekly buying strategy which is long term.Using it in another markets(e.g forex,stock,e.t.c) is not suggested. The thing makes it different than other strategies we try to understand bull and bear seasons and buying selected crypto currency as using formula if weekly closing value crossover eight weeks simple moving avarage buy,else if selected crypto currency's weekly closing value crossunder eight weeks simple avarage sell. Eight week moving avarage is also uses weekly closing prices but for being able to use this strategy ,trading pair must have more than eight candles in weekly chart otherwise the 8 weeks simple moving avarage value cannot be calculated and script does not work.
This script has a chart called WBTS and it has following features:
Strategy group consist of 3 inputs:
1)Source: Close by default. Our whole strategy uses close values. You can change it but not suggested.
2)Loss Ratio: Because of the cases like the circumstances that manipulates market or high volatility , sometimes graphic show wrong buying signals and this ratio saves user from big money looses(Note : This ratio will always work when selling condition occurs to make user take his profit or prevent him to loss more money because of a wrong positive comes from the indicator.)
3)Reward Ratio : When selling condition happens it will exit user with more profit(if price is already higher than buying point) otherwise it will dimunish loss a bit(if user is below of buying point) or prevents looses(if user is in buying point when selling condition happened.
MA group consist of 2 inputs:
COLOR:Specifies color of the moving avarage.It is equal to #FF3232by hex color code by default.
LINE WIDTH: Specifies linewidth of the moving avarage. It is 2 by default.
GRAPHIC group consist of 2 inputs:
COLOR: It specifies the color of the line which consist of weekly closing prices. It is equal to #6666FF hex color code by default.
LINE WIDTH: Specifies linewidth of the line which consist of weekly closing prices. It is 2 by default.
STRATEGY EXECUTION YEAR: It will show the orders,profits and looses done by script after the input year giving in it.It is 2020 by default.
The last feature is strategy equity,it is not in one of these groups. User should click on settings button on the WBTS indicator than chose Style section and there is a deactivated check box near in the plot section if user activate it, the equity line will show in indicator's graph.
Logic of This Strategy:The story of this strategy began when I studied BTC's price movement from 2020 to today with 8 weeks simple moving avarage (it takes weekly closes as source) and weekly clossing values. I understood that there was a perfect interest between bull and bear market and following conditions:
buy_condition=crossover(weekly_closing_values,8_week_simple_moving_avarage)
sell_condition=crossover(weekly_closing_values,8_week_simple_moving_avarage)
and I tried same thing on the same and bigger time frames("for example i studied how the strategy works from the beginning to today with bitcoin and what is our final equity") with bitcoin and other cryptocurrencies and this made me saw better the relation between giving conditions and general market psychology, however I also witnessed some wrong positives coming by script and used a risk reward ratio to save user and set risk reward ratio 1/3 after a research.
For both conditions(buy_condition and sell_condition),when they are realised,script will alert users and an order will be triggered.
Before finishing the description,from settings/properties/ user can set initial capital,base currency,order size and type,but it is 100000 for initial_amount and 1 contract for order size by default.
In backtesting I used the options like the following example :
Initial capital=1000
Base_curreny=USD
Order size=40 USD
Properties place must set different by every single user according to his or her capital and order size must not be higher than his total money because this script is not the best or a good script for derivatives. It is only written for long term-crypto spot trading and I strongly recommend to users that margin may cause bad results and please do not use it with any margin or any market different than crypto market.
Thank you very much for reading)

Dual MACD StrategyThis strategy Multi Time Frame Macd Indicator
We take the first long position when we have a buy signal in Weekly Macd (Macd line crosses above Signal line). This open a trading window, showed with green background color
We close the first position when either Weekly or Daily Macd give us a sell signal ((Macd line crosses below Signal line))
Enable Profit and Stop in strategy settings with different percentage to backtest the strategy. Also if it is better to use a Traditional Stop Loss or a Trailing Stop Loss based on a percentage from low prices
Change macd resolution in settings for other time frames to test the strategy
This Strategy was tested on Crypto Market with good results in assets as BTC, ETH, BNB, ADA, LTC, XLM, BCH, among others

Traffic Lights Strategy4HS Crypto Market Strategy
This strategy uses 4 ema to get Long or Short Signals
Length are: 4, 9, 18, 100
We take long positions when the order of the emas is the following:
green > yellow > red (As the color of Traffic Lights) and they are above white ema (Used as a filter for long positions)
We take short positions when the order of the emas is the following:
green < yellow < red (As the color of inverse Traffic Lights) and they are below white ema (Used as a filter for short positions)
Enable Long and/or Short Positions in settings
Enable Profit and Stop in strategy settings with different percentage to backtest the strategy. Also if it is better to use a Traditional Stop Loss or a Trailing Stop Loss based on ATR
Change ema filter resolution in settings for better strategy performance
This Strategy was tested on Crypto Market with good results in assets as BTC, ETH, BNB, ADA, LTC, XLM, BCH, among others
Feel free to optimize this strategy, optimizing its parameters. Each asset has its own "personality".

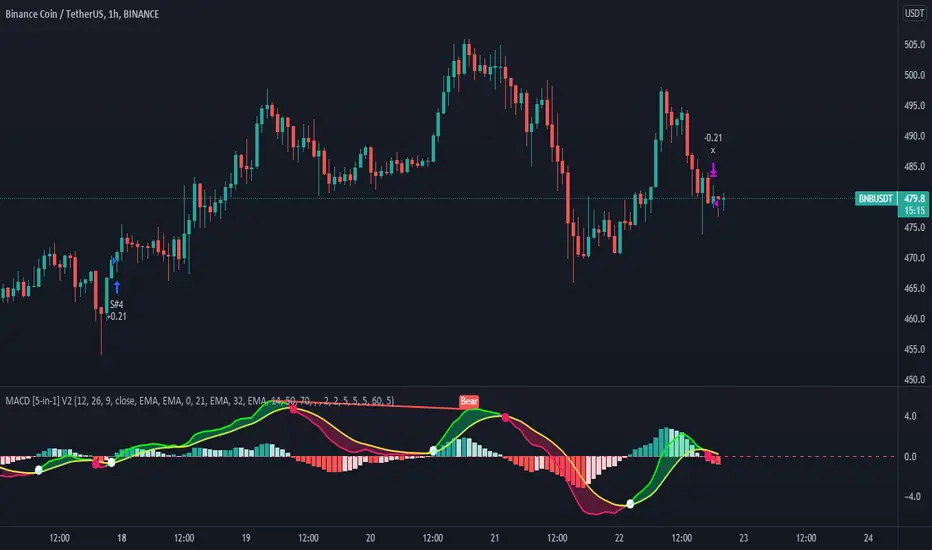
MACD 5 iN 1 [Pro-Tool]introducing MACD Which has different indicators inside,
And not only that, five different strategies have also been included in this indicator.
Strategy №1:👉 MACD Crossover Signal Line
Strategy №2:👉 MACD Crossover + MACD Overbought Section (for ignore false Crossover signals)
Strategy №3:👉 MACD Crossover + Market Close should b greater tha MOVING AVERAGE
Strategy №4:👉 MACD Crossover + Market Close should b greater tha MOVING AVERAGE ZONE
Strategy №5:👉 MACD Crossover + RSI Close should b greater tha 50 Level (or whatever level you choose)
also 5 types of MOVING AVERAGE you can choose
1: Simple Moving Average ( SMA )
2: Exponential Moving Average ( EMA )
3: Weighted Moving Average ( WMA )
4: Volume Weighted Moving Average ( VWMA )
5: Relative Moving Average (RMA)
and you can customize MACD Colors + Widths + Signals and MACD lines, and also can Hide or Unhide Histogram / Cross Sign / MACD Zone Color
hope so you like it, 🥰
Investing and trading in cryptocurrencies is very risky, as anything can happen at any time.
***NOT FINANCIAL, LEGAL, OR TAX ADVICE! JUST OPINION! I AM NOT AN EXPERT! I DO NOT GUARANTEE A PARTICULAR OUTCOME I HAVE NO INSIDE KNOWLEDGE! YOU NEED TO DO YOUR OWN RESEARCH AND MAKE YOUR OWN DECISIONS! THIS IS JUST EDUCATION & ENTERTAINMENT! USE ALTCOIN DAILY AS A STARTING OFF POINT!