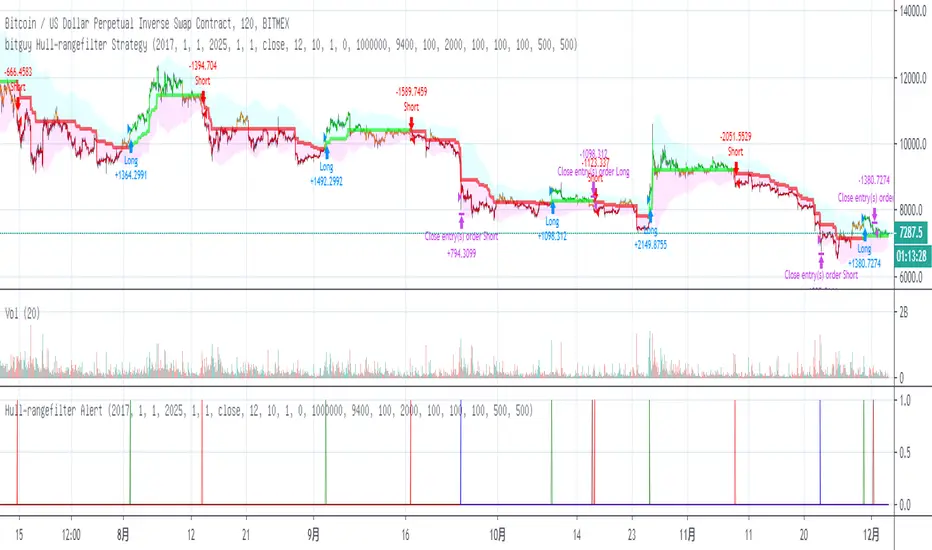
BITMEX Bybit binance BTC ETH HR TREND strategyBITMEX Bybit binance Bitfinex Coinbase OKCOIN BTC ETH HR TREND strategy
This is a very effective trend strategy.
Strategy principle
HOW TO USE
set long position when a green arrow appears in the chart.
set short position when a red arrow appears in the chart.
For the long position and the short direction, you can set the stop profit & stop loss or trailing profit stop & trailing stop loss respectively.
When a purple arrow appears to close a position, an aggressive trader can go in the opposite direction when it is purple.
Strategy applicability
The default setting is for bitmex perpetual swap contract XBTUSD , bybit BTCUSD perpetual futures contract ,binance btcusdt Spot,Bitfinex BTCUSD Spot,bitflyer BTCJPY Spot,bithumb BTCKRW Spot,bitso BTCMXN Spot, bitstamp BTCUSD Spot,bittrex BTCUSDT Spot,Coinbase BTCUSD spot, deribit BTCPERP perpetual futures contract,gemini BTCUSD Spot,Hitbit BTCUSDT Spot,huobi BTCUSDT Spot KRAKEN XBTUSD spot,OKCOIN OKEX BTCUSD3M BTCUSD BTCUSD2W,Poloniex BTCUSDT Spot etc btc symbol with 30 minutes timeframe.
This indicator has broad applicability and can be applied to multiple different symbols.
This indicator also applies to the ETHUSD symbol etc, just adjust the default configuration.
Using the alert of the indicator, it can work well on the trading robot like Gunbot,autoview, without repaint false signals.
这是非常有效的趋势策略。
如何使用
在图表中出现绿色线就做多。
在图表中出现红色线就做空。
对于多头头寸和空头方向,您可以分别设置止损和止损或尾随利润止损和尾随止损;当出现紫色箭头时平仓,激进的交易者,可以在紫色时就做反方向。
策略适用性
默认设置是针对bitmex交易所 XBTUSD永久掉期合约,BYBIT交易所 BTCUSD永续期货合约,binance币安交易所 btcusdt现货,Bitfinex交易所 BTCUSD现货,bitflyer交易所 BTCJPY现货,bithumb交易所 BTCKRW现货,bitso交易所 BTCMXN现货,bitstamp交易所 BTCUSD现货,bittrex交易所 BTCUSDT现货,Coinbase交易所 BTCUSD现货,deribit交易所 BTCPERP永续期货合约,gemini双子星交易所 BTCUSD现货,Hitbit交易所 BTCUSDT现货,huobi火币交易所 BTCUSDT现货,KRAKEN交易所 XBTUSD现货,OKCOIN OKEX交易所 BTCUSD3M OK BTC季度合约 BTCUSD BTCUSD2W OK BTC次周合约,Poloniex BTCUSDT现货等2小时区间的btc交易。
Bitmex XBTUSD 89分钟 比特币期货 89 minutes Bitcoin Futures
Bitmex XBTUSD 2H 比特币现货 2 hours Bitcoin Futures
Bitmex XBTUSD 1小时 比特币期货 1 hour Bitcoin Futures
Bybit BTCUSD 1小时 比特币合约 1 hour Bitcoin Futures
binance BTCUSDT 1H 比特币现货 1 hours Bitcoin Spot
这个指标具有广泛的适用性,可以适用多个不同交易品种。
该指标还适用于ETHUSD交易品种等,只需调整默认配置即可。
Bitmex ETHUSD 1小时 以太币合约 1H ETHUSD Futures
Binance ETHUSD 1小时 以太币现货 1H ETHUSD Spot
Bybit ETHUSD 1小时 以太币合约 1H ETHUSD Futures
使用该指标的警报设置,它可以在自动交易机器人上很好地工作,而无重绘错误的信号。
Buscar en scripts para "bitcoin"
BITMEX Bybit binance Bitfinex OKCOIN BTC ETH TREND strategyBITMEX Bybit binance Bitfinex Coinbase OKCOIN BTC ETH TREND strategy
This is a very effective trend strategy.
Strategy principle
HOW TO USE
set long position when a green arrow appears in the chart.
set short position when a red arrow appears in the chart.
For the long position and the short direction, you can set the stop profit & stop loss or trailing profit stop & trailing stop loss respectively.
When a purple arrow appears to close a position, an aggressive trader can go in the opposite direction when it is purple.
Strategy applicability
The default setting is for bitmex perpetual swap contract XBTUSD , bybit BTCUSD perpetual futures contract ,binance btcusdt Spot,Bitfinex BTCUSD Spot,bitflyer BTCJPY Spot,bithumb BTCKRW Spot,bitso BTCMXN Spot, bitstamp BTCUSD Spot,bittrex BTCUSDT Spot,Coinbase BTCUSD spot, deribit BTCPERP perpetual futures contract,gemini BTCUSD Spot,Hitbit BTCUSDT Spot,huobi BTCUSDT Spot KRAKEN XBTUSD spot,OKCOIN OKEX BTCUSD3M BTCUSD BTCUSD2W,Poloniex BTCUSDT Spot etc btc symbol with 30 minutes timeframe.
This indicator has broad applicability and can be applied to multiple different symbols.
This indicator also applies to the ETHUSD symbol etc, just adjust the default configuration.
Using the alert of the indicator, it can work well on the trading robot like Gunbot,autoview, without repaint false signals.
这是非常有效的趋势策略。
如何使用
在图表中出现绿色箭头就做多。
在图表中出现红色箭头就做空。
对于多头头寸和空头方向,您可以分别设置止损和止损或尾随利润止损和尾随止损;当出现紫色箭头时平仓,激进的交易者,可以在紫色时就做反方向。
策略适用性
默认设置是针对bitmex交易所 XBTUSD永久掉期合约,BYBIT交易所 BTCUSD永续期货合约,binance币安交易所 btcusdt现货,Bitfinex交易所 BTCUSD现货,bitflyer交易所 BTCJPY现货,bithumb交易所 BTCKRW现货,bitso交易所 BTCMXN现货,bitstamp交易所 BTCUSD现货,bittrex交易所 BTCUSDT现货,Coinbase交易所 BTCUSD现货,deribit交易所 BTCPERP永续期货合约,gemini双子星交易所 BTCUSD现货,Hitbit交易所 BTCUSDT现货,huobi火币交易所 BTCUSDT现货,KRAKEN交易所 XBTUSD现货,OKCOIN OKEX交易所 BTCUSD3M OK BTC季度合约 BTCUSD BTCUSD2W OK BTC次周合约,Poloniex BTCUSDT现货等2小时区间的btc交易。
Bitmex XBTUSD 30分钟 比特币期货 30 minutes Bitcoin Futures
Bitfinex BTCUSD 30分钟 比特币现货 30 minutes Bitcoin Spot
Bybit BTCUSD 30分钟 比特币合约 30 minutes Bitcoin Futures
OKEX BTCUSD2M 30分钟 比特币次周合约 30 minutes Half a month Bitcoin Futures
Bitmex XBTUSD 2H 比特币现货 2 hours Bitcoin Futures
binance BTCUSDT 2H 比特币现货 2 hours Bitcoin Spot
Bybit BTCUSD 2H 比特币期货 2 hours Bitcoin Futures
这个指标具有广泛的适用性,可以适用多个不同交易品种。
该指标还适用于ETHUSD交易品种等,只需调整默认配置即可。
Bitmex ETHUSD 30 以太币合约
Bybit ETHUSD 30分钟合约
OKCOIN ETHUSD3W 30分钟季度合约
Bitmex ETHUSD 2H 以太币合约
Bybit ETHUSD 2H 以太币合约
HUOBI ETHUSD 2H 火币以太币现货
使用该指标的警报设置,它可以在自动交易机器人上很好地工作,而无重绘错误的信号。

Strategy to accumulate ADA Cardano cryptocurrency
This strategy was specifically developed for short ADA cryptocurrency operations in the ADA / BITCOIN pair.
Instructions:
- The strategy should be used on the daily chart of ADABTC;
- Entries should only be made from 21:00 in Brazil time zone;
- When the arrow indicates sale you should sell your ADAs to repurchase at a lower price, so you will be increasing your ADA quantity;
- When the arrow indicates "recomprar" you must repurchase the ADAs you sold on the sell signal given by the indicator;
- Use good risk management when using this strategy, avoid applying more than 50% of your ADAs to operations;
- A estratégia não possui um stop de perca. A saida de operações com prejuizo deve ser feita quando o indicador mandar recomprar as ADAs;
- When the ADA goes into a bullish trend this indicator performance may turn out to be bad, so the trader should be aware of possible developments that make the ADA appreciate against bitcoin.
Performance Information:
- First, it is important to note that there is no guarantee that past performance will continue in the future, so it is important that you do good risk management;
- The strategy was able to have a hit rate of over 60% on the daily chart between 2018 and October 2019. This means that with each operation you are more than 60% likely to have more ADAs.
- The largest loss occurred during the historical track tested was 4.72%, ie, those who entered the unsuccessful operation left with 4.72% less ADAs at the end of the operation;
- The operation with the highest profit in the series studied gave 90% return, that is, those who entered the operation almost doubled the equity in ADAs.

Market Structure Finder [Dzenis]This indicator is designed to help you visualize the high timeframe market structure breaks and shifts in trend.
It finds local swing highs and lows, and defines the market structure based on them.
Break above the blue line = market structure is bullish, look for long/buy
Break below the red line = market structure is bearish, look for short/sell
I wrote it as a strategy so it can be easily backtested, giving a more complete picture of its effectiveness for catching larger swings.
It works best in trending markets such as Bitcoin.
This specific backtesting strategy and buy/sell signals on the chart are meant for trading the spot markets.
Buy signal triggers the entry with 70% of the trading capital (can be adjusted in the indicator menu and backtested with different percentages).
Sell signal exits the position.
The results assume 0.1% trading fees by default (adjustable in the menu as well).
It does not repaint.
If trading the futures markets it can be used purely as an indicator to help you form a HTF bullish/bearish bias and look for trade setups accordingly.
Although it's not designed for intraday moves, it can be used on lower timeframes as well.
8h timeframe for swing trades.
1h timeframe for intraday setups.
Daily timeframe is still the suggested and main use of this indicator (forming high timeframe bias).
For any questions and inquiries, feel free to DM me.

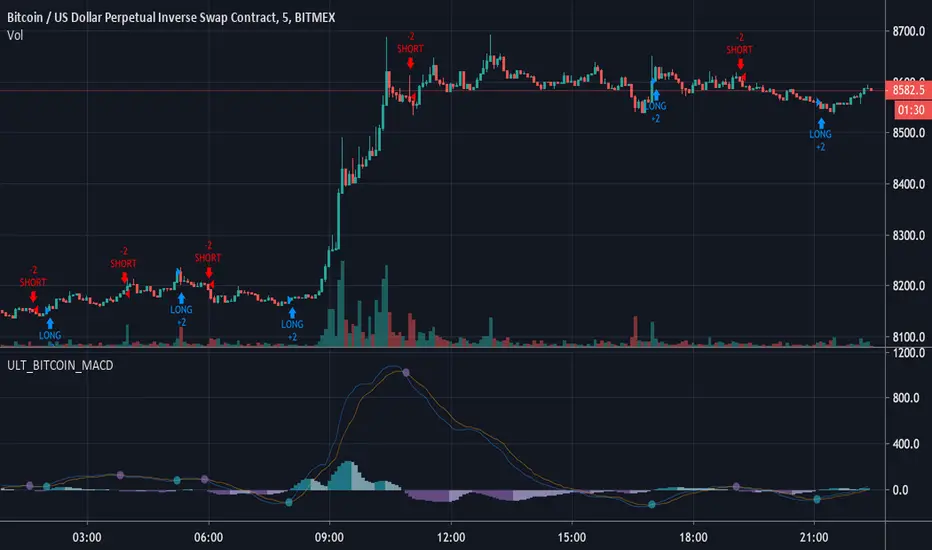
ULT_BITCOIN_MACDUltimate Bitcoin MACD aggregates macd, signal, and histograms across all USD bitcoin exchanges. The result is the most accurate look at bitcoin price action.
WARNING:
1. can have long load times to aggregate data
2. Only functional on USD based bitcoin assets
ck - CryptoSniper (Strategy) v2.1This strategy is radically different to the v1 script previously released.
It has ***NO REPAINTING*** - as such the algorithm had to change to remove it’s reliance on HMAs from future timeframes to establish trend, this is now accomplished with EMAs.
It is completely written in Pinescript v4.
It has integrated Stoploss and you can plot this & with the recommended Entry on the chart.
WARNING - This strategy has to be “tuned” to the instrument you are trading, for example, Bitcoin. The default settings work well for BTC/USD, XBT/USD on 15m chart timeframe but not for ETH/USD - it is possible the default settings will work with other crypto’s but I haven’t had time to test - if you find good settings PLEASE share them!
How to use:
1) Load up your favourite chart/instrument and select your favourite timeframe
2) Adjust the “signal” EMA and “baseline” EMA settings until you get the majority of uptrending moves highlighted with a green background and the majority of downtrending moves with a red background. The signal has to be faster (that is a lower number) than the baseline.
3) Adjust the “Sensitivity” - this will plot more green & orange Trigger points on the chart.
The strategy waits until in a trend, for example, a Long (green background) then waits for first green cross before opening a deal. It will Trigger a sell if the background turns red (downtrend) and a orange cross is printed.
4) Fine tuning:
A) Increase your profits by changing the Stoploss value - getting this right protects you from bad trades but also resets the indicator to provide another alert faster
B) You can increase the delay positions are opened or closed with the “Bar(s) offset to open position” and “Bar(s) offset to close position” settings. When you adjust these, 0 will buy/sell immediately when a Trigger cross is printed, 2 will wait until 2 bars/candles AFTER the Trigger cross prints to strat/close a position.
TIP: When adjusting indicator settings, load your chart and timeframe first.
Add the indicator/strategy (if you haven’t already).
Click the Strategy Tester tab at the bottom of the chart window so it is visible.
Open the strategy/indicator settings so you can see this wind AND the Strategy Tester display
Change a setting and click into a different setting input box, this will update the test results WITHOUT closing the settings window! This will save you a lot of time!
Write down any OK settings you find, you can come back later to fine tune them!
Please provide any feedback & let’s share the best settings for different crypto’s!
Moving Average Strategy of BiznesFilosofWhat is brilliant is simple! Therefore, this strategy works very well. It is configured on bitcoin. But you can use it for other tools. Only need to change the settings.
Remember that this is not a panacea, but only an assistant! You yourself have to choose which entry and exit points to choose.
In more detail about strategy on my channel in YouTube.
===
Что гениально, то просто! Потому, эта стратегия очень хорошо работает. Настроена она на биткоин. Но можно использовать и для других инструментов. Только нужно поменять настройки.
Помните, что это не панацея, а только помощник! Вы сами должны панимать, какие выбирать точки входа и выхода.
Более подробно про стратегию на моём канале в Ютуб.

E-Z's Slither Maker Strategy v0.01This is a strategy I built based on custom MACD and ADX/DMI settings.
Works best for scalping the one hour.
If you run into any issues let me know.
If this script makes you money and feel thankful for all my hard work, you can donate to the addresses below <3
BTC: 3CS6VqDrCf7XRn46bqcXMUZQecbQJ7TKfs
BCC/BCH: bitcoincash:qqrca9z7w2gl2wevjvry6uv7quhcn7kaycx43r34tf
DOGE: AC9tZB6NMoWpvMZmmtop5yXsv7GhHYAxWd
LTC: 34HajDFE3aDWgs1etG3851CLvqNV9pg5Te
Trend Follower Strategy (Long Only)Adjusted for Bitcoin.
Long position only.
10% of your balance each time.
Tight stop loss.
Reasonable profit-loss ratio.
Positive return every year.
No repaint.

Buy & Sell by Cypher Crypto Signals
Cypher Crypto Signals
+++ Affordable Altcoin Signals with High Success rate and Constant BTC Analysis+++
Trading Signals for All major Exchanges | Bitcoin Analysis
You can purchase crypto currency coins or tokens for the long run, Just buy and hold them for a broader timeframe. This is more an investment than trading.
You can trade cryptocurrency coins or tokens for short to medium terms, Which means you buy undervalued or outbreaking assets, hold them until a projected target price has been hit and sell them against Bitcoin, USD or Tether. This indicator analyze the Bitcoin and Altcoin markets and provide you with signals on what to buy, at a particular price, and when to sell it again. You will use exchanges like Binance, and the only way to profit is at an increased price of the purchased asset.
You can use a Mercantile Exchange like Bitmex to day trade Bitcoin and few other altcoins. Here you can long (you anticipate an increasing price), or you can go short (you anticipate a decreasing price), which means you can trade bi-directional and profit from price movements in both directions. Additionally, you can leverage your trades up to 100x, which increases the risk significantly but also the gains can be much higher.
Note:- This indicator work Excellent in all timeframes excluding 1 Day timeframe.
Disclaimer :- This indicator is for educational purposes only. We are no financial advisors. Do not make investment decisions based on this informations. The information provided from Cypher Crypto Signals is for informational purposes only. It should not be considered legal or financial advice. You should consult with a financial advisor or other professional to find out what may be best for your individual needs and risk tolerance. Please do your own research and let never anyone trade for you. Please read this Disclaimer and leave the Indicator if you disagree with it.
UniHiLo<설정값>
3시간봉
비트코인. p1=5, p2=1
이더리움. p1=12, p2=3
3hour.
bitcoin. p1=5, p2=1
ethereum. p1=12, p2=3
Indicator for Alert :

Guided144Algorithm conditions suggested by a friend, works best on daily tf for bitcoin.
simple cycle trading of buy and sell..
A great guide for trading those complicated moves.

Cryptopeep v1 StrategyAfter an long time of testing this is by far the best strategy i can create for bitcoin.

CPG - Institutional Premium Arbitrage SystemConcept & Logic:
This strategy captures institutional sentiment by analyzing the Cross-Exchange Arbitrage Data between Coinbase (USD pair) and Binance (USDT pair). Instead of using raw price difference which is noisy, this script employs a Proprietary Dynamic Threshold Algorithm. It normalizes the premium data using a custom volatility-adjusted window to filter out retail noise and identify genuine "Whale Accumulation" zones.
Key Features:
Data Source: Real-time BTC/USD vs BTC/USDT spread analysis.
Signal Filtering: The proprietary algorithm (closed-source logic) dynamically adjusts upper and lower bands to prevent false signals during low liquidity periods.
Execution:
Bullish: When the premium breaks the dynamic upper threshold (Strong Institutional Buying).
Bearish: When the premium drops below the dynamic lower threshold (Institutional Selling).
Usage:
Note: The dynamic threshold algorithm is specifically calibrated for Bitcoin's unique liquidity structure. Extensive backtesting shows that this logic is NOT suitable for altcoins (like ETH or SOL). Please strictly use it on BTC pairs.
策略核心:
本策略透過分析 Coinbase (USD) 與 Binance (USDT) 之間的跨交易所資金流 (Arbitrage Data),來捕捉機構投資者的動向。 原始的價差數據通常充滿雜訊,因此本腳本內建了一套**「獨家動態閥值演算法」**。該算法能對數據進行平滑處理與正規化,有效過濾市場雜訊,精準識別出機構大戶的資金流向。
功能特點:
數據源: 即時運算 BTC/USD 與 BTC/USDT 的溢價差。
獨家過濾: 閉源的動態演算法會根據波動率自動調整上下軌閥值,避免假突破。
交易訊號:
看多: 溢價突破動態上軌(機構強力買入)。
看空: 溢價跌破動態下軌(機構拋售)。
用法:
注意: 本策略的動態閥值演算法是針對比特幣的流動性結構進行嚴格校準的。回測數據顯示,此邏輯不適用於 ETH 或 SOL 等其他幣種。請務必僅在 BTC 圖表上使用。

9 EMA Trend-Flow StrategyThis strategy avoids trading inside the noise and waits for Bitcoin to "coil up" before exploding.
1. Chart Setup
Timeframe: 5 Minutes
Bollinger Bands: Length 20, Standard Deviation 2 (Default).
RSI (Relative Strength Index): Length 14.
EMA (Exponential Moving Average): Length 200 (Trend Filter).
2. The Rules
Long Setup (Buy)
The Trend Filter: Price must be above the 200 EMA.
The Squeeze: The Bollinger Bands must visually contract (narrow), indicating volatility is dying down.
The Trigger: A 5m candle closes strongly above the Upper Bollinger Band.
Confirmation: RSI must be rising and above 50 (but ideally not yet "pegged" at 90+).
Short Setup (Sell)
The Trend Filter: Price must be below the 200 EMA.
The Squeeze: The Bollinger Bands contract.
The Trigger: A 5m candle closes strongly below the Lower Bollinger Band.
Confirmation: RSI must be falling and below 50.
Execution Guide
Entry Technique
Don't enter immediately when the candle touches the band. Wait for the candle close.
Why? Bitcoin frequently "wicks" through bands to trap traders (fakeouts) before reversing. A solid close outside the band confirms momentum.
Exit Strategy (Take Profit)
Target 1 (Conservative): Close 50% of the position when price expands to a fixed risk-reward ratio (e.g., 1.5R).
Target 2 (Runner): Keep the remaining position open as long as price "walks the band" (stays outside or touching the outer band). Close the rest when a candle finally closes back inside the Bollinger Bands.
Stop Loss
Placement: Place your Stop Loss (SL) slightly below the Middle Band (the 20 SMA) at the time of entry.
Trailing: As the price moves in your favor, move your SL to trail the Middle Band.

Tailwind.(BTC)Imagine the price of Bitcoin is like a person climbing a staircase.
The Steps (Grid): Instead of watching every single price movement, the strategy divides the market into fixed steps. In your configuration, each step measures **3,000 points**. (Examples: 60,000, 63,000, 66,000...).
The Signal: We buy only when the price climbs a full step decisively.
The "Expensive Price" Filter: If the price jumps the step but lands too far away (the candle closes too high), we do not buy. It is like trying to board a train that has already started moving too fast; the risk is too high.
Rigid Exits: The Take Profit (TP) and Stop Loss (SL) are calculated from the edge of the step, not from the specific price where you managed to buy. This preserves the geometric structure of the market.
The Code Logic (Step-by-Step)
A. The Math of the Grid (`math.floor`)
pinescript
level_base = math.floor(close / step_size) * step_size
This is the most important line.
What does it do? It rounds the price down to the nearest multiple of 3,000.
Example: If BTC is at 64,500 and the step size is 3,000:
1. Divide: $64,500 / 3,000 = 21.5$
2. `math.floor` (Floor): Removes the decimals $\rightarrow$ remains $21$.
3. Multiply: $21 * 3,000 = 63,000$.
Result: The code knows that the current "floor" is **63,000**, regardless of whether the price is at 63,001 or 65,999.
B. The Strict Breakout (`strict_cross`)
pinescript
strict_cross = (open < level_base) and (close > level_base)
Most strategies only check if `close > level`. We do things slightly differently:
`open < level_base`: Requires the candle to have "born" *below* the line (e.g., opened at 62,900).
`close > level_base`: Requires the candle to have *finished* above the line (e.g., closed at 63,200).
Why? This avoids entering on gaps (price jumps where the market opens already very high) and confirms that there was real buying power crossing the line.
C. The "Expensive Price" Filter (`max_dist_pct`)
pinescript
limit_price_entry = level_base + (step_size * (max_dist_pct / 100.0))
price_is_valid = close <= limit_price_entry
Here you apply the percentage rule:
-If the level is 63,000 and the next is 66,000 (a difference of 3,000).
-If `max_dist_pct` is **60%**, the limit is $63,000 + (60\% \text{ of } 3,000) = 64,800$.
-If the breakout candle closes at **65,000**, the variable `price_is_valid` will be **false** and it will not enter the trade. This avoids buying at the ceiling.
D. TP and SL Calculation (Anchored to the Level)
pinescript
take_profit = level_base + (step_size * tp_mult)
stop_loss = level_base - (step_size * sl_mult)
Note that we use `level_base` and not `close`.
-If you entered because the price broke 63,000, your SL is calculated starting from 63,000.
-If your SL is 1.0x, your stop will be exactly at 60,000.
This is crucial: If you bought "expensive" (e.g., at 63,500), your real stop is wider (3,500 points) than if you bought cheap (63,100). Because you filter out expensive entries, you protect your Risk/Reward ratio.
E. Visual Management (`var line`)
The code uses `var` variables to remember the TP and SL lines and the `line.set_x2` function to stretch them to the right while the operation remains open, providing that visual reference on the chart until the trade ends.
Workflow Summary
Strategy Parameters:
Total Capital: $20,000
We will use 10% of total capital per trade.
Commissions: 0.1% per trade.
TP: 1.4
SL: 1
Step Size (Grid): 3,000
We use the 200 EMA as a trend filter.
Feel free to experiment with the parameters to your liking. Cheers.

Monarch Strategies BTC Optimized Cycle & Trend Strategy (1W)The "BTC Optimized Cycle & Trend Strategy (1W)" is a high-quality, long-term optimized trading strategy for BTC/USD, designed for traders and investors who want to systematically trade major market cycles — without overtrading, without emotions, and without unnecessary complexity.
The strategy is specifically built for the weekly timeframe (1W) and focuses on what Bitcoin has historically done best: strong, multi-year trend movements.
Optimized BTC Mean Reversion (RSI 20/65)📈 Optimized BTC Mean Reversion (RSI 20/65)
Optimized BTC Mean Reversion (RSI 20/65) is a rule-based trading strategy designed to capture mean-reversion moves in strong market structures, primarily optimized for Bitcoin, but adaptable to other liquid cryptocurrencies.
The strategy combines RSI extremes, Stochastic momentum, and EMA trend filtering to identify high-probability reversal zones while maintaining strict risk management.
🔍 Strategy Logic
This system focuses on entering trades when price temporarily deviates from equilibrium, while still respecting the broader trend.
✅ Long Conditions
RSI below 20 (oversold)
Stochastic below 25
Price trading above the 200 EMA (or within a controlled deviation)
Designed to buy sharp pullbacks in bullish conditions
❌ Short Conditions
RSI above 65 (overbought)
Stochastic above 75
Price trading below the 200 EMA
Designed to sell relief rallies in bearish conditions
🛡 Risk Management
Fixed Stop Loss: 4%
Fixed Take Profit: 6%
Risk/Reward: 1 : 1.5
No pyramiding (single position at a time)
Full equity position sizing (adjustable)
All exits are predefined at entry, ensuring consistency and emotional discipline.
📊 Indicators Used
200 EMA – Trend direction filter
RSI (14) – Mean-reversion trigger (20 / 65 levels)
Stochastic Oscillator – Momentum confirmation
👁 Visual Features
EMA plotted directly on chart
Real-time Stop Loss, Take Profit, and Entry Price lines
Clear long/short entry markers
Works on all timeframes (optimized for intraday and swing trading)
🔔 Alerts
Long entry alerts
Short entry alerts
(Perfect for automation or discretionary execution)
⚠️ Disclaimer
This strategy is intended for educational and research purposes only. Past performance does not guarantee future results. Always test on a demo account and adjust risk parameters to your own trading plan.

Gyspy Bot Trade Engine - V1.2B - Strategy 12-7-25 - SignalLynxGypsy Bot Trade Engine (MK6 V1.2B) - Ultimate Strategy & Backtest
Brought to you by Signal Lynx | Automation for the Night-Shift Nation 🌙
1. Executive Summary & Architecture
Gypsy Bot (MK6 V1.2B) is not merely a strategy; it is a massive, modular Trade Engine built specifically for the TradingView Pine Script environment. While most strategies rely on a single dominant indicator (like an RSI cross or a MACD flip) to generate signals, Gypsy Bot functions as a sophisticated Consensus Algorithm.
The engine calculates data from up to 12 distinct Technical Analysis Modules simultaneously on every bar closing. It aggregates these signals into a "Vote Count" and only executes a trade entry when a user-defined threshold of concurring signals is met. This "Voting System" acts as a noise filter, requiring multiple independent mathematical models—ranging from volume flow and momentum to cyclical harmonics and trend strength—to agree on market direction before capital is committed.
Beyond entries, Gypsy Bot features a proprietary Risk Management suite called the Dump Protection Team (DPT). This logic layer operates independently of the entry modules, specifically scanning for "Moon" (Parabolic) or "Nuke" (Crash) volatility events to force-exit positions, overriding standard stops to preserve capital during Black Swan events.
2. ⚠️ The Philosophy of "Curve Fitting" (Must Read)
One must be careful when applying Gypsy Bot to new pairs or charts.
To be fully transparent: Gypsy Bot is, by definition, a very advanced curve-fitting engine. Because it grants the user granular control over 12 modules, dozens of thresholds, and specific voting requirements, it is extremely easy to "over-fit" the data. You can easily toggle switches until the backtest shows a 100% win rate, only to have the strategy fail immediately in live markets because it was tuned to historical noise rather than market structure.
To use this engine successfully, you must adopt a specific optimization mindset:
Ignore Raw Net Profit: Do not tune for the highest dollar amount. A strategy that makes $1M in the backtest but has a 40% drawdown is useless.
Prioritize Stability: Look for a high Profit Factor (1.5+), a high Percent Profitable, and a smooth equity curve.
Regular Maintenance is Mandatory: Markets shift regimes (e.g., from Bull Trend to Crab Range). Parameters that worked perfectly in 2021 may fail in 2024. Gypsy Bot settings should be reviewed and adjusted at regular intervals (e.g., quarterly) to ensure the voting logic remains aligned with current market volatility.
Timeframe Recommendations:
Gypsy Bot is optimized for High Time Frame (HTF) trend following. It generally produces the most reliable results on charts ranging from 1-Hour to 12-Hours, with the 4-Hour timeframe historically serving as the "sweet spot" for most major cryptocurrency assets.
3. The Voting Mechanism: How Entries Are Generated
The heart of the Gypsy Bot engine is the ActivateOrders input (found in the "Order Signal Modifier" settings).
The engine constantly monitors the output of all enabled Modules.
Long Votes: GoLongCount
Short Votes: GoShortCount
If you have 10 Modules enabled, and you set ActivateOrders to 7:
The engine will ONLY trigger a Buy Entry if 7 or more modules return a valid "Buy" signal on the same closed candle.
If only 6 modules agree, the trade is rejected.
This allows you to mix "Leading" indicators (Oscillators) with "Lagging" indicators (Moving Averages) to create a high-probability entry signal that requires momentum, volume, and trend to all be in alignment.
4. Technical Deep Dive: The 12 Modules
Gypsy Bot allows you to toggle the following modules On/Off individually to suit the asset you are trading.
Module 1: Modified Slope Angle (MSA)
Logic: Calculates the geometric angle of a moving average relative to the timeline.
Function: It filters out "lazy" trends. A trend is only considered valid if the slope exceeds a specific steepness threshold. This helps avoid entering trades during weak drifts that often precede a reversal.
Module 2: Correlation Trend Indicator (CTI)
Logic: Based on John Ehlers' work, this measures how closely the current price action correlates to a straight line (a perfect trend).
Function: It outputs a confidence score (-1 to 1). Gypsy Bot uses this to ensure that we are not just moving up, but moving up with high statistical correlation, reducing fake-outs.
Module 3: Ehlers Roofing Filter
Logic: A sophisticated spectral filter that combines a High-Pass filter (to remove long-term drift) with a Super Smoother (to remove high-frequency noise).
Function: It attempts to isolate the "Roof" of the price action. It is excellent at catching cyclical turning points before standard moving averages react.
Module 4: Forecast Oscillator
Logic: Uses Linear Regression forecasting to predict where price "should" be relative to where it is.
Function: When the Forecast Oscillator crosses its zero line, it indicates that the regression trend has flipped. We offer both "Aggressive" and "Conservative" calculation modes for this module.
Module 5: Chandelier ATR Stop
Logic: A volatility-based trend follower that hangs a "leash" (ATR multiple) from the highest high (for longs) or lowest low (for shorts).
Function: Used here as an entry filter. If price is above the Chandelier line, the trend is Bullish. It also includes a "Bull/Bear Qualifier" check to ensure structural support.
Module 6: Crypto Market Breadth (CMB)
Logic: This is a macro-filter. It pulls data from multiple major tickers (BTC, ETH, and Perpetual Contracts) across different exchanges.
Function: It calculates a "Market Health" percentage. If Bitcoin is rising but the rest of the market is dumping, this module can veto a trade, ensuring you don't buy into a "fake" rally driven by a single asset.
Module 7: Directional Index Convergence (DIC)
Logic: Analyzes the convergence/divergence between Fast and Slow Directional Movement indices.
Function: Identifies when trend strength is expanding. A buy signal is generated only when the positive directional movement overpowers the negative movement with expanding momentum.
Module 8: Market Thrust Indicator (MTI)
Logic: A volume-weighted breadth indicator. It uses Advance/Decline data and Up/Down Volume data.
Function: This is one of the most powerful modules. It confirms that price movement is supported by actual volume flow. We recommend using the "SSMA" (Super Smoother) MA Type for the cleanest signals on the 4H chart.
Module 9: Simple Ichimoku Cloud
Logic: Traditional Japanese trend analysis using the Tenkan-sen and Kijun-sen.
Function: Checks for a "Kumo Breakout." Price must be fully above the Cloud (for longs) or below it (for shorts). This is a classic "trend confirmation" module.
Module 10: Simple Harmonic Oscillator
Logic: Analyzes the harmonic wave properties of price action to detect cyclical tops and bottoms.
Function: Serves as a counter-trend or early-reversal detector. It tries to identify when a cycle has bottomed out (for buys) or topped out (for sells) before the main trend indicators catch up.
Module 11: HSRS Compression / Super AO
Logic: Two options in one.
HSRS: Hirashima Sugita Resistance Support. Detects volatility compression (squeezes) relative to dynamic support/resistance bands.
Super AO: A combination of the Awesome Oscillator and SuperTrend logic.
Function: Great for catching explosive moves that result from periods of low volatility (consolidation).
Module 12: Fisher Transform (MTF)
Logic: Converts price data into a Gaussian normal distribution.
Function: Identifies extreme price deviations. This module uses Multi-Timeframe (MTF) logic to look at higher-timeframe trends (e.g., looking at the Daily Fisher while trading the 4H chart) to ensure you aren't trading against the major trend.
5. Global Inhibitors (The Veto Power)
Even if 12 out of 12 modules vote "Buy," Gypsy Bot performs a final safety check using Global Inhibitors. If any of these are triggered, the trade is blocked.
Bitcoin Halving Logic:
Hardcoded dates for past and projected future Bitcoin halvings (up to 2040).
Trading is inhibited or restricted during the chaotic weeks immediately surrounding a Halving event to avoid volatility crushes.
Miner Capitulation:
Uses Hash Rate Ribbons (Moving averages of Hash Rate).
If miners are capitulating (Shutting down rigs due to unprofitability), the engine flags a "Bearish" regime and can flip logic to Short-only or flat.
ADX Filter (Flat Market Protocol):
If the Average Directional Index (ADX) is below a specific threshold (e.g., 20), the market is deemed "Flat/Choppy." The bot will refuse to open trend-following trades in a flat market.
CryptoCap Trend:
Checks the total Crypto Market Cap chart. If the broad market is in a downtrend, it can inhibit Long entries on individual altcoins.
6. Risk Management & The Dump Protection Team (DPT)
Gypsy Bot separates "Entry Logic" from "Risk Management Logic."
Dump Protection Team (DPT)
This is a specialized logic branch designed to save the account during Black Swan events.
Nuke Protection: If the DPT detects a volatility signature consistent with a flash crash, it overrides all other logic and forces an immediate exit.
Moon Protection: If a parabolic pump is detected that violates statistical probability (Bollinger deviations), DPT can force a profit take before the inevitable correction.
Advanced Adaptive Trailing Stop (AATS)
Unlike a static trailing stop (e.g., "trail by 5%"), AATS is dynamic.
Penthouse Level: If price is at the top of the HSRS channel (High Volatility), the stop loosens to allow for wicks.
Dungeon Level: If price is compressed at the bottom, the stop tightens to protect capital.
Staged Take Profits
TP1: Scalp a portion (e.g., 10%) to cover fees and secure a win.
TP2: Take the bulk of profit.
TP3: Leave a "Runner" position with a loose trailing stop to catch "Moon" moves.
7. Recommended Setup Guide
When applying Gypsy Bot to a new chart, follow this sequence:
Set Timeframe: 4 Hours (4H).
Reset: Turn OFF Trailing Stop, Stop Loss, and Take Profits. (We want to see raw entry performance first).
Tune DPT: Adjust "Dump/Moon Protection" inputs first. These have the highest impact on net performance.
Tune Module 8 (MTI): This module is a heavy filter. Experiment with the MA Type (SSMA is recommended).
Select Modules: Enable/Disable modules 1-12 based on the asset's personality (Trending vs. Ranging).
Voting Threshold: Adjust ActivateOrders. A lower number = More Trades (Aggressive). A higher number = Fewer, higher conviction trades (Conservative).
Final Polish: Re-enable Stop Losses, Trailing Stops, and Staged Take Profits to smooth the equity curve and define your max risk per trade.
8. Technical Specs
Engine Version: Pine Script V6
Repainting: This strategy uses Closed Candle data for all Risk Management and Entry decisions. This ensures that Backtest results align closely with real-time behavior (no repainting of historical signals).
Alerts: This script generates Strategy alerts. If you require visual-only alerts, see the source code header for instructions on switching to "Study" (Indicator) mode.
Disclaimer:
This script is a complex algorithmic tool for market analysis. Past performance is not indicative of future results. Use this tool to assist your own decision-making, not to replace it.
9. About Signal Lynx
Automation for the Night-Shift Nation 🌙
Signal Lynx focuses on helping traders and developers bridge the gap between indicator logic and real-world automation. The same RM engine you see here powers multiple internal systems and templates, including other public scripts like the Super-AO Strategy with Advanced Risk Management.
We provide this code open source under the Mozilla Public License 2.0 (MPL-2.0) to:
Demonstrate how Adaptive Logic and structured Risk Management can outperform static, one-layer indicators
Give Pine Script users a battle-tested RM backbone they can reuse, remix, and extend
If you are looking to automate your TradingView strategies, route signals to exchanges, or simply want safer, smarter strategy structures, please keep Signal Lynx in your search.
License: Mozilla Public License 2.0 (Open Source).
If you make beneficial modifications, please consider releasing them back to the community so everyone can benefit.

BTC Dynamic Volatility Trend Backtested from 2017 to present, this strategy has delivered a staggering 7100%+ cumulative return. It doesn't just track the market; it dominates it. By capturing major trends and strictly limiting drawdowns, it has significantly outperformed the standard 'Buy & Hold' BTC strategy, proving its ability to generate massive alpha across multiple bull and bear cycles.
自 2017 年至今,本策略实现了惊人的 7100%+ 累计收益率。它不仅仅是跟随市场,更是超越了市场。通过精准捕捉主升浪并严格控制回撤,该策略在穿越多轮牛熊周期后,大幅度跑赢了比特币‘买入持有’(Buy & Hold)的基准收益,展现了极致的阿尔法(Alpha)捕捉能力。"
Introduction :Simplicity is the ultimate sophistication. This strategy is designed specifically for Bitcoin (BTC), capturing its unique characteristics: high volatility, frequent fakeouts, and massive trend persistence. It abandons complex indicators in favor of a robust logic: "Follow the Trend, Filter the Noise, Let Profits Run."
Core Logic
Trend Filter (Fibonacci EMA 144): We use the 144-period Exponential Moving Average as the baseline. Longs are only taken above this line, and shorts only below. This keeps you on the right side of the major trend.
Volatility Breakout (Donchian Channel 20): Entries are triggered only when price breaks the 20-day high (for longs) or low (for shorts). This confirms momentum and avoids trading in chop.
Dynamic Risk Management (ATR Chandelier Exit):
Instead of fixed % stops, we use Average True Range (ATR) to calculate stop losses.
The Ratchet Mechanism: The stop loss moves up with the price but never moves down (for longs). This locks in profits automatically as the trend develops and exits immediately when volatility turns against you.
Why Use This Strategy?
Zero Repainting: All signals are confirmed.
No Curve Fitting: Uses classic parameters (144, 20) that have worked for decades.
Mental Peace: The strategy handles the exit. You don't need to guess where to sell. It holds through minor corrections and exits only when the trend truly reverses.
Settings
Leverage %: Adjust your position size based on equity (default 100% = 1x).
Timeframe: Recommended for 4H charts.
中文版 (Chinese Version)
简介 :大道至简。本策略专为 比特币 (BTC) 设计,针对其高波动、假突破多但趋势爆发力强的特点,摒弃了复杂的过度拟合指标,回归交易本质:“顺大势,滤噪音,截断亏损,让利润奔跑”。
核心逻辑
趋势过滤器 (斐波那契 EMA 144): 使用 144 周期指数移动平均线作为多空分水岭。价格在均线之上只做多,之下只做空。这能有效过滤掉大部分震荡市的噪音。
波动率突破 (唐奇安通道 20): 只有当价格突破过去 20 根 K 线的最高价(做多)或最低价(做空)时才进场。这确保了我们只在趋势确立的瞬间入场。
动态风控 (ATR 吊灯止损):
拒绝固定点数止损,使用 ATR(平均真实波幅)根据市场热度动态计算安全距离。
棘轮机制: 止损线会跟随价格上涨而上移,但绝不会下移(做多时)。这实现了自动化的“利润锁定”,既能扛住正常的波动回调,又能在大势反转时果断离场。
策略优势
绝不重绘: 所有信号均为收盘确认或实时触价。
拒绝拟合: 使用经过数十年市场验证的经典参数组合。
心态管理: 策略全自动管理出场。你不需要纠结何时止盈,它会帮你吃到完整的鱼身,直到趋势结束。
使用建议
资金管理: 可通过参数调整仓位占比(默认 100% = 1倍杠杆)。
推荐周期: 建议在4小时 图表上运行效果最佳。
1-Hour Trend Breakout Strategy (Scaled Entry Version)This strategy is a trend-following system on the Bitcoin 1-hour chart.
It enters in the direction of the market when price breaks an upward or downward trendline, using scaled (partial) entries.
Entry Rules
Go long when price breaks an upward trendline.
Go short when price breaks a downward trendline.
Position size is split into several parts and entered gradually.
Trade Management
When the first take-profit level (TP1) is reached, a portion of the position is closed.
The stop-loss on the remaining position is moved to break-even (entry price) to lock in profits and manage risk.
Performance
Period: 2019-12-16 to 2025-12-07
Total P&L: +2,385%
Maximum Drawdown (MDD): 28%
Win Rate: 79%
Profit Factor: 3.1

RevertX by YCGH CapitalRevertX by YCGH Capital - Professional Bitcoin Trading Strategy
RevertX is a sophisticated mean-reversion trading system designed specifically for Bitcoin and cryptocurrency markets. Built on advanced statistical analysis, this strategy identifies extreme price deviations and capitalizes on market equilibrium forces.
Key Features:
🎯 Intelligent Entry System
Precision-based signal generation using statistical price analysis
Automated entry/exit execution with no manual intervention required
Works on multiple timeframes for flexibility
📊 Comprehensive Performance Tracking
Monthly Returns Table: Visual heat-map style table displaying performance month-by-month and year-by-year
Color-coded results (green for profitable months, red for losses)
Annual performance summaries for quick assessment
Full historical performance visualization
🛡️ Advanced Risk Management
Customizable Stop Loss (default 2%)
Take Profit targets (default 4%)
Trailing Stop Loss with activation threshold - locks in profits as the market moves in your favor
Adjustable trailing offset to protect gains while allowing room for continuation
⚙️ Professional-Grade Execution
Non-repainting signals - what you see in backtest is what you get in live trading
Orders processed on candle close for reliable execution
100% equity deployment for maximum capital efficiency
Built-in slippage and commission modeling (can be adjusted)
📈 Performance Visualization
Monthly returns displayed in an easy-to-read table format
Track your performance across years at a glance
Quickly identify strong and weak periods
Professional presentation suitable for sharing with investors
Perfect For:
Bitcoin traders seeking systematic, emotion-free trading
Those who prefer mean-reversion over trend-following
Traders wanting comprehensive performance analytics
Anyone seeking a proven statistical edge in crypto markets
RevertX removes emotion from trading decisions and provides complete transparency through detailed performance metrics. The strategy is fully backtested and ready for live deployment.
Ready to Trade Like a Pro?
RevertX is a premium strategy with limited availability.
Email brijamohanjha@gmail.com to request access and pricing.

Estrategia Trend Following: 52w/26w BreakoutThis is a classic long-term Trend Following strategy, heavily inspired by the Donchian Channel system and the legendary "Turtle Trading" rules. It is designed to capture major market moves (bull runs) while filtering out short-term market noise and volatility.
This script is ideal for investors and swing traders who prefer a "hands-off" approach, looking to catch large trends rather than day-trading small fluctuations.
How it Works:
1. Entry Condition (The Breakout):
52-Week High: The strategy enters a Long position when the price breaks above the highest high of the last 252 trading days (approx. 1 year).
SuperTrend Filter: An additional filter using the SuperTrend indicator ensures that the breakout is supported by positive momentum, helping to reduce false signals during choppy lateral markets.
2. Exit Condition (The Trailing Stop):
26-Week Low: The strategy ignores short-term corrections. It only closes the position if the price closes below the lowest low of the last 126 trading days (approx. 6 months).
This wide stop allows the trade to "breathe" and stay open during significant pullbacks, ensuring you stay in the trend for as long as possible.
Features & Settings:
Customizable Lookback Periods: You can adjust the Entry (default 252 days) and Exit (default 126 days) periods in the settings menu.
Visual Aids:
Blue Line: Represents the 1-Year High (Entry Threshold).
Red Line: Represents the 6-Month Low (Dynamic Stop Loss).
Channel Shading: Visualizes the trading range between the high and low.
Labels: Clearly marks "BUY" and "EXIT" points on the chart.
Recommended Usage:
Timeframe: Daily (1D). This logic is designed for daily candles.
Assets: Works best on assets with strong trending characteristics (e.g., Bitcoin/Crypto, Tech Stocks, Indices like SPX/NDX, and Commodities).
Patience Required: This strategy generates very few signals. It may stay quiet for months and then hold a position for over a year.
