BitcoinMF RSI + EMA Combined MemecatorA script combinig RSI + EMA + important levels of RSI
For more follow BitcoinMF on TV, Discord and Telegram.
DYOR
NOT FINANCIAL ADVICE.
good Luck and Trade Safe
Buscar en scripts para "bitcoin"

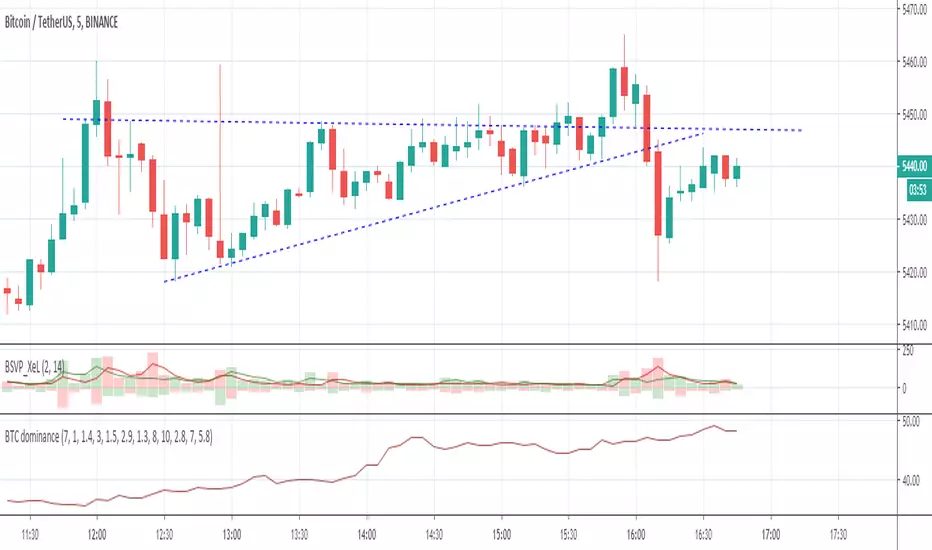
Bitcoin dominance flowHello
this is bitcoin dominance flow indicators. When when you trade altcoins, you sould see bitcoin dominance must go down and your altcoin or others must go up. If price goes up without dominance, this price wont be permenant.
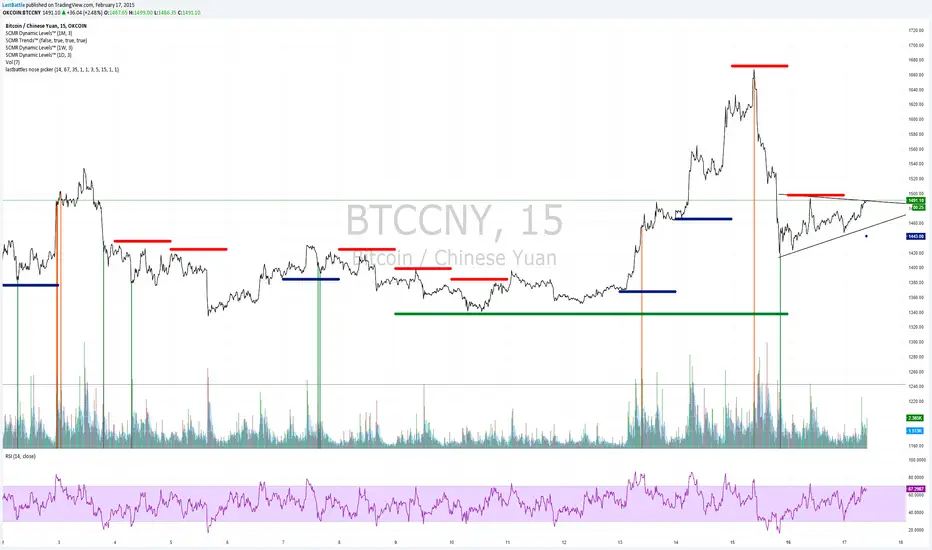
[Bitcoin] Lastbattle's nose pickerI've been working on a top and bottom picker script over the past couple of weeks, based on RSI of multiple timeframe closing price. It've been a pretty good trading system that's tested over the last meteoric rise from 220~270 and back down to 230 right now, and I think it should be released to the community.
Sure, I'm not worried about this strategy not working anymore after it is being used by the majority. Everyone have a different view of the market, and this is more towards psychology. It'll likely to hold for as long as there are still humans trading Bitcoins. Bitcoin market is full of emotions, you'll never run out of it.
So why does it work?
If you take a look at the live charts offered by Bitcoinwisdom and Cryptowatch, they only offer 1, 3, 5, and 15 minute timeframe by default with no other option to switch.
Naturally more traders will look at these levels for oversold and overbought condition.
The same indicator does not work for the broader commodities market such as Gold and Silver.
How does it work?
As long as the RSI levels of 1, 3, 5, and 15 minute fulfills the oversold/overbought level, a signal will be given.
The overbought/oversold level gets compensated the higher volatility the market is in.
Note: **
-This is only for exit strategy. If you're on long, consider reducing or exiting your position when it displays a red. On the other hand if you're short, consider reducing or covering your shorts if it shows a green.
-It may give false signal in a trending market, use your trading experience and judgement to filter them out. (eg: uptrend usually have more than 1 legs AND after a long consolidation, RSI gets to oversold/overbought easily... the market will tend to test the support/resistance again.)
-This is tuned for the 15m interval, the script won't work beyond this. I use it for scalping futures. Feel free to change or remove this line 'plot(interval == 15 and '
-Even if it shows a signal, it may not be the true top/bottom. Sometimes there may be a weak diverged leg aka 'last fart', so that's one reason I dont use this for entry until more confirmation is given via other indicators.
** If your chart is zooming all the way down to 0, right click on the price at the right and select 'Scale price only'
Go ahead and try this out with willy, etc and see what works better :D
Credits:
-LazyBear for the volatility switcher script
Bitcoin Indicator CBitcoin Indicator C is the missing part of the whole picture. It must be used together with Bitcoin Indicator B for the best results possible!
Indicator B is to find the entry on the market sharp, while the new Indicator C will help you to find the zone where it's time to look for the entry. The dots do NOT represent the start nor the end of the trend, they only show the cross of the waves. Indicator C was created to see the bigger picture of the market. You will see 3 waves on the indicator. The white wave is the main indication of the trend, however all of them should be considered together. Think about it as a painting so just step back and watch the whole picture. If you see the waves topping and start to form a downtrend it's time to find your entry on Indicator B. Also when you see waves bottoming it's time to look for the entry of the Long trade.
When all of 3 waves moving together parallel from the top to the bottom that's a strong downtrend. Opposite occurs when there is a strong uptrend on the market.
These waves were created to show unique repeating patterns, too. For example: White wave bottoming while others keep painting on the upside of the zero line. Other example if repeating waves getting lower and lower... Learn more about unique patterns on our website!

Bitcoin Margin Call Envelopes [saraphig & alexgrover]Bitcoin is the most well known digital currency, and allow two parties to make a transaction without the need of a central entity, this is why cryptocurrencies are said to be decentralized, there is no central unit in the transaction network, this can be achieved thanks to cryptography. Bitcoin is also the most traded cryptocurrency and has the largest market capitalization, this make it one of the most liquid cryptocurrency.
There has been tons of academic research studying the profitability of Bitcoin as well as its role as a safe heaven asset, with all giving mixed conclusions, some says that Bitcoin is to risky to be considered as an hedging instrument while others highlight similarities between Bitcoin and gold thus showing evidence on the usefulness of Bitcoin acting as an hedging instrument. Yet Bitcoin seems to attract more short term speculative investors rather than other ones that would use Bitcoin as an hedging instrument.
Once introduced, cryptocurrencies where of course heavily analyzed by technical analyst, and technical indicators where used by retail as well as institutional investors in order to forecast the future trends of bitcoin. I never really liked the idea of designing indicators that specifically worked for only one type of market and ever less on only one symbol. Yet the user @saraphig posted in Feb 20 an indicator called " Margin Call MovingAverage " who calculate liquidation price by using a volume weighted moving average. It took my attention and we decided to work together on a relatively more complete version that would include resistances levels.
I believe the proposed indicator might result useful to some users, the code also show a way to restrict the use of an indicator to only one symbol (line 9 to 16).
The Indicator
The indicator only work on BTCUSD, if you use another symbol you should see the following message:
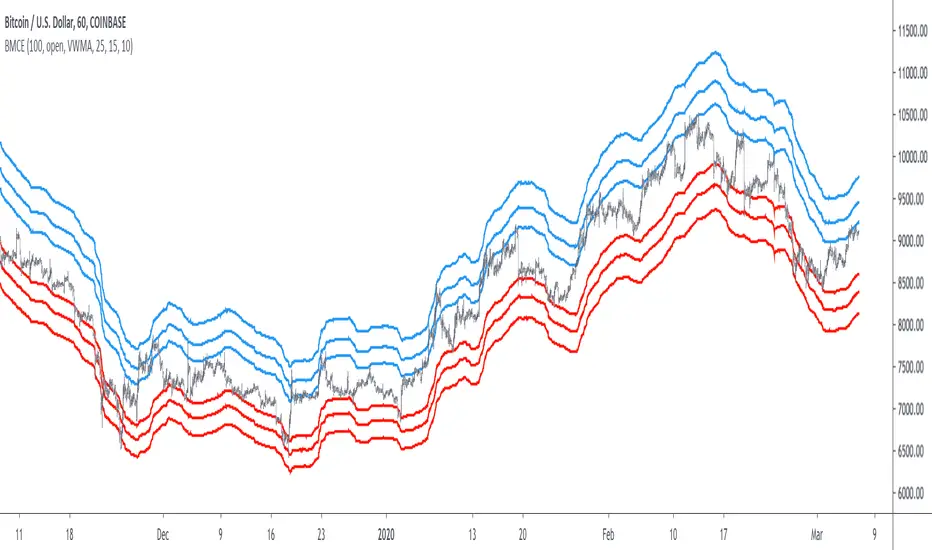
The indicator plot 6 extremities, with 3 upper (resistance) extremities and 3 lower (support) extremities, each one based on the isolated margin mode liquidation price formula:
UPlp = MA/Leverage × (Leverage+1-(Leverage*0.005))
for upper extremities and:
DNlp = MA × Leverage/(Leverage+1-(Leverage*0.005))
for lower extremities.
Length control the period of the moving averages, with higher values of length increasing the probability of the price crossing an extremity. The Leverage's settings control how far away their associated extremities are from the price, with lower values of Leverage making the extremity farther away from the price, Leverage 3 control Up3 and Dn3, Leverage 2 control Up2 and Dn2, Leverage 1 control Up1 and Dn1, @saraphig recommend values for Leverage of either : 25, 20, 15, 10 ,5.
You can select 3 different types of moving average, the default moving average is the volume weighted moving average (VWMA), you can also choose a simple moving average (SMA) and the Kaufman adaptive moving average (KAMA).
Based on my understanding (which could be wrong) the original indicator aim to highlight points where margin calls might have occurred, hence the name of the indicator.
If you want a more "DSP" like description then i would say that each extremity represent a low-pass filter with a passband greater than 1 for upper extremities and lower than 1 for lower extremities, unlike bands indicators made by adding/subtracting a volatility indicator from another moving average this allow to conserve the original shape of the moving average, the downside of it being the inability to show properly on different scales.
here length = 200, on a 1h tf, each extremities are able to detect short-terms tops and bottoms. The extremity become wider when using lower time-frames.
You would then need to increase the Leverages settings, i recommend a time frame of 1h.
Conclusion
I'am not comfortable enough to make a conclusion, as i don't know the indicator that well, however i liked the original indicator posted by @saraphig and was curious about the idea behind it, studying the effect of margin calls on market liquidity as well as making indicators based on it might result a source of inspiration for other traders.
A big thanks to @saraphig who shared a lot of information about the original indicator and allowed me to post this one. I don't exclude working with him/her in the future, i invite you to follow him/her:
www.tradingview.com
Thx for reading and have a nice weekend! :3
Bitcoin Number of Coins'Bitcoin Number of Coins' is the total number of Bitcoins which have been mined. This is the number of coins (technically) in circulation.
Additionally, the indicator shows the number of Bitcoin pending to be mined, considering a max cap of 21 million coins.

Bitcoin Daily Buy & Sell SignalBitcoin Top Secret Found!
Trying to find potential Buy & Sell points.
It's pretty helpful and accurate in daily chart.
You could even use it on NASDAQ:NDX !
Invite only for valuation now.

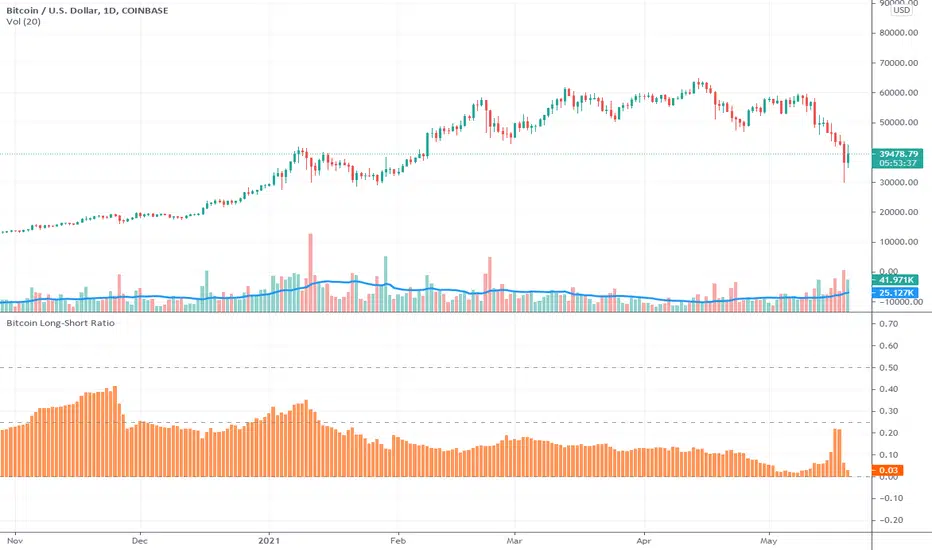
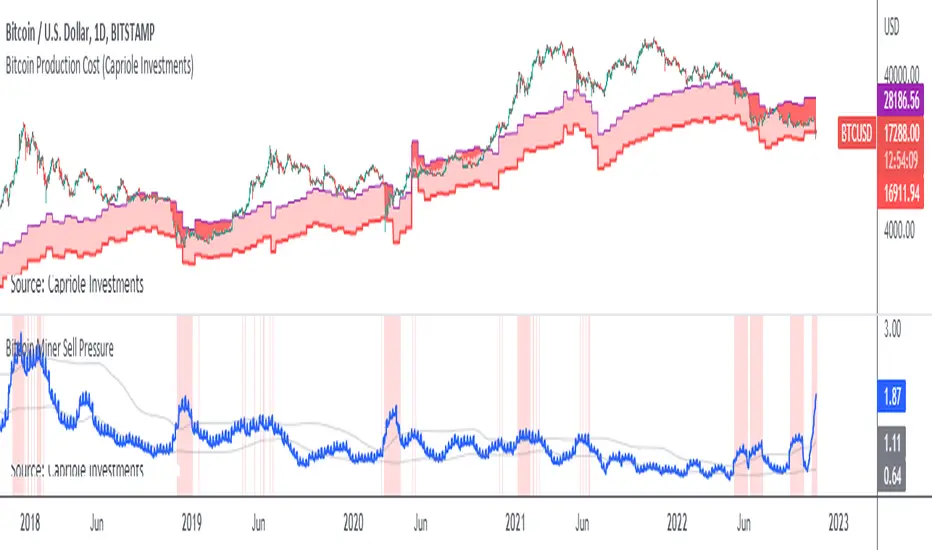
Bitcoin Miner Sell PressureBitcoin miners are in pain and now (November 2022) selling more than they have in almost 5 years!
Introducing: Bitcoin Miner Sell Pressure.
A free, open-source indicator which tracks on-chain data to highlight when Bitcoin miners are selling more of their reserves than usual.
The indicator tracks the ratio of on-chain miner Bitcoin outflows to miner Bitcoin reserves.
- Higher = more selling than usual
- Lower = less selling than usual
- Red = extraordinary sell pressure
Today , it's red.
What can we see now ?
Miners are not great at treasury management. They tend to sell most when they are losing money (like today). But there have been times when they sold well into high profit, such as into the 2017 $20K top and in early 2021 when Bitcoin breached $40K.
Bitcoin Miner Sell Pressure identifies industry stress, excess and miner capitulation.
Unsurprisingly, there is a high correlation with Bitcoin Production Cost; giving strong confluence to both.
In some instances, BMSP spots capitulation before Hash Ribbons. Such as today!
Bitcoin Logarithmic Price BandsBitcoin has been trending up with time. Generally, Bitcoin has been following an increasing logarithmic path, as seen on the chart. This indicator tries to plot areas of buying or selling opportunity. The green area contains data from times when Bitcoin was extremely undervalued. The red area is calculated from times where Bitcoin was extremely overvalued. The logarithmic bands will increase with time, so the values are not static.
Generally speaking, buy when the price is in the green area and sell when the price is in the red area.
The model doesn’t contain ANY data from after November 2020. Nevertheless, it correctly predicted the area where Bitcoin topped in April 2021.
In addition, the yellow logarithmic band manages to indicate strong areas of support or resistance. So did it correctly indicate the top of the mid-cycle peak in 2013, the bottom after the first sell-off in Feb 2018, the 2019 top and at last the mid-cycle bear-market from May-June 2021.
This study will be updated once or twice per year to add new data to the calculation. This means that the logarithmic bands will look slightly different in the future compared to now. Nevertheless, the bands add valuable information on buying or selling opportunities in the market.
The indicator is only useable on the Bitcoin/Dollar index by Tradingview, weekly timeframe.
For access, please take a look at the "Author's Instructions" below.

Bitcoin Premium for Bitfinex and Coinbase By CompoundWater
Bitcoin Premium for Bitfinex and Coinbase By CompoundWater
Timing and Application:
When the crypto trend is obviously positive for a long time frame, give short-term investors a reference.
Purpose:
This is for Bitcoin Price between Bitfinex(BFX) and Coinbase(CB)
and give you some hint when to be careful and when to find chance to buy/long BTC.
if
(BFX – CB ) Bitcoin Price:
< 0 will show red line below
> 0 will show green line below
Action:
💀 show (BFX – CB <0 too much): Be care market may be too greed!
💗 show (BFX – CB >0 too much ): Try to find some chance to long BTC!
Why?
There are many big and old players in Bitfinex.
Coinbase may has more small investors and new user.
Data source: Coinbase/Bitfinex BTCUSD
The indicator is recommended to be applied in 4hr timeframes.
Disclaimer: only for learning reference, please consider by yourselves

Bitcoin Block Height (Total Blocks)Bitcoin Block Height by RagingRocketBull 2020
Version 1.0
Differences between versions are listed below:
ver 1.0: compare QUANDL Difficulty vs Blockchain Difficulty sources, get total error estimate
ver 2.0: compare QUANDL Hash Rate vs Blockchain Hash Rate sources, get total error estimate
ver 3.0: Total Blocks estimate using different methods
--------------------------------
This indicator estimates Bitcoin Block Height (Total Blocks) using Difficulty and Hash Rate in the most accurate way possible, since
QUANDL doesn't provide a direct source for Bitcoin Block Height (neither QUANDL:BCHAIN, nor QUANDL:BITCOINWATCH/MINING).
Bitcoin Block Height can be used in other calculations, for instance, to estimate the next date of Bitcoin Halving.
Using this indicator I demonstrate:
- that QUANDL data is not accurate and differ from Blockchain source data (industry standard), but still can be used in calculations
- how to plot a series of data points from an external csv source and compare it with another source
- how to accurately estimate Bitcoin Block Height
Features:
- compare QUANDL Difficulty source (EOD, D1) with external Blockchain Difficulty csv source (EOD, D1, embedded)
- show/hide Quandl/Blockchain Difficulty curves
- show/hide Blockchain Difficulty candles
- show/hide differences (aqua vertical lines)
- show/hide time gaps (green vertical lines)
- count source differences within data range only or for the whole history
- multiply both sources by alpha to match before comparing
- floor/round both matched sources when comparing
- Blockchain Difficulty offset to align sequences, bars > 0
- count time gaps and missing bars (as result of time gaps)
WARNING:
- This indicator hits the max 1000 vars limit, adding more plots/vars/data points is not possible
- Both QUANDL/Blockchain provide daily EOD data and must be plotted on a daily D1 chart otherwise results will be incorrect
- current chart must not have any time gaps inside the range (time gaps outside the range don't affect the calculation). Time gaps check is provided.
Otherwise hardcoded Blockchain series will be shifted forward on gaps and the whole sequence become truncated at the end => data comparison/total blocks estimate will be incorrect
Examples of valid charts that can run this indicator: COINBASE:BTCUSD,D1 (has 8 time gaps, 34 missing bars outside the range), QUANDL:BCHAIN/DIFF,D1 (has no gaps)
Usage:
- Description of output plot values from left to right:
- c_shifted - 4x blockchain plotcandles ohlc, green/black (default na)
- diff - QUANDL Difficulty
- c_shifted - Blockchain Difficulty with offset
- QUANDL Difficulty multiplied by alpha and rounded
- Blockchain Difficulty multiplied by alpha and rounded
- is_different, bool - cur bar's source values are different (1) or not (0)
- count, number of differences
- bars, total number of bars/data points in the range
- QUANDL daily blocks
- Blockchain daily blocks
- QUANDL total blocks
- Blockchain total blocks
- total_error - difference between total_blocks estimated using both sources as of cur bar, blocks
- number_of_gaps - number of time gaps on a chart
- missing_bars - number of missing bars as result of time gaps on a chart
- Color coding:
- Blue - QUANDL data
- Red - Blockchain data
- Black - Is Different
- Aqua - number of differences
- Green - number of time gaps
- by default the indicator will show lots of vertical aqua lines, 138 differences, 928 bars, total error -370 blocks
- to compare the best match of the 2 sources shift Blockchain source 1 bar into the future by setting Blockchain Difficulty offset = 1, leave alpha = 0.01 =>
this results in no vertical aqua lines, 0 differences, total_error = 0 blocks
if you move the mouse inside the range some bars will show total_error = 1 blocks => total_error <= 1 blocks
- now uncheck Round Difficulty Values flag => some filled aqua areas, 218 differences.
- now set alpha = 1 (use raw source values) instead of 0.01 => lots of filled aqua areas, 871 differences.
although there are many differences this still doesn't affect the total_blocks estimate provided Difficulty offset = 1
Methodology:
To estimate Bitcoin Block Height we need 3 steps, each step has its own version:
- Step 1: Compare QUANDL Difficulty vs Blockchain Difficulty sources and estimate error based on differences
- Step 2: Compare QUANDL Hash Rate vs Blockchain Hash Rate sources and estimate error based on differences
- Step 3: Estimate Bitcoin Block Height (Total Blocks) using different methods in the most accurate way possible
QUANDL doesn't provide block time data, but we can calculate it using the Hash Rate approximation formula:
estimated Hash rate/sec H = 2^32 * D / T, where D - Difficulty, T - block time, sec
1. block time (T) can be derived from the formula, since we already know Difficulty (D) and Hash Rate (H) from QUANDL
2. using block time (T) we can estimate daily blocks as daily time / block time
3. block height (total blocks) = cumulative sum of daily blocks of all bars on the chart (that's why having no gaps is important)
Notes:
- This code uses Pinescript v3 compatibility framework
- hash rate is in THash/s, although QUANDL falsely states in description GHash/s! THash = 1000 GHash
- you can't read files, can only embed/hardcode raw data in script
- both QUANDL and Blockchain sources have no gaps
- QUANDL and Blockchain series are different in the following ways:
- all QUANDL data is already shifted 1 bar into the future, i.e. prev day's value is shown as cur day's value => Blockchain data must be shifted 1 bar forward to match
- all QUANDL diff data > 1 bn (10^12) are truncated and have last 1-2 digits as zeros, unlike Blockchain data => must multiply both values by 0.01 and floor/round the results
- QUANDL sometimes rounds, other times truncates those 1-2 last zero digits to get the 3rd last digit => must use both floor/round
- you can only shift sequences forward into the future (right), not back into the past (left) using positive offset => only Blockchain source can be shifted
- since total_blocks is already a cumulative sum of all prev values on each bar, total_error must be simple delta, can't be also int(cum()) or incremental
- all Blockchain values and total_error are na outside the range - move you mouse cursor on the last bar/inside the range to see them
TLDR, ver 1.0 Conclusion:
QUANDL/Blockchain Difficulty source differences don't affect total blocks estimate, total error <= 1 block with avg 150 blocks/day is negligible
Both QUANDL/Blockchain Difficulty sources are equally valid and can be used in calculations. QUANDL is a relatively good stand in for Blockchain industry standard data.
Links:
QUANDL difficulty source: www.quandl.com
QUANDL hash rate source: www.quandl.com
Blockchain difficulty source (export data as csv): www.blockchain.com

Bitcoin Cycle Top IndicatorBitcoin Cycle Top Indicator on the 1W Bitcoin Logarithmic chart.
Called all 3 tops so far to a T, this indicator will be great use for the next upcoming cycle.
I kept it sweet and simple, no need to overcomplicate. That's all this indicator does.

Bitcoin Energy Value OscillatorBitcoin Energy Value as an oscillator against price.
Calculated as: (Bitcoin Price / Bitcoin Energy Value - 1) * 100

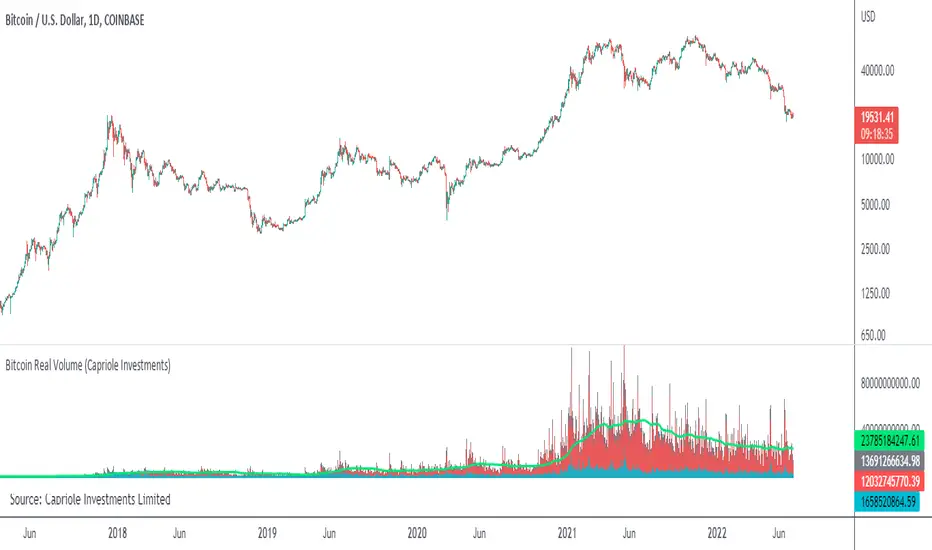
Bitcoin Real VolumeBitcoin’s Real Volume
An accurate read on the change in Bitcoin’s volume profile over time.
Based on 2019 reports by Bitwise and Alameda Research.
Please see the script code notes for assumptions and details on data selection.
Follow me for more information on this script.
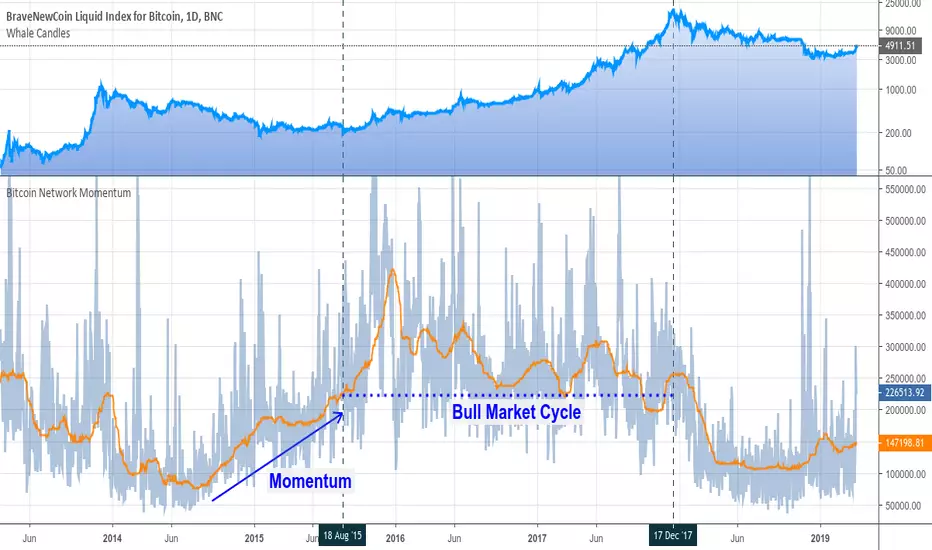
Bitcoin Network MomentumBitcoin Network Momentum is a leading indicator that relates On-Chain Transactional Volume (measured in BTC)with the evolution of the Bitcoin Price.
Further resources:
Woobull charts
Medium article
Credits: PositiveCrypto
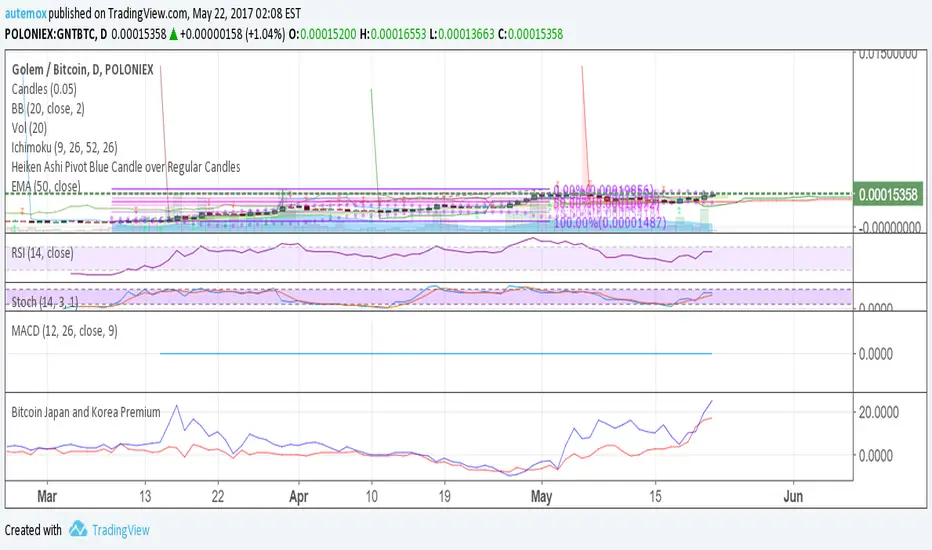
Bitcoin Japan and Korea PremiumRed line is the % premium to buy bitcoin in Japan. Blue is the % premium to buy bitcoin in korea.
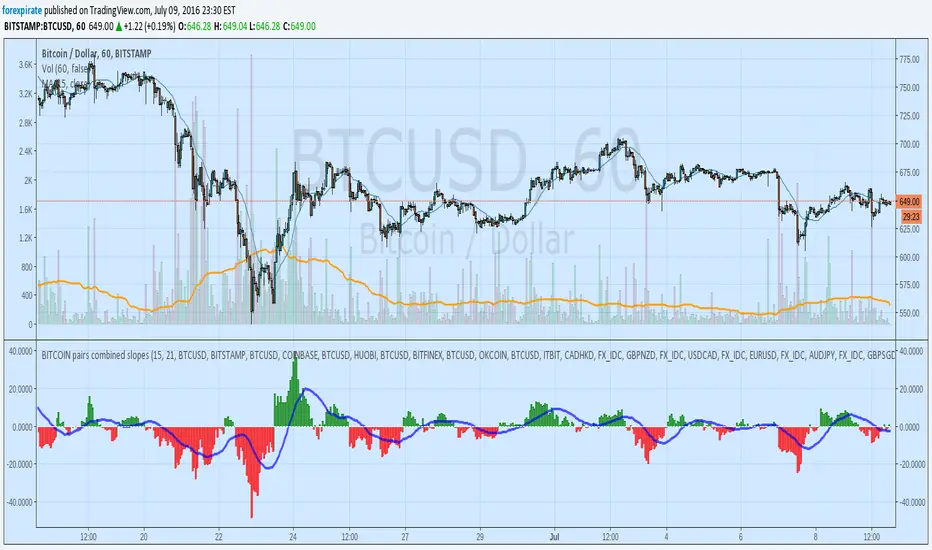
BITCOIN pairs combined slopesFirst Version of a BITCOIN multi exchange slope of moving average indicator. It takes the slope of a moving average from multiple exchanges to give a broader picture of what Bitcoin USD is doing. There is a bitcoin China and USDCHY pair in the code but it is not in the actual calculation. It is there for version two later on. Stay posted
Bitcoin Top Finder by DataDaterBitcoin Top Finder is an indicator that detects the absolute top of BTCUSD in each bull cycle (red line). It is also helpful in detecting bottoms of cycle (blue). It is based on cost of electricity and mining hash rate.
If you'd like access to this script, please send me a direct message.


Bitcoin Production CostBitcoin's Production Cost
Based on raw data from CBECI.
Follow me to read more about the calculation logic.

