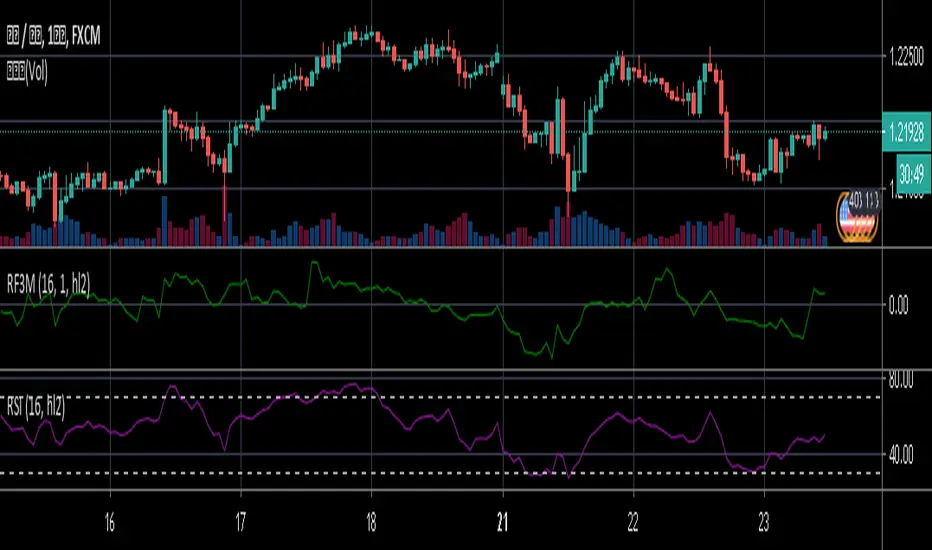
Relative Falling three Methods IndicatorAbstract
This script measure the related speed between rising and falling.
This script can replace binary Falling Three Methods detector and, report continuous value and estimate potential trend direction.
My suggestion of using this script is combining it with trading emotion.
Introduction
Falling Three Methods (F3M) is a candlestick pattern.
Many trading courses say traders can regard it as predicting falling will continue.
However, it is not easy to see perfect Falling Three Methods pattern from charts.
Therefore, we need an alternative method to measure it.
We can use the observation that falling is faster than rising during those time.
When falling is faster than rising, some long ( buy , call , higher , upper ) position owners may worry the price will fall very much suddenly.
When rising is faster than falling, some traders may worry they may miss buy opportunities.
Computing Related Falling Three Methods Indicator
(1) The value of rising and falling
In this script, open price is replaced with previous close price.
If the previous price is equal to the close price, than both rising and falling are equal to high-low.
If the previous price is lower than the close price, than the falling value becomes smaller, high-close+previous-low.
If the previous price is higher than the close price, than the rising value becomes smaller, high-previous+close-low.
(2) Area of value (aov)
Area of value is equal to highest-lowest. The previous close price is included.
(3) Compute weight and filter noise
We need a threshold for the noise filter. The default setting is aov/length, where length means how many days are counted.
When a rising or falling value <= threshold, it is not counted.
When a rising or falling value > threshold, the counted value = original value - threshold
and its weight = min ( counted value , threshold )
(4) compute speed
Rising speed = sum ( counted rising value ) / sum ( rising weight )
Falling speed = sum ( counted falling value ) / sum ( falling weight )
(5) Final result
Final result = Rising speed / ( Rising speed + Falling speed ) * 100 - 50
I move the middle level to 0 because 0 axis is always visible unless you cannot see negative values or you cannot see positive values.
Parameters
Length : how many days are counted. The default value is 16 just because 16=4*4, using binary characteristic.
Multi : the multiplier of noise threshold. Threshold applied = default threshold * multi
src : current not used
Conclusion
Related Falling Three Methods Indicator can measure the related speed between rising and falling.
I hope this indicator can help us to evaluate the possibility of trend continue or reversal and potential breakout direction.
After all, we care how trading emotion control the price movement and therefore we can take advantage to it.
Reference
How to trade with Falling Three Methods pattern
How to trade with Related Strength Indicator
Buscar en scripts para "binary"
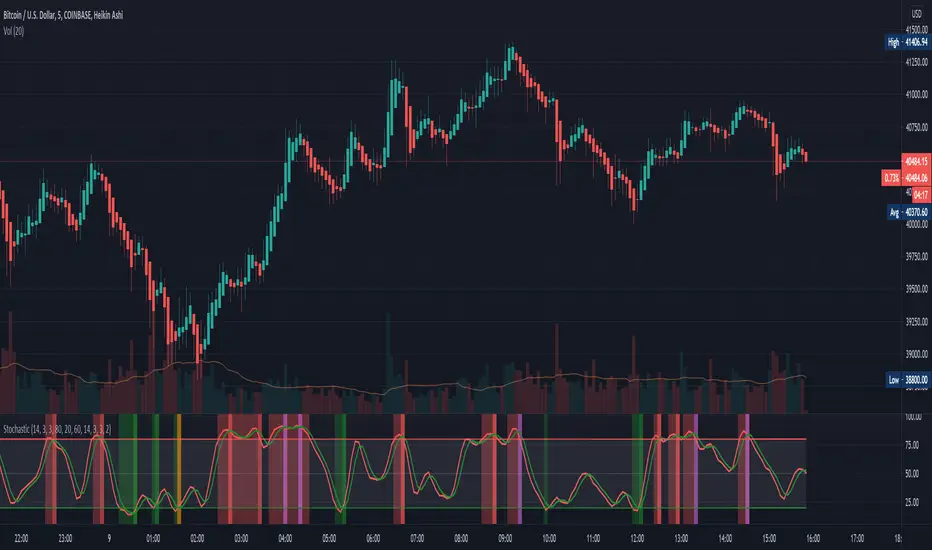
4 in 1 Stoch Indicators as used by HG (Stoch, SRSIx2, DMIStoch)By using this indicator you can better view the Stoch indicators used by this strategy which are:
- Stochastic (14,3,3)
- Stochastic RSI (14,14,3,3)
- Stochastic RSI (6,6,3,3)
- DMI Stochastic
This is best used alongside:
- Evan Cabral binary strategy 2
- Binary with Temito
The analisis is:
- When all lines in the indicator are above or below the overbough/oversold lines
- When the bollinger bands are broken
- A support or resistance is reached
That means a change of Trend.

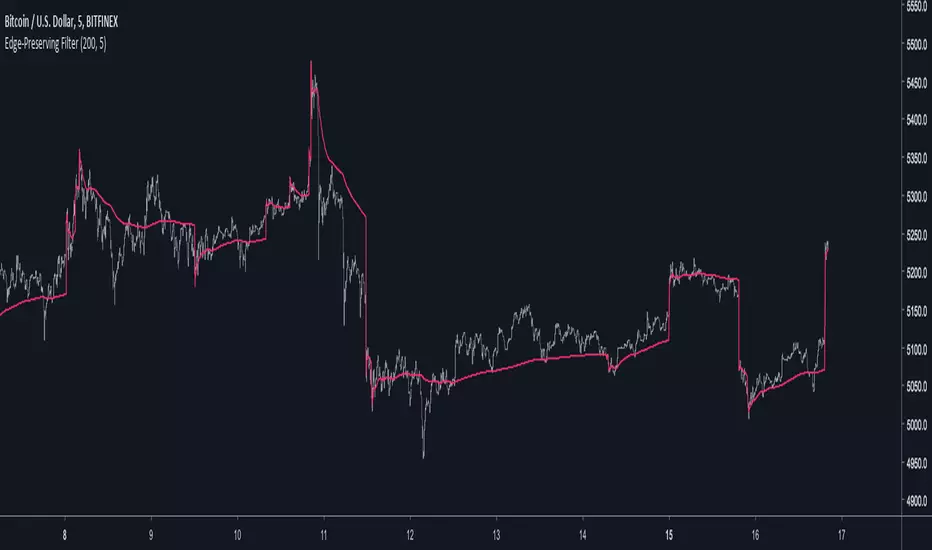
Edge-Preserving FilterIntroduction
Edge-preserving smoothing is often used in image processing in order to preserve edge information while filtering the remaining signal. I introduce two concepts in this indicator, edge preservation and an adaptive cumulative average allowing for fast edge-signal transition with period increase over time. This filter have nothing to do with classic filters for image processing, those filters use kernels convolution and are most of the time in a spatial domain.
Edge Detection Method
We want to minimize smoothing when an edge is detected, so our first goal is to detect an edge. An edge will be considered as being a peak or a valley, if you recall there is one of my indicator who aim to detect peaks and valley (reference at the bottom of the post) , since this estimation return binary outputs we will use it to tell our filter when to stop filtering.
Filtering Increase By Using Multi Steps Cumulative Average
The edge detection is a binary output, using a exponential smoothing could be possible and certainly more efficient but i wanted instead to try using a cumulative average approach because it smooth more and is a bit more original to use an adaptive architecture using something else than exponential averaging. A cumulative average is defined as the sum of the price and the previous value of the cumulative average and then this result is divided by n with n = number of data points. You could say that a cumulative average is a moving average with a linear increasing period.
So lets call CMA our cumulative average and n our divisor. When an edge is detected CMA = close price and n = 1 , else n is equal to previous n+1 and the CMA act as a normal cumulative average by summing its previous values with the price and dividing the sum by n until a new edge is detected, so there is a "no filtering state" and a "filtering state" with linear period increase transition, this is why its multi-steps.
The Filter
The filter have two parameters, a length parameter and a smooth parameter, length refer to the edge detection sensitivity, small values will detect short terms edges while higher values will detect more long terms edges. Smooth is directly related to the edge detection method, high values of smooth can avoid the detection of some edges.
smooth = 200
smooth = 50
smooth = 3
Conclusion
Preserving the price edges can be useful when it come to allow for reactivity during important price points, such filter can help with moving average crossover methods or can be used as a source for other indicators making those directly dependent of the edge detection.
Rsi with a period of 200 and our filter as source, will cross triggers line when an edge is detected
Feel free to share suggestions ! Thanks for reading !
References
Peak/Valley estimator used for the detection of edges in price.
Momentum Strategy, rev.2This is a revised version of the Momentum strategy listed in the built-ins.
For more information check out this resource:
www.forexstrategiesresources.com

EMA Strong Trend MarketUse this indicator with my binary blast v2 indicator for getting good binary signals if combine. Don't call or put option when this signal comes in a bar while using previous indicator.

Heiken Ashi zero lag EMA v1.1 by JustUncleLI originally wrote this script earlier this year for my own use. This released version is an updated version of my original idea based on more recent script ideas. As always with my Alert scripts please do not trade the CALL/PUT indicators blindly, always analyse each position carefully. Always test indicator in DEMO mode first to see if it profitable for your trading style.
DESCRIPTION:
This Alert indicator utilizes the Heiken Ashi with non lag EMA was a scalping and intraday trading system
that has been adapted also for trading with binary options high/low. There is also included
filtering on MACD direction and trend direction as indicated by two MA: smoothed MA(11) and EMA(89).
The the Heiken Ashi candles are great as price action trending indicator, they shows smooth strong
and clear price fluctuations.
Financial Markets: any.
Optimsed settings for 1 min, 5 min and 15 min Time Frame;
Expiry time for Binary options High/Low 3-6 candles.
Indicators used in calculations:
- Exponential moving average, period 89
- Smoothed moving average, period 11
- Non lag EMA, period 20
- MACD 2 colour (13,26,9)
Generate Alerts use the following Trading Rules
Heiken Ashi with non lag dot
Trade only in direction of the trend.
UP trend moving average 11 period is above Exponential moving average 89 period,
Doun trend moving average 11 period is below Exponential moving average 89 period,
CALL Arrow appears when:
Trend UP SMA11>EMA89 (optionally disabled),
Non lag MA blue dot and blue background.
Heike ashi green color.
MACD 2 Colour histogram green bars (optional disabled).
PUT Arrow appears when:
Trend UP SMA11

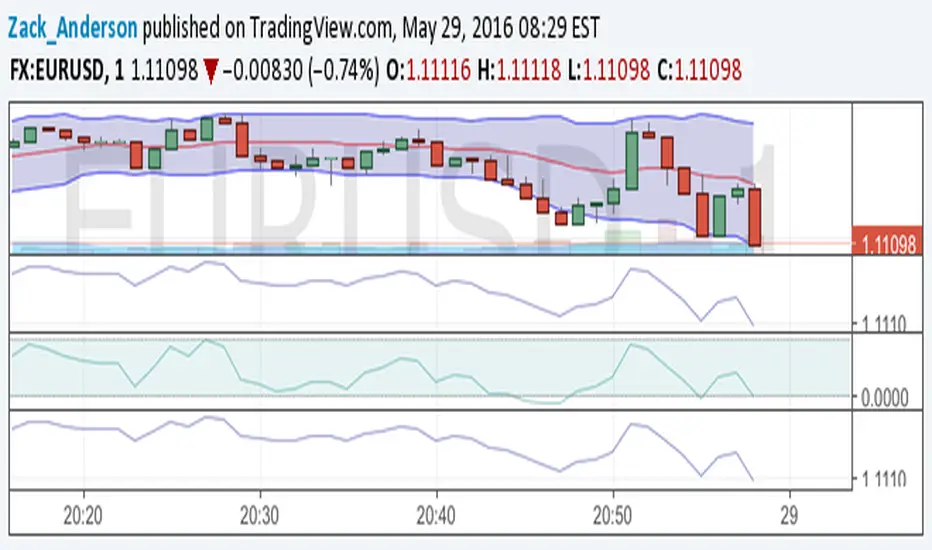
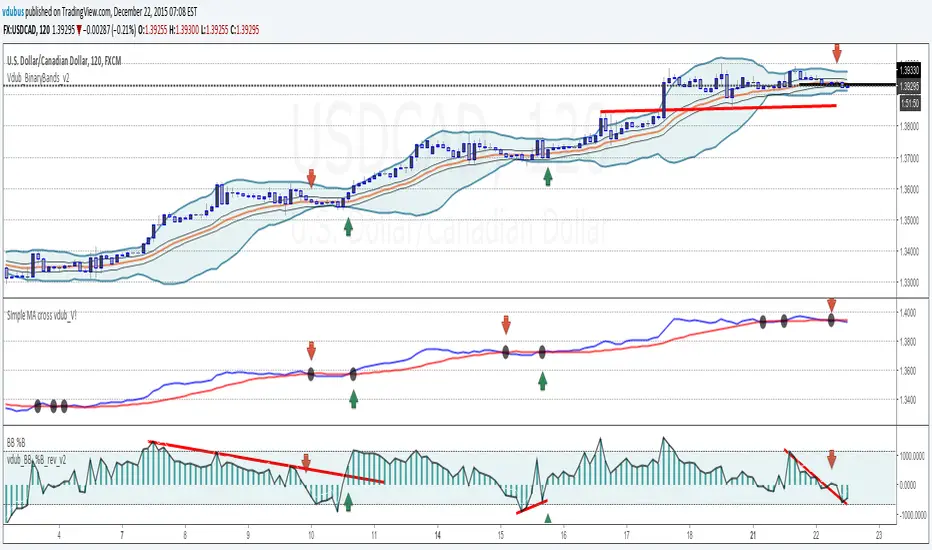
Bollinger Bands NEW
var tradingview_embed_options = {};
tradingview_embed_options.width = 640;
tradingview_embed_options.height = 400;
tradingview_embed_options.chart = 's48QJlfi';
new TradingView.chart(tradingview_embed_options);
Vdub Binary Options SniperVX v1 by vdubus on TradingView.com
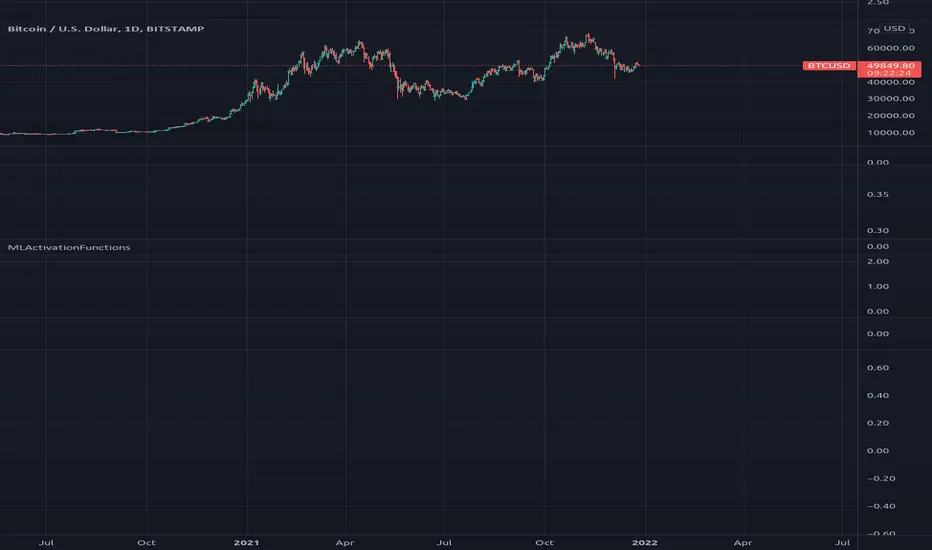
MLActivationFunctionsLibrary "MLActivationFunctions"
Activation functions for Neural networks.
binary_step(value) Basic threshold output classifier to activate/deactivate neuron.
Parameters:
value : float, value to process.
Returns: float
linear(value) Input is the same as output.
Parameters:
value : float, value to process.
Returns: float
sigmoid(value) Sigmoid or logistic function.
Parameters:
value : float, value to process.
Returns: float
sigmoid_derivative(value) Derivative of sigmoid function.
Parameters:
value : float, value to process.
Returns: float
tanh(value) Hyperbolic tangent function.
Parameters:
value : float, value to process.
Returns: float
tanh_derivative(value) Hyperbolic tangent function derivative.
Parameters:
value : float, value to process.
Returns: float
relu(value) Rectified linear unit (RELU) function.
Parameters:
value : float, value to process.
Returns: float
relu_derivative(value) RELU function derivative.
Parameters:
value : float, value to process.
Returns: float
leaky_relu(value) Leaky RELU function.
Parameters:
value : float, value to process.
Returns: float
leaky_relu_derivative(value) Leaky RELU function derivative.
Parameters:
value : float, value to process.
Returns: float
relu6(value) RELU-6 function.
Parameters:
value : float, value to process.
Returns: float
softmax(value) Softmax function.
Parameters:
value : float array, values to process.
Returns: float
softplus(value) Softplus function.
Parameters:
value : float, value to process.
Returns: float
softsign(value) Softsign function.
Parameters:
value : float, value to process.
Returns: float
elu(value, alpha) Exponential Linear Unit (ELU) function.
Parameters:
value : float, value to process.
alpha : float, default=1.0, predefined constant, controls the value to which an ELU saturates for negative net inputs. .
Returns: float
selu(value, alpha, scale) Scaled Exponential Linear Unit (SELU) function.
Parameters:
value : float, value to process.
alpha : float, default=1.67326324, predefined constant, controls the value to which an SELU saturates for negative net inputs. .
scale : float, default=1.05070098, predefined constant.
Returns: float
exponential(value) Pointer to math.exp() function.
Parameters:
value : float, value to process.
Returns: float
function(name, value, alpha, scale) Activation function.
Parameters:
name : string, name of activation function.
value : float, value to process.
alpha : float, default=na, if required.
scale : float, default=na, if required.
Returns: float
derivative(name, value, alpha, scale) Derivative Activation function.
Parameters:
name : string, name of activation function.
value : float, value to process.
alpha : float, default=na, if required.
scale : float, default=na, if required.
Returns: float
Whole NumbersThis is a simple indicator for the whole numbers.
It breaks down every pair for 10 pips.
Its also simple and nice to use

Stochastic with Outlier Labels/MTFTL;DR This indicator is an update to a simple stochastic ('Stoch_MTF' by binarytrader666) that provides a novel outlier highlighting feature
Improvements on stochastic:
1. Novel outlier highlighting that points out crosses that are the Nth consecutive cross or greater.
2. Allowing for multiple timeframes to be shown on the same chart
3. Highlighting/Labelling crosses and providing labels for alerts
A cross of the stochastics in the high or low zones establishes a trend. Successive crosses in the same region seem to indicate a continuation of that trend. The outlier functionality here provides a signal for when X number of crosses have been in the same trend, signaling further strength of that signal.
I also provided the necessary code for converting this to a strategy if you so wish at the bottom.
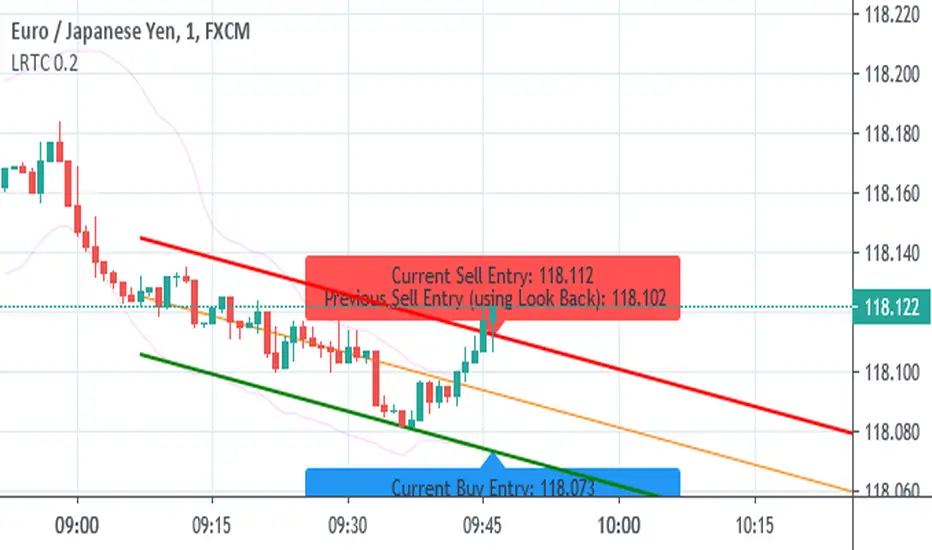
Linear Regression Trend Channel with Entries & AlertsPlease Use this Indicator If you understand the risk posed by linear regression trend channel
Features
Provides trend channel (best value for period is 40 on 5 minute timeframe
Provides BUY/SELL entries based on current channel
Provides custom color for channel
Best used with MattyPips strategy indicators
Risks : Please note, this script is the likes of Bollinger bands and poses a risk of falling in a trend range.
Entries may keep running on the same direction while the market is moving.
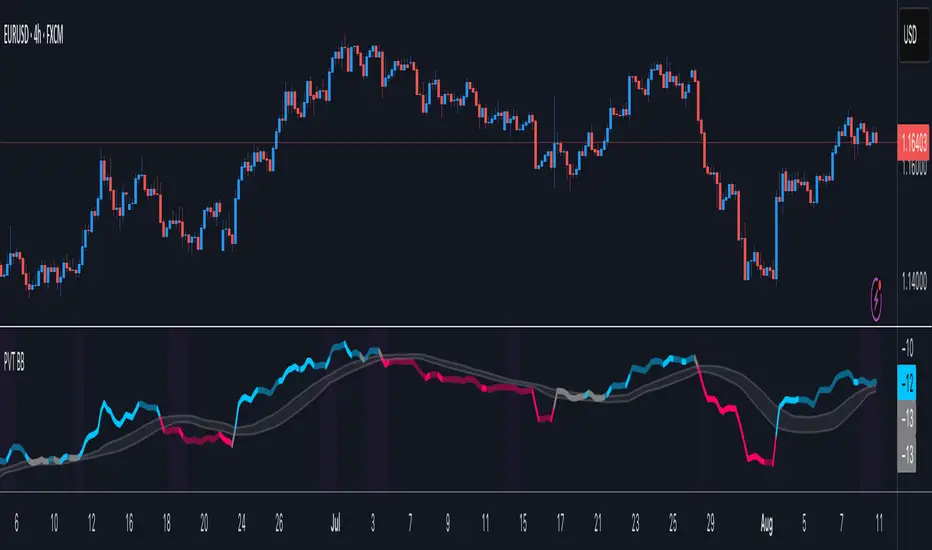
Price Volume Trend BBHey guys,
Ive been thinking about Price Volume Trend for a while and tried adding different moving averages to it, but seems its not as binary.
Therefore adding the bollinger bands as a no-trade-zone made it alot better. Indicator is pretty basic at the moment since I just implemented the idea but im planning to do some add-ons later on to make it easier to read.
Will keep you updated!

VEMA Band_v2 - 'Centre of GravityConcept taken from the MT4 indicator 'Centre of Gravity'except this one doesn't repaint.
Modified / BinaryPro 3 / Permanent Marker
Ema configuration instead of sma & centralised.

Vdub_Tetris_Stoch_V1Vdub_Tetris_Stoch_V1
A combination lower based indicators based on the period channel indicator Vdub_Tetris_V2
Blue line is more reactive fast moving, Red line in more accurate to highs / Lows with divergence.- Still testing
Code title error
Change % = Over Bought / Over Sold
Vdub Tetris_V2
Vdubus BinaryPro 2 /Tops&Bottoms
StochDM


DafeVisualsLibDafeVisualsLib: The Architect - The Intelligent Visualization Engine
This is not a library of drawing functions. This is an AI-powered artist and data scientist that lives in your code. It automates the complex, time-consuming process of data analysis and visualization, allowing you to focus on what truly matters: your trading ideas.
█ CHAPTER 1: THE PHILOSOPHY - BEYOND PLOTTING, INTO PERCEPTION
For too long, the world of technical indicator development has been bifurcated. On one side, you have the quantitative analyst, obsessed with mathematical purity but often displaying their work in a crude, unintuitive manner. On the other, you have the visual designer, creating beautiful indicators that often lack analytical depth. The result for the end-user is a compromise: either a tool that is powerful but ugly and hard to interpret, or one that is beautiful but analytically shallow.
The DafeVisualsLib was created to shatter this compromise. Its core philosophy is that great analysis and great visualization are not separate disciplines; they are two sides of the same coin . An indicator should not just present data; it should communicate intelligence. It should automatically understand the nature of the data it is given and render it in the most effective, intuitive, and aesthetically pleasing way possible.
This library is an "Architect." You provide it with the raw materials—a simple data series like an RSI or a moving average—and it handles the entire complex process of analysis, configuration, and rendering. It is the ultimate accelerator for developers, saving hundreds of hours of boilerplate code, and the ultimate upgrade for traders, providing a level of clarity and visual intelligence previously unseen on this platform.
█ CHAPTER 2: THE CORE INNOVATION - THE "ANALYZE, THEN RENDER" PARADIGM
The DafeVisualsLib operates on a revolutionary two-stage pipeline that sets it apart from any other tool.
STAGE 1: The analyze() Function (The Data Scientist)
This is the brain. Before a single line is drawn, this function performs a sophisticated statistical analysis on your raw data series to understand its fundamental character. It asks the critical questions that a human analyst would:
What type of data is this? It automatically detects if your data is a bounded "oscillator" like an RSI, a zero-centric "momentum" indicator like MACD, a "price"-based line like a moving average, or a "volume"-based metric.
What is the current market regime? It analyzes the data's volatility (using the coefficient of variation) to classify the current environment as a low-volatility "squeeze," a moderate-volatility "trend," or a high-volatility "volatile" state.
Where is the data in its cycle? It normalizes the data to a 0-100 scale and determines if it is currently at a statistical "extreme."
The output of this stage is a MetricAnalysis object—a complete analytical report on the DNA of your data.
STAGE 2: The auto_config() Function (The Artist & Physicist)
This is where the magic happens. This function takes the analytical report from analyze() and uses it to make a series of intelligent, context-aware decisions about how the data should be visualized.
Intelligent Color Logic: It doesn't just use one color. For an oscillator, it will create a beautiful heatmap gradient. For a momentum indicator, it will use a binary bull/bear color scheme.
Neon Physics: It separates the color into a solid c_core and a transparent c_glow. The opacity of the glow is not static; it is dynamically controlled by the detected market regime. In a "volatile" regime, the glow becomes bright and intense. In a "squeeze," it becomes dim and subtle.
Adaptive Style & Width: It automatically adjusts the plot style and line width. A "momentum" indicator will be rendered as a histogram by default. A "price" line will be thick and bold in a volatile market and thin and clean in a calm market.
Smart Zones: If it detects that the data is an "oscillator," it will automatically recommend showing overbought/oversold zones and provide the standard 70/30 levels.
The output of this stage is a PlotConfig object—a complete, ready-to-use set of plotting instructions, intelligently tailored to your specific data and the current market conditions.
█ CHAPTER 3: THE DEVELOPER'S TOOLKIT - A MASTERCLASS IN EFFICIENCY
This library is a gift to Pine Script developers. It is a suite of powerful, high-level functions designed to simplify your workflow and elevate your final product.
The Theme Engine
Forget hard-coding colors. The get_theme() function provides access to a library of professionally designed, high-contrast color themes ("Neon," "Cyber," "Matrix," "Gold," etc.). Each Theme object contains a complete palette for primary, secondary, accent, bull, bear, and neutral colors, ensuring perfect visual consistency across your entire indicator.
The UI & HUD Helpers
Building user interfaces with tables can be tedious. This library provides a suite of helper functions to make it effortless.
smart_text(): Automatically selects black or white text for optimal contrast against any background color.
draw_bar(): Creates a clean, beautiful ASCII progress bar from a simple percentage value.
draw_stars(): Creates a five-star rating visualization.
gradient_color(): A powerful function for creating smooth color transitions.
get_signal_style() & get_zone_style(): High-level functions that return complete styling configurations for signals and support/resistance zones based on your chosen theme.
The Simplicity of Integration: A 4-Step Workflow
The true beauty of the DafeVisualsLib is its simplicity. You can create a stunning, intelligent, and fully functional indicator in just four steps:
Import the library: import YourUsername/DafeVisualsLib/1 as viz
Get your theme: viz.Theme theme = viz.get_theme("Neon")
Calculate your metric: float rsi = ta.rsi(close, 14)
Let the Architect do the work: viz.PlotConfig cfg = viz.auto_config(rsi, "RSI", theme)
Plot the result: plot(cfg.value, cfg.title, cfg.c_core, cfg.width)
In these few lines, the library has automatically analyzed your RSI, determined the market regime, selected the appropriate plot style, calculated a dynamic color gradient with a physics-based glow, and adapted the line width to the current volatility. This is the power of the Architect.
█ CHAPTER 4: DEVELOPMENT PHILOSOPHY
The DafeVisualsLib was born from a desire to democratize elite-level indicator design. For too long, the ability to create beautiful, context-aware, and intuitively designed indicators has been the domain of a select few developers with deep knowledge of both programming and graphic design. This library changes that. It is an open-source tool that encapsulates thousands of hours of research and development into a simple, powerful API.
My philosophy is that a developer's most valuable asset is their idea. They should be free to focus on inventing new, powerful analytical concepts, without getting bogged down in the tedious, repetitive work of building robust visualization and configuration systems from scratch. This library is my contribution to the Pine Script community—a tool for builders, designed to accelerate innovation and elevate the quality of indicators for everyone.
This library embraces that philosophy. It handles immense complexity on the backend to deliver absolute simplicity and elegance on the frontend, both for the developer who uses it and the trader who benefits from it.
█ A NOTE TO USERS & DISCLAIMER
THIS IS A LIBRARY FOR DEVELOPERS: This script does nothing on its own. It is a powerful engine that must be imported and used by other indicator developers in their own scripts. It is a tool for building, not a ready-made indicator.
THE ANALYSIS IS A GUIDE: The analyze() function's classification of data and regimes is based on a robust set of heuristics, but it is a statistical interpretation. It provides a powerful baseline for visualization but is not a substitute for a trader's own judgment.
"Simplicity is the ultimate sophistication."
— Leonardo da Vinci
Taking you to school. - Dskyz, Create with DAFE

Commodity Channel Index - CCI🎯 Overview
This is an enhanced Commodity Channel Index (CCI) indicator that transforms the traditional CCI into a centerline-focused momentum tool with moving average smoothing and comprehensive visual enhancements. Unlike standard CCI which uses ±100 levels, this version focuses on the 50-level centerline for clearer trend direction signals.
🧩 Core Components
1. ⚙️ Technical Foundation
📊 Primary Calculation: Uses TradingView's built-in ta.cci() function
📈 Statistical Approach: Measures current price relative to statistical mean
🎯 Scale Modification: Focuses on 50 as neutral (unlike traditional ±100)
📏 Default Length: 55 periods (optimal for medium-term trends)
2. 🎛️ Configuration Parameters
📏 CCI Length: Default 55 periods
📈 CCI MA Length: 30-period moving average
🔄 MA Type: 6 options (EMA, SMA, RMA, WMA, VWMA, HMA)
🎨 Color Themes: 5 visual schemes matching your other indicators
📈 Signal Interpretation:
🟢 BULLISH: CCI > 50 (price above statistical mean)
🔴 BEARISH: CCI < 50 (price below statistical mean)
👁️ Visual Features
📉 Chart Elements:
📊 Main CCI Line:
Shows raw CCI momentum
📈 Signal Line (CCI MA):
Yellow moving average of CCI
30-period default provides smoothed trend
🎨 Fill Zones:
🟢 Upper Zone : Bullish momentum area
🔴 Lower Zone : Bearish momentum area
📋 Dashboard Display:
Content: "⬆️ Bullish" or "⬇️ Bearish" indicator
Purpose: Instant market bias assessment
⚡ Trading Applications
📈 Primary Uses:
🎯 Trend Direction Identification
CCI > 50 = Uptrend momentum
CCI < 50 = Downtrend momentum
📊 Extreme Momentum Detection
CCI > 100 = Strong bullish (traditional)
CCI < -100 = Strong bearish (traditional)
CCI near ±300 = Extreme conditions
🔄 Mean Reversion Opportunities
Useful in ranging markets
🎯 Signal Types:
📈 Trend-Following: Stay long when CCI > 50, short when < 50
🔄 Mean Reversion: Fade extreme readings (>100 or <-100)
⚡ Crossover Signals: CCI crossing 50 provides entry/exit points
🎨 Customization Options
🔄 Moving Average Types:
📉 EMA: Exponential - responsive to recent CCI changes
📊 SMA: Simple - smooths CCI equally
📈 RMA: Relative - TradingView's special MA
⚖️ WMA: Weighted - emphasizes recent CCI values
💎 VWMA: Volume-weighted - incorporates volume indirectly
🚀 HMA: Hull - reduces lag on CCI signals
🎨 Visual Themes: (Consistent with your suite)
🎨 Classic: Green/Red (traditional)
🚀 Modern: Cyan/Purple (contemporary)
💪 Robust: Amber/Deep Purple (high contrast)
🌈 Accented: Purple/Magenta (vibrant)
⚫⚪ Monochrome: Light Gray/Dark Gray (minimalist)
🔔 Alert System
🟢 LONG Alert: Triggers when CCI > 50
🔴 SHORT Alert: Triggers when CCI < 50
📧 Format: Includes ticker symbol for portfolio tracking
⚡ Key Advantages
✅ Strengths:
🎯 Clear Centerline Focus: 50-level provides unambiguous trend direction
📊 Statistical Foundation: Based on mean deviation (more robust than simple oscillators)
👁️ Extreme Zone Visualization: ±300 boundaries show momentum extremes
🔄 Versatile Application: Works for both trend-following and mean reversion
📱 Professional Suite: Consistent design with your RSI and SMI indicators
⚡ Optimal Settings:
📈 Trending Markets: 55-period CCI (default)
🔄 Ranging Markets: Shorter periods (20-30)
📊 Volatile Markets: Longer periods (80-100)
📱 Day Trading: 20-period with EMA smoothing
🏆 Unique Features:
Statistical Rigor: Based on mean deviation (not just price differences)
Wide Range: ±300 scale captures extreme movements
Centerline Focus: Clear binary trend signals
Visual Harmony: Consistent with your indicator suite design
This CCI indicator provides a statistically robust approach to trend identification while maintaining the visual consistency and user-friendly design of your trading suite! 📊✨

Adaptive Kinetic Ribbon [QuantAlgo]🟢 Overview
The Adaptive Kinetic Ribbon indicator synthesizes price velocity and volatility dynamics to identify trend direction, momentum strength, and acceleration phases across varying market conditions. It combines velocity-based momentum measurement, adaptive volatility weighting, dual-speed ribbon analysis, and acceleration-deceleration detection into a unified visual system that quantifies periods of sustained directional movement and momentum shifts, helping traders and investors identify trend continuation and reversal signals across various timeframes and asset classes.
🟢 How It Works
The indicator's core methodology lies in its adaptive kinetic approach, where velocity and volatility components are calculated dynamically and then smoothed through an adaptive alpha mechanism.
First, Velocity is measured to capture raw directional momentum by calculating the net price change over the lookback period:
velocity = source - source
This creates a momentum vector that quantifies how far and in which direction price has moved, providing the foundation for understanding trend strength and establishing whether the market is in a sustained directional phase.
Then, Volatility is computed to evaluate price variability and market noise by analyzing the standard deviation of bar-to-bar price changes:
volatility = ta.stdev(source - source , length) * mult
The volatility sensitivity multiplier allows traders to adjust how responsive the indicator is to market noise, with higher values creating faster adaptation during volatile periods and lower values maintaining stability during choppy conditions.
Next, Adaptive Alpha is calculated to create a dynamic smoothing coefficient that automatically adjusts based on the relationship between velocity and volatility:
adaptive_alpha = math.abs(velocity) / (math.abs(velocity) + volatility)
This alpha value ranges from 0 to 1, where values closer to 1 indicate strong, clear directional movement (high velocity relative to volatility), causing the indicator to respond quickly, while values closer to 0 indicate noisy, range-bound conditions (high volatility relative to velocity), causing the indicator to smooth more heavily and filter out false signals.
Following this, the Kinetic Line is constructed using exponential smoothing with the adaptive alpha coefficient:
var float kinetic_line = na
kinetic_line := na(kinetic_line ) ? source : kinetic_line + adaptive_alpha * (source - kinetic_line )
This creates an adaptive moving average that automatically adjusts its responsiveness: during strong trends with clear velocity, it tracks price closely like a fast EMA; during choppy, volatile periods, it smooths heavily like a slow SMA, providing optimal trend identification across varying market regimes without manual parameter adjustment.
Then, Ribbon Lines are generated by applying additional moving average smoothing to the kinetic line at two different speeds:
ribbon_fast = ma(kinetic_line, ribbon_fast_length, ma_type)
ribbon_slow = ma(kinetic_line, ribbon_slow_length, ma_type)
The dual-ribbon structure creates a visual envelope around the kinetic line, where the fast ribbon responds quickly to kinetic changes while the slow ribbon provides trend confirmation, with crossovers between these ribbons generating primary trend reversal signals.
Finally, Trend State and Acceleration are determined by analyzing the relative positioning and directional movement of the ribbon lines:
trend_up = ribbon_fast > ribbon_slow
acceleration = ribbon_fast > ribbon_fast
ribbonColor = trend_up ?
acceleration ? bullAccel : bullDecel :
not acceleration ? bearAccel : bearDecel
This creates a four-state classification system that distinguishes between bullish acceleration (uptrend strengthening), bullish deceleration (uptrend weakening), bearish acceleration (downtrend strengthening), and bearish deceleration (downtrend weakening), providing traders with nuanced momentum insights beyond simple bullish/bearish binary signals.
🟢 Signal Interpretation
▶ Bullish Acceleration (Bright Green): Fast ribbon above slow ribbon AND fast ribbon rising, indicating confirmed uptrend with building momentum = Strongest bullish condition, ideal for new long entries, adding to positions, or holding existing longs with confidence
▶ Bullish Deceleration (Dark Green): Fast ribbon above slow ribbon BUT fast ribbon falling, indicating uptrend intact but momentum weakening = Caution signal for longs, potential trend exhaustion developing, consider tightening stops or taking partial profits
▶ Bearish Acceleration (Bright Red): Fast ribbon below slow ribbon AND fast ribbon falling, indicating confirmed downtrend with building momentum = Strongest bearish condition, ideal for new short entries, exiting longs, or maintaining defensive positioning
▶ Bearish Deceleration (Dark Red): Fast ribbon below slow ribbon BUT fast ribbon rising, indicating downtrend intact but momentum weakening = Caution signal for shorts, potential trend exhaustion developing, prepare for possible reversal or consolidation
▶ Bullish Crossover: Fast ribbon crosses above slow ribbon, signaling trend reversal from bearish to bullish and initiation of new upward momentum phase = Primary buy signal, entry opportunity for trend-following strategies, exit signal for short positions
▶ Bearish Crossover: Fast ribbon crosses below slow ribbon, signaling trend reversal from bullish to bearish and initiation of new downward momentum phase = Primary sell signal, entry opportunity for short strategies, exit signal for long positions
▶ Ribbon Spread Width: Distance between fast and slow ribbons indicates trend strength and conviction, where wider spreads suggest strong, sustained directional movement with low reversal probability, while tight or converging ribbons indicate weak trends, consolidation, or impending reversal conditions
▶ Bar Color Alignment: When bar coloring is enabled, candlestick colors mirror the ribbon state providing immediate visual confirmation of momentum conditions directly on price action, eliminating the need to reference the indicator separately and enabling faster decision-making during active trading
🟢 Features
▶ Preconfigured Presets: Three optimized parameter configurations accommodate different trading styles, timeframes, and market analysis approaches: "Default" provides balanced trend identification suitable for swing trading on 4-hour and daily charts, "Fast Response" delivers heightened sensitivity optimized for intraday trading and scalping on 5-minute to 1-hour charts, and "Smooth Trend" offers conservative trend identification ideal for position trading and long-term analysis on daily to weekly charts.
▶ Built-in Alerts: Three alert conditions enable comprehensive automated monitoring of trend reversals and momentum transitions. "Bullish Crossover" triggers when the fast ribbon crosses above the slow ribbon, signaling the shift from downtrend to uptrend and the beginning of bullish momentum building. "Bearish Crossover" activates when the fast ribbon crosses below the slow ribbon, signaling the shift from uptrend to downtrend and the beginning of bearish momentum building. "Any Ribbon Crossover" provides a combined notification for either bullish or bearish crossover regardless of direction, useful for general trend reversal monitoring and ensuring no momentum shift goes unnoticed.
▶ Color Customization: Six visual themes (Classic, Aqua, Cosmic, Cyber, Neon, plus Custom) accommodate different chart backgrounds and visual preferences, ensuring optimal contrast and immediate identification of acceleration versus deceleration states across various devices and screen sizes. Each preset uses distinct colors for the four momentum states (bullish acceleration, bullish deceleration, bearish acceleration, bearish deceleration) with proper visual hierarchy. Optional bar coloring with adjustable transparency provides instant visual context of current momentum state and trend direction without switching between the price pane and indicator pane, enabling traders and investors to immediately assess trend positioning and acceleration dynamics while analyzing price action patterns and support/resistance levels.

MA Smart SyncMA Smart Sync determines the market bias by evaluating the price position relative to a moving average channel on four independent timeframes and returning a confluence signal when a configurable number of them agree.
Unlike standard MTF trend indicators that rely on EMA crossovers or slope direction, this script builds a channel around each timeframe and classifies price into three discrete zones: above, below, or inside. The "inside" state acts as a neutral filter, preventing false confluence signals during consolidation — a key distinction from binary up/down dashboards.
The channel itself can be constructed using five different methods selectable from a single input: High/Low MA (separate MAs applied to high and low), Close ± ATR, Close ± Standard Deviation, Close ± percentage offset, or classic Bollinger Bands. All five use the same MA type and length inputs, making it straightforward to compare how different volatility envelopes behave on the same instrument without rebuilding the indicator.
How to use:
— Set four timeframes matching your trading plan (defaults: 15m, 1h, 4h, D).
— Choose the channel method that fits your instrument's volatility profile. ATR-based channels adapt well to forex; StdDev and Bollinger suit equities and indices.
— Set "Minimum Confluence" to 3 or 4. A value of 4 means all timeframes must agree before a signal fires.
— The background color and arrow labels update only when bias changes, keeping the chart clean.
— Use the status table (top-right) to monitor each timeframe independently and identify which TFs are lagging.

SENTINEL CORE by Pipsomnian🛡️ Sentinel Core — Learning Mode (Structure & Probability Engine)
by Pipsomnian
Sentinel Core is the core structure and probability framework within the Sentinel ecosystem.
It is designed to help traders move beyond binary signals and learn how to grade market environments based on structure, momentum, and session quality.
This tool does not predict price.
It evaluates context.
🎯 What Sentinel Core Is
Sentinel Core is an EMA-structured learning and decision-grading indicator built to train:
• Trend alignment
• Pullback behavior
• Market structure continuation
• Session discipline (London & New York)
• Probability stacking
Instead of asking “Is there a signal?”,
Sentinel Core trains you to ask:
“How strong is this setup?”
🧠 The Scoring Concept
Each potential setup is evaluated using multiple structural components:
• EMA trend alignment
• Pullback to value
• Strong candle confirmation
• Market structure continuation
• Active trading session
The result is a setup quality grade:
• A+ → Full structural alignment
• B → Strong but incomplete alignment
Lower-quality environments are intentionally ignored.
This encourages patience, selectivity, and discipline.
🟢 Who Sentinel Core Is For
Sentinel Core is designed for traders who:
• Already understand basic EMA structure
• Want fewer, higher-quality setups
• Trade session-based markets (especially Gold)
• Value discipline over frequency
• Want to develop judgment, not dependency
🚫 What Sentinel Core Is NOT
Sentinel Core is not:
• A signal service
• An automated strategy
• A promise of profitability
• A replacement for risk management
• A shortcut to consistency
Execution, risk control, and psychology remain your responsibility.
⏱️ Recommended Use
• Timeframe: 5-Minute
• Markets: XAUUSD (Gold), major FX, liquid indices
• Sessions: London & New York
EMAs are used for structure and context, not prediction.
🧭 Position in the Sentinel Framework
• Sentinel Lite — Learn structure & discipline
• Sentinel Core — Grade probability & judgment
• Sentinel A+ — Refine timing & precision
• Sentinel Gold Standard — Execute with control
⚠️ Educational use only. No financial advice.
— Pipsomnian

Tanh Clamped Momentum Oscillator [Alpha Extract]A sophisticated momentum measurement system that combines dual EMA trend analysis with volatility-weighted pressure calculations, applying hyperbolic tangent normalization for bounded oscillator output with adaptive signal generation. Utilizing ATR-based volatility regime detection and candle pressure metrics, this indicator delivers institutional-grade momentum assessment with multi-tiered band structure and pulse-based envelope visualization. The system's tanh clamping methodology prevents extreme outliers while maintaining sensitivity to genuine momentum shifts, combined with histogram divergence detection and comprehensive alert framework for high-probability reversal and continuation signals.
🔶 Advanced Dual-Component Momentum Engine
Implements hybrid calculation combining EMA trend differential with candle pressure analysis, weighted by volatility regime assessment for context-aware momentum measurement. The system calculates fast and slow EMA difference normalized by ATR, measures intrabar pressure as close-open relative to range, applies volatility-based weighting between trend and pressure components, and produces composite raw momentum capturing both directional bias and internal candle dynamics.
// Core Momentum Framework
EMA_Fast = ta.ema(src, Fast_Length)
EMA_Slow = ta.ema(src, Slow_Length)
Trend = EMA_Fast - EMA_Slow
// Volatility Regime Detection
ATR_Short = ta.atr(ATR_Length)
ATR_Long = ta.atr(ATR_Length * 2)
Vol_Ratio = ATR_Short / ATR_Long
Vol_Weight = clamp((Vol_Ratio - 0.5) / 1.0, 0, 1)
// Pressure Component
Pressure = (close - open) / (high - low)
// Composite Momentum
Raw = Trend_Normalized * Vol_Weight + Pressure_Scaled * (1 - Vol_Weight)
🔶 Hyperbolic Tangent Normalization Framework
Features sophisticated tanh transformation that clamps raw momentum into bounded range while preserving proportional sensitivity across varying market conditions. The system applies safe exponential calculations with input capping to prevent overflow, computes hyperbolic tangent to compress extreme values while maintaining linearity near zero, and scales output by configurable factor creating oscillator with enhanced dynamic range and reduced outlier distortion.
// Tanh Clamping Logic
tanh(x) =>
x_clamped = clamp(x, -5.0, 5.0)
e = exp(2.0 * x_clamped)
(e - 1.0) / (e + 1.0)
Oscillator = tanh(Smoothed_Momentum / Clamp_Factor) * Scale
🔶 Volatility Regime Weighting System
Implements intelligent volatility assessment comparing short-term and long-term ATR to determine market regime, dynamically adjusting weight between trend and pressure components. The system calculates ATR ratio, normalizes to 0-1 range, and uses this weight factor to emphasize trend component during high-volatility regimes and pressure component during low-volatility consolidations, creating adaptive momentum sensitive to market microstructure.
🔶 Multi-Tiered Band Architecture
Provides comprehensive threshold structure with soft, hard, and maximum bands marking progressive momentum extremes for graduated overbought/oversold assessment. The system establishes configurable levels at soft zones (initial caution), hard zones (strong extreme), and maximum zones (critical overextension) with visual differentiation through line styles and background highlighting, enabling nuanced interpretation beyond binary extreme detection.
🔶 Pulse Envelope Visualization
Features dynamic envelope bands calculated from exponential moving average of absolute oscillator value, creating adaptive boundary that expands during momentum acceleration and contracts during deceleration. The system applies configurable length and width multiplier to pulse calculation, fills area between positive and negative pulse bounds with gradient coloring matching oscillator direction, providing visual context for momentum magnitude relative to recent activity.
🔶 Signal Line Integration Framework
Implements dual-mode signal line supporting both EMA and SMA smoothing of primary oscillator for crossover-based swing detection. The system calculates configurable-length moving average, generates histogram differential between oscillator and signal, applies additional smoothing to histogram for noise reduction, and uses crossovers/crossunders as momentum swing indicators distinguishing bullish and bearish momentum shifts.
🔶 Histogram Divergence Display
Creates column-style histogram visualization showing oscillator-signal differential with intensity-based coloring reflecting momentum acceleration or deceleration. The system plots histogram bars in bright colors when expanding (accelerating momentum) and faded colors when contracting (decelerating momentum), enabling instant visual identification of momentum divergences and convergences without numerical analysis.
🔶 Advanced Reversion Signal Logic
Generates overbought/oversold signals requiring both signal line crossover and extreme threshold breach for high-conviction reversal identification. The system triggers oversold when oscillator crosses above signal while below negative reversion level, triggers overbought when crossing below signal while above positive reversion level, and plots small circle markers at signal locations for clear visual confirmation of setup conditions.
🔶 Comprehensive Alert Framework
Provides six distinct alert conditions covering overbought/oversold reversions, midline trend changes, and oscillator-signal swings with configurable notification preferences. The system includes alerts for extreme reversions (OB/OS), zero-line crossovers (trend changes), and signal line crossovers (momentum swings), enabling traders to monitor critical oscillator events across multiple signal types without constant chart observation.
🔶 Adaptive Bar Coloring System
Implements four coloring modes including midline cross (trend direction), extremities (threshold breach), reversions (OB/OS signals), and slope (oscillator vs signal) for customizable visual integration. The system applies selected color scheme to candles providing chart-level momentum feedback, with option to disable coloring for minimal visual interference while maintaining oscillator pane analysis.
🔶 Performance Optimization Architecture
Utilizes efficient tanh calculation with safe clamping, streamlined EMA computations, and optimized ATR ratio processing for smooth real-time updates. The system includes intelligent null handling, minimal recalculation overhead through smart smoothing application, and configurable display toggles allowing users to disable unused visual elements for enhanced performance during extended historical analysis.
🔶 Why Choose Tanh-Clamped Momentum Oscillator ?
This indicator delivers sophisticated momentum analysis through hybrid trend-pressure calculation with volatility-adaptive weighting and hyperbolic tangent normalization. Unlike traditional momentum oscillators susceptible to extreme outlier distortion, the tanh clamping ensures bounded output while preserving sensitivity to genuine momentum shifts. The system's dual-component architecture combining directional trend with intrabar pressure, weighted by volatility regime assessment, creates context-aware momentum measurement that adapts to market microstructure. The multi-tiered band structure, pulse envelope visualization, and comprehensive signal framework make it essential for traders seeking nuanced momentum analysis with graduated extreme detection and high-probability reversal signals across cryptocurrency, forex, and equity markets.
