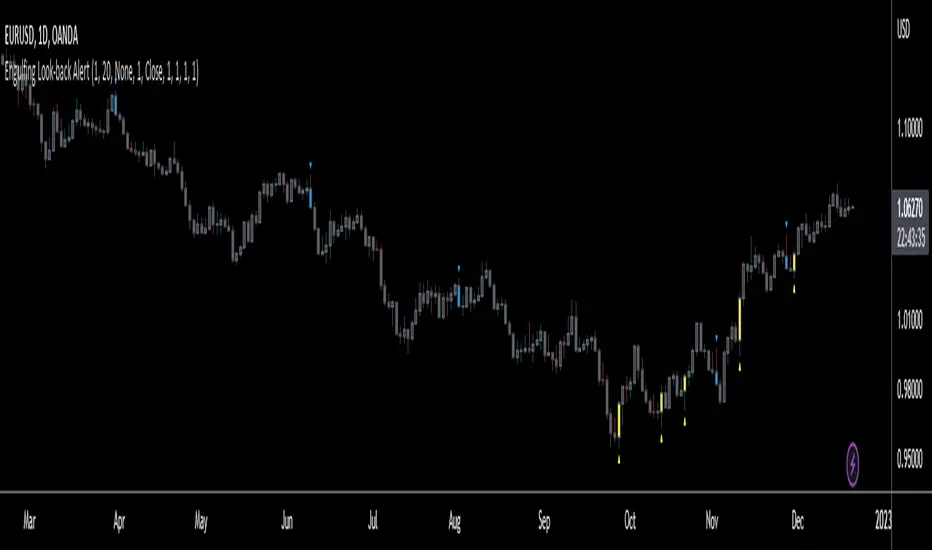
Engulfing Look-back AlertThis script is an extension of the classical engulf pattern with added rules and user defined features.
Engulfing Candle Definition:
- Bullish Engulfing: Trade BELOW the prior candle's LOW and CLOSE ABOVE the prior candle's HIGH. Previous candle can be an up (bullish) or a down (bearish) candle
- Bearish Engulfing: Trade ABOVE the prior candle’s HIGH and CLOSE BELOW the prior candle’s LOW. Previous candle can be an up (bullish) or a down (bearish) candle
Features:
- Set the look-back period for engulfing candle high and low -> default = 1; e.g. Did the bullish eng candle trade below the lows of the last 3 candles and trade above the highs of the last 4 candles? Set the input values accordingly
- Choose time frame(s) engulfing candle is to be displayed on -> default = M/W/D/4H/1H/15M
- Ability to enable Alerts (includes time frame alert was triggered on): IMPORTANT - when setting alerts ensure to choose "ONCE PER BAR"; otherwise alerts will NOT trigger as intended
prntscr.com
Buscar en scripts para "bear"
Red and Green Ignored Bar by Oliver VelezOn this occasion I present a script that detects Ignored Red Candles and Ignored Green Candles, basically it is a Price Action event that indicates a possible continuation of the current trend and gives the opportunity to climb it with a Very tight risk, before delving into detail I would like to leave this note:
Note: the detection of this event does not guarantee that the signal will be good, the trader must have the ability to determine its quality based on aspects such as trend, maturity, support / resistance levels, expansion / contraction of the market, risk / benefit, etc, if you do not have knowledge about this you should not use this indicator since using it without a robust trading plan and experience could cause you to partially or totally lose your money, if this is your case you should train before If you try to extract money from the market, this script was created to be another tool in your trading plan in order to configure the rules at your discretion, execute them consistently and have AUTOMATIC ALERTS when the event occurs, which is where I find more value because you can have many instruments waiting for the event to be generated, in the time frame you want and without having to observe the mer When the alert is generated, the Trader should evaluate the quality of the alert and define whether or not to execute it (higher timeframes, they can give you more time to execute the operation correctly).
Let's continue….
This event was created by Oliver Velez recognized trader / mentor of price action, the event has a very interesting particularity since it allows to take a position with a very limited risk in trend movements, this achieves favorable operations of good ratio and small losses when taking An adjusted risk, if the trade works, a good ratio is quickly achieved and we agree with a key point in the “Keep small losses and big profits” trading, this makes it easier to have a positive mathematical hope when your level of Success is not very high, so leave you in the field of profitability.
THE EVENT:
The event has a bullish configuration (Ignored Red Candle) and a bearish configuration (Ignored Green Candle), below I detail the “Hard” rules (later I explain why “Hard”):
1- Last 3 bars have to be GREEN-RED-GREEN (possible bullish configuration) or RED-GREEN-RED (possible bearish configuration), the first bar is called Control Bar, the second is called Ignored Bar and the third Signal Bar as shown in the following image:
2- Be in a trend determined by simple moving averages (Slow of 20 periods and Fast of 8 periods), as a general rule you can take the direction of MA20 but the Trader has to determine if there is a trend movement or not.
3- Control bar of good range, little tail and with a body greater than 55%.
4- Ignored bar preferably narrow range, little tail and that is located in the upper 1/3 of the control bar.
5- Signal bar cannot override the minimum of the ignored bar.
6- Activation / Confirmation of event by means of signal bar in overcoming the body of the ignored bar.
Some examples of ignored bars (with “Hard” and “Flexible” rules):
Features and configuration of the indicator:
To access the indicator settings, press the wheel next to the indicator name VVI_VRI "Configuration options".
- Operation mode (Filtering Type):
• Filtering Complete: all filters activated according to the configuration below.
• Without Filtering: all filters deactivated, all VRI / VVI are displayed without any selection criteria.
• Trend Filter only: shows only VRI / VVI that are in accordance with what is set in “Trend Settings”
- Configuration Moving Averages:
• See Slow Media: slow moving average display with direction detection and color change.
• See Fast Media: display of fast moving average with direction detection and color change.
• Type: possibility to choose the type of media: DEMA, EMA, HullMA, SMA, SSMA, SSMA, TEMA, TMA, VWMA, WMA, ZEMA)
• Period: number of previous bars.
• Source: possibility to choose the type of source, open, close, high, low, hl2 hlc3, ohlc4.
• Reaction: this configuration affects the color change before a change of direction, 1 being an immediate reaction and higher values, a more delayed reaction obtaining les false "changes of direction", a value of 3 filters the direction quite well.
- Trend Configuration
• Uptrend Condition P / VRI: possibility to select any of these conditions:
o Bullish MA direction
o Quick bullish MA direction
o Slow and fast bullish MA direction
o Price higher than slow MA
o Price higher than fast MA
o Price higher than slow and fast MA
o Price higher than slow MA and bullish direction
o Price higher than fast MA and bullish direction
o Price higher than slow, fast MA and bullish direction
o No condition
• Condition P / VVI bear trend: possibility of selecting any of these conditions:
o Slow bearish MA direction
o Fast bearish MA direction
o Slow and fast bearish MA direction
o Price less than slow MA
o Price less than fast MA
o Price less than slow and fast MA
o Price lower than slow MA and bearish direction
o Price less than fast MA and bearish direction
o Price less than slow, fast MA and bearish direction
o No condition
- Control bar configuration
• Minimum body percentage%: possibility to select what body percentage the bar must have.
• Paint control bar: when selected, paint the control bar.
• See control bar label: when selected, a label with the legend BC is plotted.
- Configuration bar ignored
• Above X% of the control bar: possibility to select above what percentage of the control bar the ignored bar must be located.
• Paint ignored bar: when selected, paint the ignored bar.
- Signal bar configuration
• You cannot override the minimum of the ignored bar: when selected, the condition is added that the signal bar cannot override the minimum of the ignored bar.
• Paint signal bar: when selected, paint the signal bar.
• See arrow: when selected it shows the direction arrow of the possible movement.
• See bear and arrow: when selected it shows bear and arrow label
• See bull and arrow: when selected it shows bull and arrow label
The following image shows the ignored bar and painted signal:
- Take profit / loss
The profit / loss taking varies depending on the trader and its risk / monetary plan, the proposal is a recommendation based on the nature of the event that is to have a small risk unit (stop below the minimum of the ignored bar), look for objectives in ratios greater than 2: 1 and eliminate the risk in 1: 1 by taking the stop to BE, all parameters are configurable and are the following:
• See recommended stop loss and take profit: trace the levels of Stop, BE, TP1 and TP2, as well as their prices to know them quickly based on the assumed risk
• To: select which event you want to draw the SL and TP (VRI, VVI)
• Extend stop loss line x bars: allows extending the stop line by x number of bars
• Extend take profit line x bars: allows extending the stop line by x number of bars
• Ratio to move to break even: allows you to select the minimum ratio to move stop to break even (default 1: 1)
• Take profit 1 ratio: allows you to select the ratio for take profit 1 (default 2: 1)
• Take profit 2 ratio: allows you to select the ratio for take profit 2 (default 4: 1)
- Alerts
• It is possible to configure the following alerts:
-VRI DETECTED
-VVI DETECTED
-VRI / VVI DETECTED
Final Notes:
- The term hard rules refers to the fact that an event is sought with the rules detailed above to obtain a high quality event but this brings 2 situations to consider, less
number of events and events that are generated in a strong impulse may be leaked, a very large control bar followed by an ignored narrow body away from moving averages, despite having a good chance of continuing, taking a stop very tight in a strong impulse you can touch it by the simple fact of the own volatility at that time.
- The setting of the parameters “Minimum body percentage% (control bar)”, “Above x% of the control bar (bar ignored)” and “Cannot override the minimum of the ignored bar” can bring large Benefits in terms of number of events and that can also be of high quality, feel free to find the best configuration for your instrument to operate.
- It is recommended to look for trending events, near moving averages and at an early stage of it.
- The display of several nearby VRIs or VVIs in an advanced trend may indicate a depletion of it.
- The alerts can be worked in 2 ways: at the closing of the candle (confirms event but the risk unit may be larger or smaller) or immediately the body of the ignored bar is exceeded, in case you are operating from the mobile and miss many events because of the short time I recommend that you operate in a superior time frame to have more time.
- The indicator is configured with “flexible” rules to have more events, but without any important criteria, each trader has to look for the best configuration that suits his instrument.
- It is recommended to partially close the operation based on the ratio and always keep a part of the position to apply manual trailing stop and try to maximize profits.
The code is open feel free to use and modify it, a mention in credits is appreciated.
If you liked this SCRIPT THUMB UP!
Greetings to all, I wish you much green!

Bulls vs BearsA tool with the purpose for better insight of bulls/bears influence.
The center, more bright part are the open-close prices, filled green if bullish, red if bearish.
The transparent red and green part, above and below, are the "wick/shadow" area's.
If for example the bears push the price down, far under the open, but the bulls push it right back, so you'll have a large wick,
this will be visible as a large transparent green area below the brighter open-close center area.
Hope this helps!
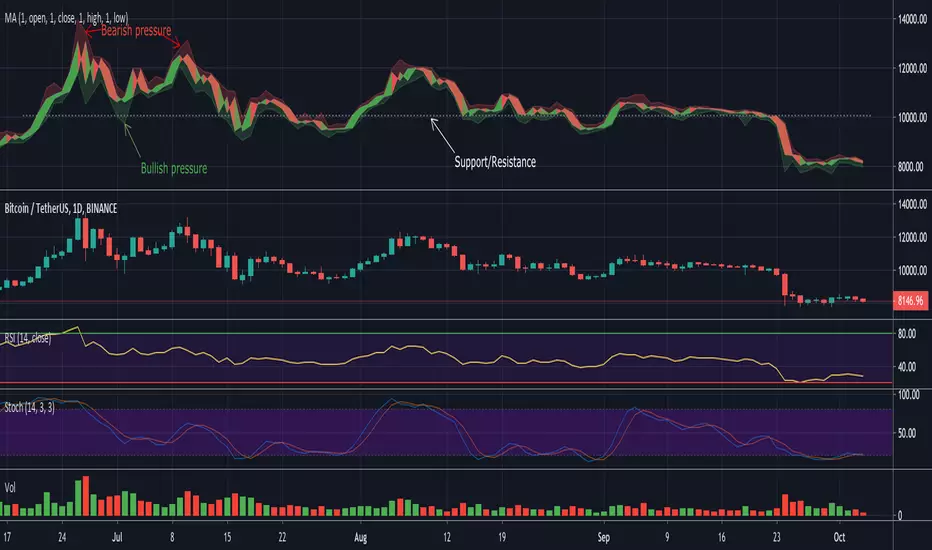
Modiied Elder Ray Index(Bull or Bear)Here's a modified version of the Elder Ray Index created by the famed Dr.Alexander Elder. This indicator has proven to be especially helpful lately given the crazy state of crypto.
Slow Moving Average :
The top chart shows the moving average used to filter trends. I recommend using a higher window length(can be adjusted with the 'lenSlowMA' input option). I wanted this to be a very smooth moving average, so I used the following formula:
slow MA = ema(vwma(close, 64), 64)
This resulted in a pretty smooth line that still detects major price movements very well.
-The background and bar colors both change in response to the Slow MA's value. The background and bars change to green when a bullish trend is detected and red when bearish.
Bear and Bull Power :
To balance things out a little, I included two histogram's based on Elder's Ray. Here, a more responsive EMA with a shorter window length is used to calculate the bull and bear power values and track short-term price fluctuations.
NOTE: The length of the EMA used here can be adjusted in the input menu.
Bull Power = current high - EMA(close, 13)
Bear Power = current low - EMA(close, 13)

Bull/Bear CandleThis script will display a small triangle under the latest two candles to indicate whether that candle is bullish or bearish based on the following definition.
A bullish candle closes in the top portion of the trading range of the candle while a bearish candle closes in the bottom portion of the trading range of the candle.
The cutoff is currently set at 65% (you can adjust it) so the close must be outside or equal to 65% of the trading range to be considered bullish or bearish. If less than 65% the triangle will indicate a neutral candle.
Colours are;
green triangle = bullish candle
red triangle = bearish candle
yellow triangle = neutral candle
I hope this helps those using TraderCobb's cradle strategy.
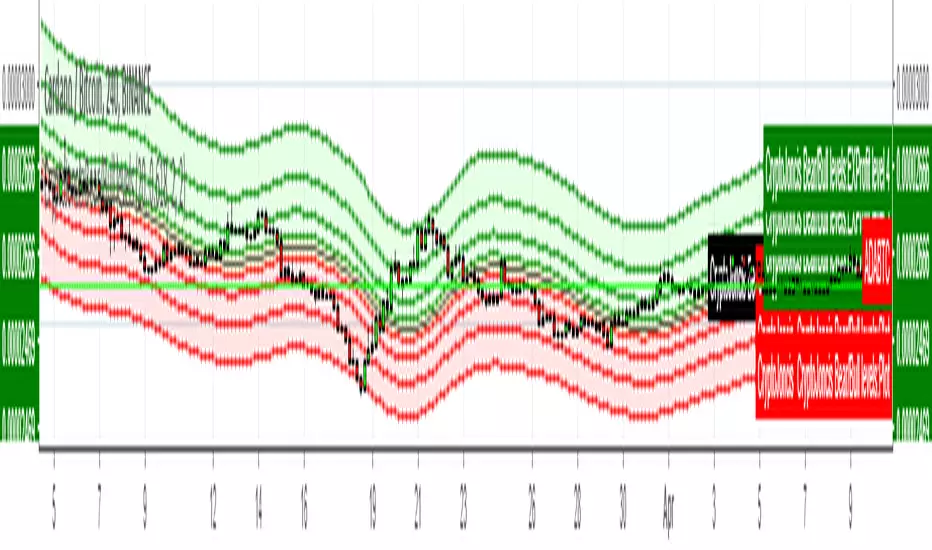
CryptoJoncis Bear/Bull levelsSimple as this, while price is in the yellow field, it is in indecision, if it's in the red fields, the trend is bearish. If the price reaches bear level 4, there is a high possibility that it will jump to the Bull level 4.
If the price is in the green field, it gives you an indication that it's bull trend. If price reaches bull level 4, there is high possibility that it will retrace.
If this is helpful for you, consider a tip
BTC: 3FiBnveHo3YW6DSiPEmoCFCyCnsrWS3JBR
ETH: 0xac290B4A721f5ef75b0971F1102e01E1942A4578
Roboballs42 Auto Bull/Bear Flag (ZigZag) + Targets [Parallel]Roboballs42 • Auto Bull/Bear Flag (ZigZag) + Targets automatically detects bull flags and bear flags using a ZigZag-style pivot engine, draws a parallel flag channel anchored back to the flagpole (xB), and projects the channel only a limited number of bars into the future (no infinite rays).
While a flag is active, the script shows a live breakout arrow as soon as price breaks the channel intrabar. Once the breakout confirms, the arrow locks at the breakout candle and the flag is considered complete. Patterns that get invalidated (price breaks the “wrong side” of the flag) are automatically deleted to keep the chart clean.
If you enjoy this indicator and want to support the project, BTC donations are appreciated:
bc1qvda8daynuqhpx8e9g07ddyelhpmv4ja5wc9cmm
Key Features
Auto Bull Flags + Bear Flags
Parallel channel that extends left to the flagpole (no incomplete flags)
Limited forward projection (Projection bars) to avoid endless lines
Live breakout arrow (realtime) + locked arrow on confirmation
Measured-move target plotted on confirmed breakout
Invalidation cleanup (delete patterns when price violates the wrong side)
Custom controls: pivot sensitivity, pole size (ATR), flag depth %, max flag length, touch tolerance, breakout type, invalidation type, and memory limits
Notes
“Early pivots” can repaint like a standard fast ZigZag.
This indicator is a pattern-visualization tool, not financial advice.

Bull/Bear Volume DiagramOverview
This indicator displays trading volume in a mirrored diagram that separates bullish and bearish activity. Bullish candle volume is plotted above the center line, while bearish candle volume is plotted below it. This layout helps visualize market participation and directional pressure in a more intuitive way than traditional volume histograms.
How It Works
The indicator evaluates each candle and determines whether it is bullish or bearish based on its open and close prices:
If the candle closes above its open, its volume is plotted upward.
If the candle closes below its open, its volume is plotted downward.
Each side is color-coded independently to clearly distinguish buying and selling pressure.
Additionally, the indicator calculates a moving average of volume separately for bullish and bearish candles. These averages help identify trends in directional volume strength and allow traders to compare buyer versus seller dominance over time.
Features
Mirrored bullish and bearish volume visualization
Independent color customization for bullish and bearish volume
Directional volume moving averages
Clear separation of buying and selling activity
Lightweight and responsive calculation
How To Use
This indicator can help traders:
Identify which side of the market is dominating volume
Detect shifts in buying or selling pressure
Compare momentum between bullish and bearish participation
Observe volume trends more clearly than with standard volume bars
Notes
Volume is classified using candle direction, not order flow or tick data.
Results may vary depending on timeframe and market type.
This indicator is intended as a visual analysis tool and should be combined with other technical analysis methods.

ROC-WMA bull bear indicatorROC-Weighted MA Oscillator
By Ludovic B
Modified source code of SeerQuant
The ROC-Weighted MA Oscillator (ROCWMA) is a momentum-driven oscillator designed to expose hidden acceleration and deceleration phases in price action by dynamically weighting a moving average with the normalized Rate of Change (ROC).
Instead of treating all price deviations equally, this indicator amplifies meaningful moves and suppresses low-energy noise, making it particularly effective in scalping, intraday trading, and momentum reversals.
🔧 Core Concept
A base moving average (SMA, EMA, TEMA, DEMA, HMA, ALMA, etc.)
Weighted by normalized ROC
Transformed into a Z-score oscillator for comparability across assets
Smoothed with a signal line for timing precision
Result: a context-aware oscillator that adapts to market intensity.
📊 What the Oscillator Shows
Bullish momentum when histogram is positive and expanding
Bearish momentum when histogram is negative and expanding
Neutral zone to filter chop and avoid over-trading
Automatic color logic to highlight regime changes
Optional candle coloring reflects the active momentum state.
🎯 Signal-Based Price Markers (Advanced Feature)
This script includes price-chart markers when:
The signal line retraces to X% of the maximum oscillator bar of the current momentum phase
AND the signal slope confirms exhaustion (rising or falling)
Key characteristics:
Adaptive thresholds (relative, not fixed)
Separate logic for bullish and bearish phases
Reset on each neutral-zone transition
Configurable number of markers per momentum cycle
This makes the indicator particularly useful for:
Pullback entries
Momentum fading
Timing partial exits
⚙️ Customization
Fully adjustable ROC length, MA type, signal length
Neutral zone threshold control
Multiple color schemes
Optional candle coloring
Adaptive signal-to-oscillator percentage logic
🧠 Best Use Cases
Scalping (M1–M5)
Intraday momentum confirmation
Pullback and exhaustion detection
Cross-asset trading (FX, indices, crypto, metals)
ROCWMA is not a lagging oscillator.
It is a momentum intensity detector built to reveal when price moves matter.

ROC-WMA bull bear indicatorROC-Weighted MA Oscillator
based on Seequant indicator
The ROC-Weighted MA Oscillator (ROCWMA) is a momentum-driven oscillator designed to expose hidden acceleration and deceleration phases in price action by dynamically weighting a moving average with the normalized Rate of Change (ROC).
Instead of treating all price deviations equally, this indicator amplifies meaningful moves and suppresses low-energy noise, making it particularly effective in scalping, intraday trading, and momentum reversals.
🔧 Core Concept
A base moving average (SMA, EMA, TEMA, DEMA, HMA, ALMA, etc.)
Weighted by normalized ROC
Transformed into a Z-score oscillator for comparability across assets
Smoothed with a signal line for timing precision
Result: a context-aware oscillator that adapts to market intensity.
📊 What the Oscillator Shows
Bullish momentum when histogram is positive and expanding
Bearish momentum when histogram is negative and expanding
Neutral zone to filter chop and avoid over-trading
Automatic color logic to highlight regime changes
Optional candle coloring reflects the active momentum state.
🎯 Signal-Based Price Markers (Advanced Feature)
This script includes price-chart markers when:
The signal line retraces to X% of the maximum oscillator bar of the current momentum phase
AND the signal slope confirms exhaustion (rising or falling)
Key characteristics:
Adaptive thresholds (relative, not fixed)
Separate logic for bullish and bearish phases
Reset on each neutral-zone transition
Configurable number of markers per momentum cycle
This makes the indicator particularly useful for:
Pullback entries
Momentum fading
Timing partial exits
⚙️ Customization
Fully adjustable ROC length, MA type, signal length
Neutral zone threshold control
Multiple color schemes
Optional candle coloring
Adaptive signal-to-oscillator percentage logic
🧠 Best Use Cases
Scalping (M1–M5)
Intraday momentum confirmation
Pullback and exhaustion detection
Cross-asset trading (FX, indices, crypto, metals)
ROCWMA is not a lagging oscillator.
It is a momentum intensity detector built to reveal when price moves matter.

Bullish/Bearish Trend OscillatorThis oscillator compresses multiple trend signals into a single 0–100 gauge (50 = neutral). It combines:
Fast trend alignment (SMA stack + MACD)
Distance from SMA20 and SMA200 (stronger bear weighting below)
SMMA channel position
Trend line channel position
Price momentum (bar‑to‑bar change)
Volume ratio (green vs red candle weight)
The result is a smoothed, step‑colored trend score that highlights bullish vs bearish pressure and helps identify trend strength changes over time.
Note:
This is an educational indicator and not financial advice.

BBP Oscillator V1 + Multiple Time FrameBull Bear Power + HTF/LTF Filter (BBP+)
Overview:
BBP+ is a minimalist Bull Bear Power histogram designed to help traders identify potential bearish signals while filtering them with current and higher timeframe trends. An optional lower timeframe (LTF) filter can further reduce false signals, without displaying extra markers on the chart.
Inputs:
BBP Length: EMA length for BBP calculation (smaller → more sensitive, larger → smoother).
EMA Trend (Current TF): Current timeframe trend filter (signals only when bearish).
HTF Timeframe & EMA: Higher timeframe trend filter (optional).
Enable HTF Filter: Toggle HTF trend filter.
LTF Timeframe & Enable LTF Filter: Optional filter to reduce false signals; no visual output.
Show Signals: Toggle to show/hide main bearish signals.
Signal Logic:
Main bearish signals appear when:
Current trend is bearish
BBP momentum is decreasing
Optional HTF trend filter passes
Optional LTF momentum filter passes
Important Notes
Indicator is not a guaranteed profit tool; use for analysis only.
Past performance does not indicate future results.
LTF filter does not appear visually, only helps filter main signals.
Adjust BBP Length, EMA Trend, and HTF/LTF settings according to market volatility and timeframe.

Weekly EMA Squeeze (Bullish + Bearish)Purpose
The Weekly EMA Squeeze indicator identifies periods where price is compressing tightly around a cluster of weekly EMAs and then flags when that compression resolves with directional bias. It is designed to surface high-timeframe inflection points where trends are most likely to begin or meaningfully change.
This indicator operates entirely on weekly data, even when viewed on lower timeframes.
________________________________________
Core Components
1. Weekly EMA Cluster
• Uses three weekly EMAs (fast / mid / slow)
• Compression is defined by:
o Tight EMA spread
o Reduced weekly volatility (ATR contraction)
• Represents balance and indecision at a higher timeframe
2. Bullish Weekly EMA Squeeze
Triggered when:
• EMAs are tightly compressed
• Price is holding above or within the EMA cluster
• EMA slopes flatten or turn upward (optional filter)
• Optional requirement: weekly close above EMA cluster
Displayed as:
• Green upward triangles
• Green vertical shaded band marking the squeeze event window
3. Bearish Weekly EMA Squeeze
Triggered when:
• EMAs are tightly compressed
• Price is holding below or within the EMA cluster
• EMA slopes flatten or turn downward (optional filter)
• Optional requirement: weekly close below EMA cluster
Displayed as:
• Red downward triangles
• Red vertical shaded band marking the squeeze event window
4. Vertical Shaded Event Bands
• Each squeeze event (bull or bear) is visually marked with a vertical shaded region
• Shading appears on every qualifying event, including consecutive ones
• Purpose: clearly identify when the market entered a compressed, directional decision state
________________________________________
What the Indicator Is Signaling
• Compression + directional bias, not immediate breakouts
• Transition points between:
o Range → trend
o Trend → reversal
o Trend → re-acceleration after consolidation
This indicator does not attempt to predict magnitude — it identifies timing and regime change risk.
________________________________________
How to Use It
Best used for:
• High-timeframe bias setting
• Filtering lower-timeframe signals
• Identifying when to stop fading price
• Recognizing when volatility expansion is likely
Typical interpretations:
• Bullish squeeze → bias shifts upward; favor long exposure
• Bearish squeeze → bias shifts downward; favor defensive or short exposure
• Multiple squeezes in same direction → trend reinforcement
• Rapid bull ↔ bear flips → higher-timeframe indecision
________________________________________
What It Is Not
• Not an entry trigger by itself
• Not a momentum oscillator
• Not a replacement for breakout confirmation
This indicator answers:
“Is the weekly market coiling, and in which direction is pressure building?”

Bullish, Bearish, & Normal RSI1. Identifying "True" Momentum (The Aqua/Fuchsia Logic)The most useful part of this script is the comparison between the three lines.Bullish Conviction (Aqua): When both the Bullish and Bearish lines are above the Normal RSI, it suggests that even on "down" candles (red candles), the price isn't losing significant ground. The overall structure is buoyant.Bearish Conviction (Fuchsia): When both are below the Normal RSI, it indicates that even when you get "up" candles (green candles), they lack the strength to lift the average momentum. The sellers are effectively "smothering" the bounces.
2. Spotting Hidden Weakness/Strength (Spread Analysis)The "Spread" (the gap between rsiBull and rsiBear) provides a unique utility:ScenarioInterpretationUtilityWide SpreadHigh volatility and indecision. Green candles are very strong, but red candles are also very weak.Avoid trend-following; wait for a "squeeze" or narrowing.Tight SpreadHigh agreement in price action. Most candles are moving in a similar direction or with similar intensity.Great for identifying stable, trending moves with low noise.Bull/Bear CrossIf the Bullish RSI crosses above the Bearish RSI significantly.Can act as an early entry signal before the Standard RSI hits the 50-midline.
3. Practical Strategy Use CasesFilter for Breakouts: If you see a price breakout but the RSI color remains Gray, the move might lack "conviction." You ideally want to see the color flip to Aqua (for long) or Fuchsia (for short) as the breakout occurs.Exhaustion Signal: If the Normal RSI is overbought ($>70$) but the rsiBull begins to dip toward the rsiNormal, it suggests that the "green candle strength" is waning even if the price is staying high—a potential warning of a reversal.Potential Drawbacks to WatchLag: Like all RSI-based indicators, this is lagging. Because you are using a 14-period lookback on three different calculations, it may take a few bars to confirm a sentiment shift.Whipsaw in Sideways Markets: In a tight range-bound market, the color may flip between Aqua and Fuchsia rapidly, creating "noise."Pro-Tip: This indicator would be most effective when used in conjunction with Volume. If you get an "Aqua" signal on rising volume, the probability of a sustained trend is significantly higher.

ABCD Harmonic Pattern Strategy (Bull + Bear) This script is a strategy implementation of the classic ABCD Harmonic Pattern, designed for market structure analysis, backtesting, and educational research.
The ABCD pattern is one of the foundational harmonic price patterns in technical analysis. Its Fibonacci ratio relationships were formalized and standardized within harmonic trading theory by Scott M. Carney, whose work helped define modern harmonic pattern rules.
This strategy is conceptually inspired by educational ABCD pattern logic shared by the TradingView author theEccentricTrader.
The code, structure, execution logic, filters, and risk management have been independently developed, reconstructed, and extended into a complete TradingView strategy.
What this strategy does
Detects bullish and bearish ABCD harmonic patterns based on price structure and Fibonacci ratios.
Reconstructs ABCD market structure logic for both directions instead of using a simple visual inversion.
Draws the ABCD legs, structure labels (A, B, C, D), and projection levels directly on the chart.
Generates long and short trade entries using confirmed ABCD structures.
Includes optional confluence filters, such as:
Higher-timeframe EMA trend filter
RSI strength filter
ATR volatility filter
Volume confirmation
Candle body confirmation
Minimum bounce distance from point D
Provides built-in risk management, including:
Configurable Stop Loss
Configurable Take Profit
Optional trailing stop
Designed for backtesting, parameter optimization, and analytical research.
Why this strategy is different
This script is not a simple indicator conversion nor a basic bullish/bearish mirror.
The ABCD pattern logic has been recreated at the structural level to better reflect how bullish and bearish market formations behave in real price action.
Key differences
Reconstructed bullish and bearish structures
Bullish and bearish ABCD patterns are independently defined using market structure logic, not just inverted visually.
Each direction has its own pivot relationships and validation rules to produce a more faithful representation of the ABCD pattern.
Structure-aware pattern validation
Pattern confirmation is based on price swings, structure continuity, and Fibonacci alignment, helping reduce distorted or forced patterns.
Strategy-based execution
Unlike indicator-only ABCD tools that only visualize patterns, this script uses strategy.entry and strategy.exit, enabling full backtesting and performance analysis.
Confluence-driven entries
Trade entries can require multiple confirmation layers beyond the pattern itself, helping reduce low-quality signals and overtrading.
Integrated risk management
Stop Loss, Take Profit, and optional trailing logic are applied consistently for both long and short positions.
Non-repainting design
Pattern detection and entries rely on confirmed bars (barstate.isconfirmed) and higher-timeframe data with lookahead_off, ensuring signals do not repaint historically.
Improved and controlled visualization
Pattern drawings, projections, and entry markers are managed with strict object limits to comply with TradingView performance and publishing requirements.
How to use
Add the strategy to a chart and select a symbol and timeframe.
Enable or disable filters under “Entry Filters (Confluence)”.
Configure Stop Loss, Take Profit, and trailing behavior under “TP/SL”.
Use pattern drawings and entry markers as visual and analytical confirmation, not as standalone trade signals.
Important notes
This script is provided for educational and research purposes only.
It does not provide financial or investment advice.
No profitability or performance is implied or guaranteed.
Past performance does not indicate future results.
Always test across multiple markets and timeframes and apply proper risk management.
Credits
ABCD Harmonic Pattern: Harmonic trading principles as formalized by Scott M. Carney.
Conceptual inspiration: Educational ABCD pattern logic shared by @theEccentricTrader on TradingView.
Pattern reconstruction, strategy logic, and risk management: Independent development.

ATR Volatility Impulse Candles (Bull & Bear)This indicator highlights unusually strong momentum candles using ATR as a volatility filter. Treyding Stocks was the inspiration behind this powerful swing indicator!
A candle is marked only when its body is larger than the Average True Range, meaning price moved farther than normal for that timeframe. This filters out noise and focuses attention on candles that often matter most.
Lime green candles represent strong bullish impulse. They occur when price closes above the open and the candle body is larger than ATR. These candles often show aggressive buying, late-stage momentum, or exhaustion before a reversal.
Blue candles represent strong bearish impulse. They occur when price closes below the open and the candle body is larger than ATR. These candles often signal aggressive selling, liquidation, stop runs, or breakdown confirmation.
The indicator includes alerts for both bullish and bearish impulse candles, allowing traders to monitor multiple charts without watching them constantly.
Traders commonly use this tool to identify momentum exhaustion, reversal zones, and high-impact candles near VWAP, key moving averages, or important price levels. It works on any timeframe, does not repaint, and is designed to keep the chart clean while highlighting only the most meaningful price moves.
The Red (Blue) candle is very useful for swings especially on the Daily chart
*When the Blue (RED) candle appears, mark the high/low, and enter when the next candle breaks /closes above it.

Confluence Strength Meter (Bull/Bear) [v6]This indicator provides a quantified "Strength Score" (0-5) for price action setups by measuring the confluence of five key technical drivers. It features a Strategy Mode toggle, allowing traders to instantly switch between Bullish (Long) and Bearish (Short) scoring logic.
How it Works: The script analyzes the following factors to build a Confluence Score:
Trend Direction: Price relation to the Slow EMA (50).
EMA Stack: Fast EMA (20) vs. Slow EMA (50) alignment.
Volume Sentiment: Price relation to the Intraday VWAP.
Momentum: MACD vs. Signal line crossover.
RSI Health: Checks for momentum in the correct direction while filtering out extreme exhaustion (Overbought/Oversold).
Features:
Visual Histogram: Color-coded bars (Green/Red for strong setups, Orange for moderate, Gray for weak) make it easy to spot high-confluence zones.
Dual Modes: Input setting to switch the entire logic engine between Bullish and Bearish detection.
Alerts: Pre-configured alert conditions for both Long and Short setups, ready for webhook integration.
Usage: Look for a score of 4 or 5 (brightly colored bars) to confirm high-probability entries in the direction of your selected trend.

Bullish/Bearish Movement SumThis indicator calculates and displays the cumulative sum of bullish and bearish price movements over a specified period.
Features:
- Green line: Cumulative sum of all bullish movements
- Red line: Cumulative sum of all bearish movements (absolute value)
- Blue area: Net difference (bullish - bearish)
- Information table showing current values and bull/bear ratio
Settings:
- Calculation Period: Choose rolling window size (default: 100 bars) or 0 for cumulative from start
- Calculation Mode: Choose between "Points" (absolute price changes) or "Percentage" (% changes)
Use Cases:
- Identify market directional strength
- Compare bullish vs bearish pressure
- Spot divergences between price and directional momentum
- Ratio > 1 indicates more bullish than bearish movement
Developed with assistance from Claude (Anthropic)

Bull/Bear vs Base vs Index (% Change Spread)Visualizes the performance gap ("Beta Decay") between 3x Leveraged ETFs (SOXL/SOXS) and their underlying sector (SOXX), relative to the S&P 500 (SPY).
This indicator is designed for traders who trade leveraged products (like SOXL/SOXS, TQQQ/SQQQ) and need to see true relative strength beyond simple price action.
It calculates the percentage change over a user-defined lookback period for four instruments:
Base (1x): The sector benchmark (Default: SOXX).
Bull (3x): The leveraged long ETF (Default: SOXL).
Bear (-3x): The leveraged inverse ETF (Default: SOXS).
Index: The broad market zero-line (Default: SPY).
It then plots the Spread to reveal the health of the trend:
Bull Spread (Green Line): Bull % - Base %
Bear Spread (Red Line): Bear % - Base %
Base vs Index (Filled Area): Base % - SPY %
🧠 The Logic: Why Use Spreads?
In a perfectly efficient trending market, a 3x Bull ETF should move exactly 300% of the underlying asset. However, in choppy or volatile markets, volatility decay (beta slippage) causes leveraged ETFs to underperform mathematically.
Positive Spread: The leveraged ETF is successfully capturing momentum (The "Sweet Spot").
Negative Spread: The leveraged ETF is suffering from drag or the underlying asset is chopping.
📈 Recommended Trading Plan
Note: This indicator works best as a filter for entry conditions, not a standalone signal. Always use proper risk management.
Strategy A: The "Clean Trend" (Momentum)
Goal: Enter a 3x position only when volatility drag is minimal.
1. Bull Signal:
Condition 1: The Base vs Index (Area) is Green (Sector is outperforming SPY).
Condition 2: The Bull Spread (Green Line) is Positive (> 0).
Why: This confirms the sector is strong AND the 3x ETF is amplifying that move efficiently without decay eating the profits.
2. Bear Signal:
Condition 1: The Base vs Index (Area) is Red (Sector is lagging SPY).
Condition 2: The Bear Spread (Red Line) is Positive (> 0).
Why: This confirms the sector is crashing and the Bear ETF is successfully capturing the downside momentum.
Strategy B: The "Decay Avoidance" (Cash is King)
Goal: Avoid leveraged funds during chop.
Condition: If BOTH the Bull Spread and Bear Spread are Negative (< 0) (below the zero line).
Action: Stay in Cash or trade the 1x underlying (SOXX) only.
Why: When both spreads are negative, it mathematically proves that the market is too choppy for leverage. Both the Long and Short leveraged funds are losing value relative to the underlying asset.
Features:
Pine Script® v6: Updated for the latest engine performance and visuals.
Dashboard Table: Real-time percentage spreads displayed directly on the chart (customizable position).
Fully Customizable: Works on any sector (e.g., set inputs to QQQ/TQQQ/SQQQ for Tech).
Disclaimer:
Trading leveraged ETFs involves significant risk. This script is for educational purposes only.

Bull/Bear/Consolidation Zones Hariss 369This indicator helps to identify bullish, bearish, and consolidation zones using EMA and ATR-based calculations. It visually highlights zones on the chart and provides buy and sell signals with ATR-based stop-loss (SL) and take-profit (TP) levels.
Key Features:
EMA Trend Filter: Determines the direction of the market.
Bull / Bear / Consolidation Zones: Colored zones to easily spot market phases.
ATR-Based SL & TP: Automatic calculation for each trade signal.
Buy / Sell Signals: Based on price relative to EMA and consolidation zones.
Relative Volume (RVOL) Filter: Optional filter to trade only when volume is significant, helping reduce low-probability signals.
Extended Zones: Option to extend zones forward until a breakout occurs.
Customizable Inputs: EMA length, ATR length, multipliers, RVOL period & multiplier, and toggle RVOL filter.
How to Use:
Identify bull/bear/consolidation zones on your chart. (These are already there) You can change the line as well zone color according to your needs.
Look for buy signals above EMA and consolidation zone, or sell signals below EMA and consolidation zone. The buy and sell labels are already there.
Confirm with RVOL filter (optional) to ensure higher volume support.
Use the plotted SL and TP levels for trade management.
This tool is designed for trend-following and market structure traders who want a visual guide to high-probability trading zones combined with volume confirmation.
One can also trail with EMA in trending market.

Bull/Bear FVG Density RatioThis indicator tracks the directional frequency of Fair Value Gaps (FVGs) over a configurable lookback window, offering a clean, responsive measure of market imbalance.
🔍 What It Does:
Detects bullish and bearish FVGs using a 3-bar displacement logic
Calculates the ratio of FVGs to candles over the last N bars
Plots separate density curves for bullish and bearish FVGs
Includes a threshold line to help identify regime shifts (e.g., drought vs spate)
📈 How to Use:
Use rising density to confirm trend strength or breakout momentum
Watch for crossovers above the threshold to signal active imbalance regimes
Combine with price action or volume overlays for high-confluence setups
⚙️ Inputs:
Lookback Window: Number of candles used to calculate FVG density
Threshold: Visual guide for regime classification (default: 0.2)
This tool is ideal for traders who want to move beyond symptomatic signals and model structural causality. It pairs well with lifecycle scoring, retest velocity, and HTF overlays.

WaveTrend Dynamic (Lazy Bear Style)█ OVERVIEW
The WaveTrend Dynamic indicator (in the style of Lazy Bear) is an advanced tool based on the Exponential Smoothing Average (ESA), which adapts to the volatility and price of a financial instrument. It is more flexible than the classic WaveTrend but shares a similar concept of bands around a main oscillator line.
The indicator uses dynamic bands calculated as distances from the ESA, with their width adjustable via the "level" parameter. This allows it to be tailored to various markets, timeframes, and volatility conditions, making it easier to identify trends, reversal points, and buy/sell signals.
█ CONCEPTS
The WaveTrend Dynamic combines oscillator functions with trend analysis. Below, we explain the key components in a simple way, understandable even for beginner users.
Core Calculations
The indicator relies on the adaptive ESA and a few straightforward steps:
1 — ESA (Adaptive Average): Calculated as a smoothed average of the price (from high, low, and close, or HLC3) using the ESA Length parameter (default: 10). This number determines how many past candles are considered in the calculation. The ESA quickly responds to price changes, helping to track trends.
2 — Deviation (D): Measures how much the price deviates from the ESA, factoring in market volatility. This allows the indicator to adapt to different instruments.
3 — Price Distance Indicator (CI): Shows how far the price is from the ESA relative to market volatility. This forms the basis for the main indicator line, reacting to price movements.
4 — WT1 (WaveTrend 1): The main line, smoothing the Price Distance Indicator (CI) with the Average Length parameter (default: 21). It reflects the direction of price movement and momentum.
5 — WT2 (WaveTrend 2): A signal line that further smooths WT1 (with a period of 4). It helps confirm signals through crossovers with WT1.
6 — Bands (UpperBand and LowerBand): These form a dynamic channel around the ESA. Their width depends on the level parameter (default: 100). Wider bands result in fewer but more reliable signals. In the original WaveTrend, the oscillator bands use lower values, such as 50 or 60. To achieve classic oscillator signals (more frequent WT1/WT2 crossovers outside the bands), set the level to 50–60.
Trend Identification
The indicator identifies two types of trends:
• Major Trend: Determined by the position of WT1 relative to the ESA. When WT1 is above the ESA, it indicates a bullish trend. When below, it signals a bearish trend. Line and fill colors reflect this trend.
• Mini-Trend: Based on WT1 and WT2 crossovers. When the lines cross, they change to the same color, signaling short-term changes or reversal points. This is ideal for quick trading decisions.
Visuals and Effects
• WT1 and WT2 Lines: Scaled to price and displayed on the price chart for easier analysis.
• Fills: Between the bands (UpperBand/LowerBand) and between WT1/WT2, with a "wave" effect that adjusts transparency based on the trend (green for bullish, red for bearish).
• Signals: Three types—return-to-band, WT1/WT2 crossovers outside the bands, and crossovers inside the bands. Signals are displayed as triangles with different colors for buy and sell.
█ FEATURES
Detailed features of the indicator, aligned with the order of settings in the script:
• Basic Parameters: ESA Length — controls ESA smoothing; Average Length — affects WT1 responsiveness; level (WT Level) — adjusts band width for signal filtering.
• Display Elements: Options to show/hide ESA, bands, WT1/WT2; customizable colors for lines, fills, and the wave effect.
• Signals: Three signal groups (return-to-band, crossovers outside bands, crossovers inside bands) with display and color customization options.
█ HOW TO USE
1 — Add the indicator to your TradingView chart and adjust parameters: — Increase ESA Length and Average Length for low-volatility markets (e.g., stocks), or decrease for cryptocurrencies or forex. — Set level to 50–60 for classic WaveTrend signals with WT1/WT2 crossovers outside bands. The default value of 100 creates wider bands and fewer signals.
2 — Analyze trends: — Major trend (WT1 vs. ESA) shows the overall market direction. — Mini-trends (WT1/WT2 crossovers) help time short-term entries.
3 — Use signals: — Return-to-band: Buy at the lower band, sell at the upper band (mean-reversion). — Crossovers outside bands: Indicate strong momentum (with a lower level, e.g., 50). — Crossovers inside bands: Signal weaker trend changes.
4 — Combine with other tools: Use with volume, RSI, or support/resistance for better decisions. Test on historical data to optimize settings.

Bull & Bear Power Separados📄 English Description for TradingView
Bull & Bear Power – Elder Style
This indicator displays the strength of buyers (Bull Power) and sellers (Bear Power) separately, based on Alexander Elder’s original concept.
It uses a 13-period Exponential Moving Average (EMA) as the baseline, calculating:
Bull Power = High – EMA
Bear Power = Low – EMA
✔️ Bull Power (green) shows buying pressure.
✔️ Bear Power (red) shows selling pressure.
Great for analyzing true market momentum and spotting early signs of potential trend reversals.
Can be used as confirmation together with moving averages (e.g., MMA30 and MMA50) or price action signals.
✅ On 1H gold charts (XAUUSD), it has shown solid behavior in filtering entries during clear trends.
Developed and shared for educational purposes by El Bit Criollo.
