Hash Momentum Strategy# Hash Momentum Strategy
## 📊 Overview
The **Hash Momentum Strategy** is a professional-grade momentum trading system designed to capture strong directional price movements with precision timing and intelligent risk management. Unlike traditional EMA crossover strategies, this system uses momentum acceleration as its primary signal, resulting in earlier entries and better risk-to-reward ratios.
---
## ⚡ What Makes This Strategy Unique
### 1. Momentum-Based Entry System
Most strategies rely on lagging indicators like moving average crossovers. This strategy captures momentum *acceleration* - entering when price movement is gaining strength, not after the move has already happened.
### 2. Programmable Risk-to-Reward
Set your exact R:R ratio (1:2, 1:2.5, 1:3, etc.) and the strategy automatically calculates stop loss and take profit levels. No more guessing or manual calculations.
### 3. Smart Partial Profit Taking
Lock in profits at multiple stages:
- **First TP**: Take 50% off at 2R
- **Second TP**: Take 40% off at 2.5R
- **Final TP**: Let 10% ride to maximum target
This approach locks in gains while letting winners run.
### 4. Dynamic Momentum Threshold
Uses ATR (Average True Range) multiplied by your threshold setting to adapt to market volatility. Volatile markets = higher threshold. Quiet markets = lower threshold.
### 5. Trade Cooldown System
Prevents overtrading and revenge trading by enforcing a cooldown period between trades. Configurable from 1-24 bars.
### 6. Optional Session & Weekend Filters
Filter trades by Tokyo, London, and New York sessions. Optional weekend-off toggle to avoid low-liquidity periods.
---
## 🎯 How It Works
### Signal Generation
**STEP 1: Calculate Momentum**
- Momentum = Current Price - Price
- Check if Momentum > ATR × Threshold Multiplier
- Momentum must be accelerating (positive change in momentum)
**STEP 2: Confirm with EMA Trend Filter**
- Long: Price must be above EMA
- Short: Price must be below EMA
**STEP 3: Check Filters**
- Not in cooldown period
- Valid session (if enabled)
- Not weekend (if enabled)
**STEP 4: ENTRY SIGNAL TRIGGERED**
### Risk Management Example
**Example Long Trade:**
- Entry: $100
- Stop Loss: $97.80 (2.2% risk)
- Risk Amount: $2.20
**Take Profit Levels:**
- TP1: $104.40 (2R = $4.40) → Close 50%
- TP2: $105.50 (2.5R = $5.50) → Close 40%
- Final: $105.50 (2.5R) → Close remaining 10%
---
## ⚙️ Settings Guide
### Core Strategy
**Momentum Length** (Default: 13)
Number of bars for momentum calculation. Higher = stronger but fewer signals.
**Momentum Threshold** (Default: 2.25)
ATR multiplier. Higher = only trade biggest moves.
**Use EMA Trend Filter** (Default: ON)
Only long above EMA, short below EMA.
**EMA Length** (Default: 28)
Period for trend-confirming EMA.
### Filters
**Use Trading Session Filter** (Default: OFF)
Restrict trading to specific sessions.
**Tokyo Session** (Default: OFF)
Trade during Asian hours (00:00-09:00 JST).
**London Session** (Default: OFF)
Trade during European hours (08:00-17:00 GMT).
**New York Session** (Default: OFF)
Trade during US hours (08:00-17:00 EST).
**Weekend Off** (Default: OFF)
Disable trading on Saturdays and Sundays.
### Risk Management
**Stop Loss %** (Default: 2.2)
Fixed percentage stop loss from entry.
**Risk:Reward Ratio** (Default: 2.5)
Your target reward as multiple of risk.
**Use Partial Profit Taking** (Default: ON)
Take profits in stages.
**First TP R:R** (Default: 2.0)
First target as multiple of risk.
**First TP Size %** (Default: 50)
Percentage of position to close at TP1.
**Second TP R:R** (Default: 2.5)
Second target as multiple of risk.
**Second TP Size %** (Default: 40)
Percentage of position to close at TP2.
### Trade Management
**Use Trade Cooldown** (Default: ON)
Prevent overtrading.
**Cooldown Bars** (Default: 6)
Bars to wait after closing a trade.
---
## 🎨 Visual Elements
### Chart Indicators
🟢 **Green Dot** (below bar) = Long entry signal
🔴 **Red Dot** (above bar) = Short entry signal
🔵 **Blue X** (above bar) = Long position closed
🟠 **Orange X** (below bar) = Short position closed
**EMA Line** = Trend direction (green when bullish, red when bearish)
**White Line** = Entry price
**Red Line** = Stop loss level
**Green Lines** = Take profit levels (TP1, TP2, Final)
### Dashboard
When not in real-time mode, a dashboard displays:
- Current position (LONG/SHORT/FLAT)
- Entry price
- Stop loss price
- Take profit price
- R:R ratio
- Current momentum strength
- Total trades
- Win rate
- Net profit %
---
## 📈 Recommended Settings by Timeframe
### 1-Hour Timeframe (Default)
- Momentum Length: 13
- Momentum Threshold: 2.25
- EMA Length: 28
- Stop Loss: 2.2%
- R:R Ratio: 2.5
- Cooldown: 6 bars
### 4-Hour Timeframe
- Momentum Length: 24-36
- Momentum Threshold: 2.5
- EMA Length: 50
- Stop Loss: 3-4%
- R:R Ratio: 2.0-2.5
- Cooldown: 6-8 bars
### 15-Minute Timeframe
- Momentum Length: 8-10
- Momentum Threshold: 2.0
- EMA Length: 20
- Stop Loss: 1.5-2%
- R:R Ratio: 2.0
- Cooldown: 4-6 bars
---
## 🔧 Optimization Tips
### Want More Trades?
- Decrease Momentum Threshold (2.0 instead of 2.25)
- Decrease Momentum Length (10 instead of 13)
- Decrease Cooldown Bars (4 instead of 6)
### Want Higher Quality Trades?
- Increase Momentum Threshold (2.5-3.0)
- Increase Momentum Length (18-24)
- Increase Cooldown Bars (8-10)
### Want Lower Drawdown?
- Increase Cooldown Bars
- Use tighter stop loss
- Enable session filters (trade only high-liquidity sessions)
- Enable Weekend Off
### Want Higher Win Rate?
- Increase R:R Ratio (may reduce total profit)
- Increase Momentum Threshold (fewer but stronger signals)
- Use longer EMA for trend confirmation
---
## 📊 Performance Expectations
Based on typical backtesting results:
- **Win Rate**: 35-45%
- **Profit Factor**: 1.5-2.0
- **Risk:Reward**: 1:2.5 (configurable)
- **Max Drawdown**: 10-20%
- **Trades/Month**: 8-15 (1H timeframe)
**Note:** Win rate may appear low, but with 2.5:1 R:R, you only need ~29% win rate to break even. The strategy aims for quality over quantity.
---
## 🎓 Strategy Logic Explained
### Why Momentum > EMA Crossover?
**EMA Crossover Problems:**
- Signals lag behind price
- Late entries = poor R:R
- Many false signals in ranging markets
**Momentum Advantages:**
- Catches moves as they start accelerating
- Earlier entries = better R:R
- Adapts to volatility via ATR
### Why Partial Profit Taking?
**Without Partial TPs:**
- All-or-nothing approach
- Winners often turn to losers
- High stress watching open positions
**With Partial TPs:**
- Lock in 50% at first target
- Reduce risk to breakeven
- Let remainder ride for bigger gains
- Lower psychological pressure
### Why Trade Cooldown?
**Without Cooldown:**
- Revenge trading after losses
- Overtrading in choppy markets
- Emotional decision-making
**With Cooldown:**
- Forces discipline
- Waits for new setup to develop
- Reduces transaction costs
- Better signal quality
---
## ⚠️ Important Notes
1. **This is a momentum strategy, not an EMA strategy**
The EMA only confirms trend direction. Momentum generates the actual signals.
2. **Backtest thoroughly before live trading**
Past performance ≠ future results. Test on your specific asset and timeframe.
3. **Use proper position sizing**
Risk 1-2% of account per trade maximum. The strategy uses 100% equity by default (adjust in Properties).
4. **Dashboard auto-hides in real-time**
Clean chart for live trading. Visible during backtesting.
5. **Customize for your trading style**
All settings are fully adjustable. No single "best" configuration.
---
## 🚀 Quick Start Guide
1. **Add to Chart**: Apply to your preferred asset and timeframe
2. **Keep Defaults**: Start with default settings
3. **Backtest**: Review historical performance
4. **Paper Trade**: Test with simulated money first
5. **Go Live**: Start small and scale up
---
## 💡 Pro Tips
**Tip 1: Combine Timeframes**
Use higher timeframe (4H) for trend direction, lower timeframe (1H) for entries.
**Tip 2: Avoid News Events**
Major news can cause whipsaws. Consider manual intervention during high-impact events.
**Tip 3: Monitor Momentum Strength**
Dashboard shows momentum in sigma (σ). Values >1.0σ indicate very strong momentum.
**Tip 4: Adjust for Volatility**
In high-volatility markets, increase threshold and stop loss. In quiet markets, decrease them.
**Tip 5: Review Losing Trades**
Check if losses are hitting stop loss or reversing. Adjust stop accordingly.
---
## 📝 Changelog
**v1.0** - Initial Release
- Momentum-based signal generation
- EMA trend filter
- Programmable R:R ratio
- Partial profit taking (3 stages)
- Trade cooldown system
- Session filters (Tokyo/London/New York)
- Weekend off toggle
- Smart dashboard (auto-hides in real-time)
- Clean visual design
---
## 🙏 Credits
Developed by **Hash Capital Research**
If you find this strategy useful, please give it a like and share with others!
---
## ⚖️ Disclaimer
This strategy is for educational purposes only. Trading involves substantial risk of loss and is not suitable for all investors. Past performance is not indicative of future results. Always do your own research and consult with a qualified financial advisor before trading.
---
## 📬 Feedback
Have suggestions or found a bug? Leave a comment below! I'm continuously improving this strategy based on community feedback.
---
**Happy Trading! 🚀📈**
Buscar en scripts para "bear"

EMA Cross Strategy v5 (30 lots) (15 min candle only)- safe flip🚀 EMA Cross Strategy v5 (30 Lots) (15 min candle only)— Safe Flip Edition
Fully Automated | Fast | Reliable | Battle-tested
Welcome to a clean, powerful, and automation-friendly EMA crossover system.
This strategy is built for traders who want consistent trend-based entries without the risk of unwanted pyramiding or doubled positions.
🔥 How It Works
This strategy uses a fast EMA (10) crossing a slow EMA (20) to detect trend shifts:
Bullish Crossover → LONG (30 lots)
Bearish Crossover → SHORT (30 lots)
Every opposite signal safely flips the position by first closing the current trade, then opening a fresh position of exactly 30 lots.
No doubling.
No runaway position size.
No surprises.
Just clean, mechanical trend-following.
📈 Why This Strategy Stands Out
Unlike basic EMA crossbots, this version:
✔ Prevents unintended pyramiding
✔ Never over-allocates capital
✔ Works perfectly with webhook-based automation
✔ Produces stable, systematic entries
✔ Executes directional flips with precision
🔍 Backtest Highlights (1-Year)
(Backtests will vary by instrument/timeframe)
1,500+ trades executed
Profit factor above 1.27
Strong trend performance
Balanced long/short behavior
No margin calls
Consistent trade execution
This strategy thrives in trending markets and maintains strict discipline even in choppy conditions.
⚙️ Automation Ready
Designed for automated execution via webhook and API setups on supported platforms.
Just connect, run, and let the bot follow the rules without hesitation.
No emotions.
No overtrading.
No fear or greed.
Pure logic.

Golden Cross 50/200 EMATrend-following systems are characterized by having a low win rate, yet in the right circumstances (trending markets and higher timeframes) they can deliver returns that even surpass those of systems with a high win rate.
Below, I show you a simple bullish trend-following system with clear execution rules:
System Rules
-Long entries when the 50-period EMA crosses above the 200-period EMA.
-Stop Loss (SL) placed at the lowest low of the 15 candles prior to the entry candle.
-Take Profit (TP) triggered when the 50-period EMA crosses below the 200-period EMA.
Risk Management
-Initial capital: $10,000
-Position size: 10% of capital per trade
-Commissions: 0.1% per trade
Important Note:
In the code, the stop loss is defined using the swing low (15 candles), but the position size is not adjusted based on the distance to the stop loss. In other words, 10% of the equity is risked on each trade, but the actual loss on the trade is not controlled by a maximum fixed percentage of the account — it depends entirely on the stop loss level. This means the loss on a single trade could be significantly higher or lower than 10% of the account equity, depending on volatility.
Implementing leverage or reducing position size based on volatility is something I haven’t been able to include in the code, but it would dramatically improve the system’s performance. It would fix a consistent percentage loss per trade, preventing losses from fluctuating wildly with changes in volatility.
For example, we can maintain a fixed loss percentage when volatility is low by using the following formula:
Leverage = % of SL you’re willing to risk / % volatility from entry point to stop loss
And when volatility is high and would exceed the fixed percentage we want to expose per trade (if the SL is hit), we could reduce the position size accordingly.
Practical example:
Imagine we only want to risk 15% of the position value if the stop loss is triggered on Tesla (which has high volatility), but the distance to the SL represents a potential 23.57% drop. In this case, we subtract the desired risk (15%) from the actual volatility-based loss (23.57%):
23.57% − 15% = 8.57%
Now suppose we normally use $200 per trade.
To calculate 8.57% of $200:
200 × (8.57 / 100) = $17.14
Then subtract that amount from the original position size:
$200 − $17.14 = $182.86
In summary:
If we reduce the position size to $182.86 (instead of the usual $200), even if Tesla moves 23.57% against us and hits the stop loss, we would still only lose approximately 15% of the original $200 position — exactly the risk level we defined. This way, we strictly respect our risk management rules regardless of volatility swings.
I hope this clearly explains the importance of capping losses at a fixed percentage per trade. This keeps risk under control while maintaining a consistent percentage of capital invested per trade — preventing both statistical distortion of the system and the potential destruction of the account.
About the code:
Strategy declaration:
The strategy is named 'Golden Cross 50/200 EMA'.
overlay=true means it will be drawn directly on the price chart.
initial_capital=10000 sets the initial capital to $10,000.
default_qty_type=strategy.percent_of_equity and default_qty_value=10 means each trade uses 10% of available equity.
margin_long=0 indicates no margin is used for long positions (this is likely for simulation purposes only; in real trading, margin would be required).
commission_type=strategy.commission.percent and commission_value=0.1 sets a 0.1% commission per trade.
Indicators:
Calculates two EMAs: a 50-period EMA (ema50) and a 200-period EMA (ema200).
Crossover detection:
bullCross is triggered when the 50-period EMA crosses above the 200-period EMA (Golden Cross).
bearCross is triggered when the 50-period EMA crosses below the 200-period EMA (Death Cross).
Recent swing:
swingLow calculates the lowest low of the previous 15 periods.
Stop Loss:
entryStopLoss is a variable initialized as na (not available) and is updated to the current swingLow value whenever a bullCross occurs.
Entry and exit conditions:
Entry: When a bullCross occurs, the initial stop loss is set to the current swingLow and a long position is opened.
Exit on opposite signal: When a bearCross occurs, the long position is closed.
Exit on stop loss: If the price falls below entryStopLoss while a position is open, the position is closed.
Visualization:
Both EMAs are plotted (50-period in blue, 200-period in red).
Green triangles are plotted below the bar on a bullCross, and red triangles above the bar on a bearCross.
A horizontal orange line is drawn that shows the stop loss level whenever a position is open.
Alerts:
Alerts are created for:Long entry
Exit on bearish crossover (Death Cross)
Exit triggered by stop loss
Favorable Conditions:
Tesla (45-minute timeframe)
June 29, 2010 – November 17, 2025
Total net profit: $12,458.73 or +124.59%
Maximum drawdown: $1,210.40 or 8.29%
Total trades: 107
Winning trades: 27.10% (29/107)
Profit factor: 3.141
Tesla (1-hour timeframe)
June 29, 2010 – November 17, 2025
Total net profit: $7,681.83 or +76.82%
Maximum drawdown: $993.36 or 7.30%
Total trades: 75
Winning trades: 29.33% (22/75)
Profit factor: 3.157
Netflix (45-minute timeframe)
May 23, 2002 – November 17, 2025
Total net profit: $11,380.73 or +113.81%
Maximum drawdown: $699.45 or 5.98%
Total trades: 134
Winning trades: 36.57% (49/134)
Profit factor: 2.885
Netflix (1-hour timeframe)
May 23, 2002 – November 17, 2025
Total net profit: $11,689.05 or +116.89%
Maximum drawdown: $844.55 or 7.24%
Total trades: 107
Winning trades: 37.38% (40/107)
Profit factor: 2.915
Netflix (2-hour timeframe)
May 23, 2002 – November 17, 2025
Total net profit: $12,807.71 or +128.10%
Maximum drawdown: $866.52 or 6.03%
Total trades: 56
Winning trades: 41.07% (23/56)
Profit factor: 3.891
Meta (45-minute timeframe)
May 18, 2012 – November 17, 2025
Total net profit: $2,370.02 or +23.70%
Maximum drawdown: $365.27 or 3.50%
Total trades: 83
Winning trades: 31.33% (26/83)
Profit factor: 2.419
Apple (45-minute timeframe)
January 3, 2000 – November 17, 2025
Total net profit: $8,232.55 or +80.59%
Maximum drawdown: $581.11 or 3.16%
Total trades: 140
Winning trades: 34.29% (48/140)
Profit factor: 3.009
Apple (1-hour timeframe)
January 3, 2000 – November 17, 2025
Total net profit: $9,685.89 or +94.93%
Maximum drawdown: $374.69 or 2.26%
Total trades: 118
Winning trades: 35.59% (42/118)
Profit factor: 3.463
Apple (2-hour timeframe)
January 3, 2000 – November 17, 2025
Total net profit: $8,001.28 or +77.99%
Maximum drawdown: $755.84 or 7.56%
Total trades: 67
Winning trades: 41.79% (28/67)
Profit factor: 3.825
NVDA (15-minute timeframe)
January 3, 2000 – November 17, 2025
Total net profit: $11,828.56 or +118.29%
Maximum drawdown: $1,275.43 or 8.06%
Total trades: 466
Winning trades: 28.11% (131/466)
Profit factor: 2.033
NVDA (30-minute timeframe)
January 3, 2000 – November 17, 2025
Total net profit: $12,203.21 or +122.03%
Maximum drawdown: $1,661.86 or 10.35%
Total trades: 245
Winning trades: 28.98% (71/245)
Profit factor: 2.291
NVDA (45-minute timeframe)
January 3, 2000 – November 17, 2025
Total net profit: $16,793.48 or +167.93%
Maximum drawdown: $1,458.81 or 8.40%
Total trades: 172
Winning trades: 33.14% (57/172)
Profit factor: 2.927

Seawolf Pivot Hunter [Strategy]Overview
Seawolf Pivot Hunter is a practical trading strategy that enhances the classic pivot-box breakout system with a structured risk-management framework. Using ATR-based stop loss and take-profit calculations, position sizing, multi-layer filtering, and daily loss-limit protection, it provides a stable and sustainable trading environment. It preserves the strengths of the original version while adding systems designed to manage real-market risks more effectively.
Core Philosophy
The most important element in trading is not generating profits but controlling losses. Even the best entry signals cannot compensate for a single large loss that wipes out accumulated gains. This strategy precisely calculates the risk exposure for every trade and includes multiple layers of protection to safeguard the account under worst-case scenarios.
Indicator Setup Link
kr.tradingview.com
Example of Optimal Parameter Settings
Asset (Exchange): ETH/USDT (Binance)
Timeframe: 15-minute chart
Pivot Detection Length: 5
Upper Box Width: 2
Lower Box Width: 2
Enable Risk Management: False
Use Trailing Stop: False
Use Volume Filter
-Min Buy Volume % for Long: 50
-Min Sell Volume % for Short: 50
Use Trend Filter (EMA): False
Enable Max Loss Protection
-Max Daily Loss ($): 200
-Max Trades Per Day: 10
Calculated Bars: 50,000
Risk-Management System
Every trade automatically receives a stop-loss level at the moment of entry. The stop is calculated using ATR, adjusting dynamically to market volatility. When volatility increases, the stop widens; in stable conditions, it tightens to reduce unnecessary exits. The default distance is set to twice the ATR.
The standard take-profit level is set to four times the ATR, providing a 1:2 risk-reward structure. With this ratio, even a 50 percent win rate can produce profitability—while the typical trade structure aims for small losses and larger gains to support long-term performance.
A trailing-stop option is also available. Once the trade moves into profit, the stop level automatically trails behind price action, protecting gains while allowing the position to expand when momentum continues.
Position size is calculated automatically based on the selected risk percentage. For example, with a 2 percent risk setting, each stop-loss hit would result in exactly 2 percent of the account balance being lost. This ensures a consistent risk profile regardless of account size.
The daily loss-limit function prevents excessive drawdown by halting new trades once a predefined loss threshold is reached. This helps avoid emotional decision-making after consecutive losses.
A daily trade-limit feature is included as well. The default is 10 trades per day, protecting traders from overtrading and unnecessary fees.
Filtering System
The volume filter analyzes buying and selling pressure within the pivot box. Long trades are allowed only when buy volume exceeds a specified percentage; shorts require sell-volume dominance. The default threshold is 55 percent.
The trend filter uses an EMA to determine market direction. When price is above the 200-EMA, only long signals are permitted; when below, only shorts are allowed. This ensures alignment with the broader trend and reduces counter-trend risk.
Each filter can be toggled independently. More filters generally reduce trade frequency but improve signal quality.
Real-Time Monitoring
A real-time statistics panel displays daily profit/loss, the number of trades taken, the maximum allowed trades, and whether new trades are currently permitted. When daily limits are reached, the panel provides clear visual warnings.
Entry Logic
A trade is validated only after a pivot-box breakout occurs and all active filters—volume, trend, daily loss limit, and daily trade limit—are satisfied. Position size, stop loss, and take-profit levels are then calculated automatically. Entry arrows and labels on the chart help with later review and analysis.
Setup Guide
Risk percentage is the most critical setting. Beginners should start at 1 percent. Anything above 3 percent becomes aggressive.
ATR stop-loss multipliers should reflect asset volatility.
ATR take-profit multipliers determine reward ratio; 4.0 is the standard.
Volume thresholds are typically set between 50–60 percent depending on market conditions.
Daily loss limits are typically 2–5 percent of the account.
Trading Strategy
This strategy performs best in trending environments and works especially well on the 4-hour and daily charts. New users should begin with all filters enabled and trade conservatively. A minimum of one month of paper trading is recommended before committing real capital.
Suitable Users
The strategy is ideal for beginners who lack risk-management experience as well as advanced traders seeking a customizable structure. It is particularly helpful for traders who struggle with emotional decision-making, as pre-defined limits and rules enforce discipline.
Backtesting Guide
Use at least 2–3 years of historical data that includes bullish, bearish, and sideways conditions.
Target metrics:
Sharpe ratio: 1.5 or higher
Maximum drawdown: below 25 percent
Win rate: 40 percent or higher
Total trades: at least 100 for statistical relevance
Optimization Precautions
Avoid over-fitting parameters. Always test values around the “best” setting to verify stability.
Out-of-sample testing is essential for confirming robustness.
Test across multiple assets and timeframes to ensure consistency.
Live Deployment Roadmap
After successful backtesting, follow a gradual rollout:
Paper trading for at least one month
Small-account live testing
Slow scaling as performance stabilizes
Continuous Improvement
Keep a detailed trading journal and evaluate performance each quarter using recent data.
Adapt settings as market conditions evolve.
Conclusion
Seawolf Pivot Hunter aims to provide more than simple trade signals—it is designed to create a stable and sustainable trading system built on disciplined risk management. No strategy is perfect, and long-term success depends on consistency, patience, and strict adherence to rules. Start small, verify results, and scale progressively.
Disclaimer
This strategy is for educational and research purposes only. Past performance does not guarantee future results. All trading decisions are the responsibility of the user.
개요
Seawolf Pivot Hunter는 기본 피봇 박스 브레이크아웃 전략에 전문적인 리스크 관리 시스템을 더한 실전형 트레이딩 전략입니다. ATR 기반의 손절매와 목표가 설정, 포지션 사이징, 다층 필터링 시스템, 일일 손실 제한 기능을 통해 안정적이고 지속 가능한 트레이딩 환경을 제공합니다. 기본 버전의 장점은 유지하면서 실제 시장에서 발생할 수 있는 위험을 체계적으로 관리할 수 있도록 설계되었습니다.
핵심 철학
트레이딩에서 가장 중요한 것은 수익이 아니라 손실 관리입니다. 아무리 훌륭한 진입 조건이 있어도 한 번의 큰 손실로 모든 수익이 사라질 수 있습니다. 이 전략은 각 거래마다 감수할 리스크를 명확히 계산하고, 최악의 상황에서도 계좌를 보호하기 위한 다양한 안전장치를 제공합니다.
지표 적용 링크 공유
kr.tradingview.com
최적 조건값 설정(예시)
"종목(거래소): ETH/USDT(Binance)", "15 분봉 기준"
-Pivot Detection Length: 5
-Upper Box width: 2
-Lower Box width: 2
-Enable Risk Management: False
-Use Trailing Stop: False
-Use Volume Filter
-Min Buy Volume % for Long: 50
-Min Buy Volume % for Long: 50
-Use Trend Filter(EMA): False
-Enable Max Loss Protection
-Max Daily Loss($): 200
-Max Trades Per Day: 10
-Calucated bars: 50000
리스크 관리 시스템
모든 거래는 진입과 동시에 손절매 주문이 자동 설정됩니다. 손절가는 ATR을 기준으로 계산되며, 시장의 변동성에 따라 자동으로 조정됩니다. 변동성이 큰 시장에서는 넓은 손절폭을, 안정적인 시장에서는 좁은 손절폭을 사용해 불필요한 청산을 줄입니다. 기본값은 ATR의 2배입니다.
목표가는 ATR의 4배를 기본값으로 설정하여 손익비 1:2 구조를 유지합니다. 승률이 50퍼센트만 되어도 수익성이 가능하며, 실제로는 손절은 짧고 이익은 길게 가져가는 방식으로 장기 성과를 확보합니다.
트레일링 스톱 기능도 제공됩니다. 포지션이 수익 구간에 들어서면 손절가가 자동으로 함께 움직이며 수익을 보호합니다. 이 기능은 사용자가 켜거나 끌 수 있습니다.
포지션 크기는 리스크 퍼센트 기반으로 자동 계산됩니다. 예를 들어 리스크를 2퍼센트로 설정하면 손절 시 계좌 자산의 2퍼센트만 잃도록 수량이 조절됩니다. 계좌 크기와 무관하게 항상 일정한 비율의 리스크만 감수하게 되는 방식입니다.
일일 손실 제한 기능은 하루에 허용 가능한 최대 손실을 초과하지 않도록 합니다. 지정 금액에 도달하면 당일 거래는 더 이상 실행되지 않습니다. 감정적 거래를 막고 일정한 규율을 유지하도록 돕습니다.
일일 거래 횟수 제한 기능도 제공됩니다. 기본값은 하루 10회로, 과매매와 수수료 증가를 방지합니다.
필터링 시스템
볼륨 필터는 박스 구간 내 매수·매도 압력을 분석해 진입 신호를 검증합니다. 롱은 매수 볼륨이 일정 비율 이상일 때, 숏은 매도 볼륨이 우세할 때만 진입합니다. 기본값은 55퍼센트입니다.
추세 필터는 EMA를 사용하며, 가격이 200EMA 위에 있을 때는 롱 신호만, 아래에서는 숏 신호만 허용합니다. 큰 추세 방향에만 거래하여 역추세 리스크를 줄입니다.
필터는 독립적으로 켜고 끌 수 있으며, 필터가 많을수록 거래 횟수는 줄지만 신호 품질은 향상됩니다.
실시간 모니터링
화면에 실시간 통계 테이블이 표시되며, 일일 손익, 거래 횟수, 최대 허용 횟수, 현재 거래 가능 여부가 즉시 확인됩니다. 손실 제한 또는 거래 제한 도달 시 시각적으로 표시됩니다.
진입 로직
피봇 박스 브레이크아웃 발생 후 볼륨 필터, 추세 필터, 일일 손실·거래 제한을 모두 통과하면 포지션 크기를 계산하고 손절·목표가를 설정한 뒤 진입합니다. 진입 지점에는 화살표와 레이블이 표시되어 분석에 도움을 줍니다.
설정 가이드
리스크 퍼센트는 가장 중요한 설정입니다. 초보자는 1퍼센트를 추천하며 3퍼센트 이상은 위험합니다.
손절 ATR 배수는 자산 특성에 맞게 조절합니다.
목표가 ATR 배수는 손익비를 결정하며 기본값은 4.0입니다.
볼륨 비율은 시장 상황에 따라 50~60퍼센트 내외로 조정합니다.
일일 손실 제한은 계좌의 2~5퍼센트 수준이 적절합니다.
사용 전략
추세가 명확한 시장에서 가장 효과적이며, 4시간봉 또는 일봉을 추천합니다. 초반에는 모든 필터를 켜고 보수적으로 시작하며, 최소 한 달간 페이퍼 트레이딩을 권장합니다.
적합한 사용자
리스크 관리 경험이 부족한 초보자부터, 커스터마이징을 원하는 경험자까지 폭넓게 적합합니다. 감정적 트레이딩을 억제하는 기능이 있어 규율 유지가 어렵던 트레이더에게 특히 유용합니다.
백테스트 가이드
최소 2~3년 데이터로 테스트하며, 상승·하락·횡보 모두 포함해야 합니다.
샤프비율 1.5 이상, 최대 낙폭 25퍼센트 이하를 목표로 합니다.
승률은 40퍼센트 이상이면 충분합니다.
최소 100회 이상 거래가 있어야 통계적으로 의미가 있습니다.
최적화 주의사항
과최적화를 피하고 주변 값도 테스트해야 합니다.
샘플 외 기간 검증은 필수입니다.
여러 자산·여러 시간대에서 테스트하여 일관성을 확인해야 합니다.
실전 적용 로드맵
백테스트 후 바로 실전 투입하지 말고, 한 달 이상의 페이퍼 트레이딩 → 소액 실전 → 점진적 확대 순으로 진행합니다.
지속적 개선
일지를 기록하고 분기마다 최신 데이터로 점검합니다.
시장 변화에 따라 유연하게 조정해야 합니다.
마치며
Seawolf Pivot Hunter는 단순 신호 제공을 넘어, 안전하고 지속 가능한 트레이딩 환경 구축을 목표로 합니다. 어떤 전략도 완벽할 수 없으며, 장기적 성공을 위해서는 규칙 준수와 인내가 가장 중요합니다. 충분한 검증을 거쳐 작은 금액으로 시작하고 점진적으로 확장해나가는 접근을 추천합니다.
면책 조항
이 전략은 교육 및 연구 목적이며, 과거 성과는 미래를 보장하지 않습니다. 모든 투자 결정은 본인의 판단과 책임 하에 이루어져야 합니다.

ETH SuperTrend Hull Strategy - 15min Futures(重制版)🟠 ETH SuperTrend Hull Strategy - 15min Futures
Strategy Overview
The "ETH SuperTrend Hull Strategy" is a sophisticated 15-minute trading system specifically designed for Bitcoin perpetual contracts. This advanced algorithm integrates SuperTrend indicators with Hull moving averages to deliver high-precision trend following through a triple-confirmation mechanism, featuring intelligent position management and multi-level take-profit systems.
Core Value Proposition
Triple Trend Confirmation: SuperTrend + Hull MA + ATR volatility filtering
Adaptive Take-Profit System: 6-level dynamic profit targets adjusted to market conditions
Smart Position Management: Three martingale modes with automatic sizing
Real-time Webhook Integration: Direct exchange connectivity for automated execution
🟠 Technical Framework
Multi-Layer Trend Detection
Layer 1 - SuperTrend Filter
pinescript
= ta.supertrend(supertrend_factor, supertrend_atr_period)
is_supertrend_long = direction < 0 // Bullish trend line
is_supertrend_short = direction >= 0 // Bearish trend line
Layer 2 - Hull MA Confirmation
pinescript
HMA = HMA(close, 73) // Hull Moving Average
hull_is_green = HULL > HULL // Uptrend confirmation
hull_is_red = HULL <= HULL // Downtrend confirmation
Layer 3 - ATR Breakout Signals
pinescript
xATR = ta.atr(5)
nLoss = key_value * xATR // Dynamic stop distance
Entry Conditions
Long Entry:
Price breaks above ATR trailing stop
Hull MA shows green uptrend
SuperTrend indicates bullish momentum
Price positioned above Hull MA
Short Entry:
Price breaks below ATR trailing stop
Hull MA shows red downtrend
SuperTrend indicates bearish momentum
Price positioned below Hull MA
🟠 Risk Management System
Position Sizing
text
Base Position = Initial Capital × Risk % / Entry Price × Leverage
Actual Position = Base Position × Martingale Multiplier (1.0-5.0x)
Martingale Modes
4x Mode: Conservative approach, maximum 4x position scaling
5x Mode: Balanced risk management, maximum 5x scaling
5x Big Mode: Aggressive growth with faster position increases
Dynamic Take-Profit System
6-Level Profit Targets:
TP1: 2.2×ATR (Close 30%)
TP2: 4.5×ATR (Close 25%)
TP3: 7.5×ATR (Close 20%)
TP4: 10.5×ATR (Close 10%)
TP5: 15.5×ATR (Close 7%)
TP6: 20.5×ATR (Close 3%)
ATR Adaptive Adjustment:
Short-term ATR > Long-term ATR: TP distance +0.5
Short-term ATR < Long-term ATR: TP distance -0.5
🟠 Configuration Parameters
Core Settings
pinescript
// Trend Sensitivity
key_value = 2.0 // ATR multiplier (lower = more sensitive)
supertrend_factor = 3.0 // SuperTrend factor
// Risk Management
risk_percent = 19.9 // Per trade risk %
leverage = 1.0 // Leverage multiplier
Hull MA Configuration
pinescript
length = 73 // Hull period (55-200)
modeSwitch = "Hma" // Hull variant (Hma/Thma/Ehma)
🟠 Quick Start Guide
Initial Setup
Apply to BTCUSDT perpetual 15-minute chart
Configure Webhook Signal ID and User ID
Adjust position parameters according to risk preference
Signal Monitoring
Long Signals: Green arrows with Hull MA turning green
Short Signals: Red arrows with Hull MA turning red
Trend Direction: SuperTrend line color changes
Execution Workflow
Wait for triple-signal confluence
Confirm all entry conditions met
System automatically calculates position size and TP levels
Webhook sends trade instructions to connected platform
Advanced Features
Heikin-Ashi Mode: Smooth price data using Heikin-Ashi candles
Fixed Position Mode: Disable martingale, use fixed sizing
Multi-Timeframe: Higher timeframe confirmation integration
🟠 ETH SuperTrend Hull Strategy - 15min Futures
策略概述
"ETH超级趋势Hull策略"是一款专为比特币永续合约设计的15分钟短线交易系统。该策略融合超级趋势指标与Hull均线,通过三重过滤机制实现高精度趋势跟踪,具备智能仓位管理和多级止盈体系。
核心价值
三重趋势确认:Supertrend + Hull均线 + ATR波动过滤
自适应止盈系统:6级动态止盈,根据市场波动调整目标
智能仓位管理:支持三种倍投模式,自动调整仓位规模
实时Webhook通知:直连交易平台,实现自动化执行
🟠 策略原理
趋势识别系统
第一层 - 超级趋势过滤
pinescript
= ta.supertrend(supertrend_factor, supertrend_atr_period)
is_supertrend_long = direction < 0 // 绿色趋势线
is_supertrend_short = direction >= 0 // 红色趋势线
第二层 - Hull均线确认
pinescript
HMA = HMA(close, 73) // Hull移动平均线
hull_is_green = HULL > HULL // 上升趋势
hull_is_red = HULL <= HULL // 下降趋势
第三层 - ATR突破信号
pinescript
xATR = ta.atr(5)
nLoss = key_value * xATR // 动态止损距离
入场条件
多头入场:
价格突破ATR追踪止损
Hull均线呈绿色上升趋势
超级趋势显示看涨信号
价格位于Hull均线上方
空头入场:
价格跌破ATR追踪止损
Hull均线呈红色下降趋势
超级趋势显示看跌信号
价格位于Hull均线下方
🟠 风险管理
仓位计算
text
基础仓位 = 初始资金 × 风险比例% / 入场价格 × 杠杆倍数
实际仓位 = 基础仓位 × 倍投系数 (1.0-5.0倍)
倍投模式
4倍模式:保守型,最大4倍加仓
5倍模式:均衡型,最大5倍加仓
5倍大模式:激进型,更快仓位增长
动态止盈系统
6级止盈目标:
TP1: 2.2×ATR (平仓30%)
TP2: 4.5×ATR (平仓25%)
TP3: 7.5×ATR (平仓20%)
TP4: 10.5×ATR (平仓10%)
TP5: 15.5×ATR (平仓7%)
TP6: 20.5×ATR (平仓3%)
ATR自适应调整:
短期ATR > 长期ATR:止盈距离+0.5
短期ATR < 长期ATR:止盈距离-0.5
🟠 参数配置
核心参数
pinescript
// 趋势敏感度
key_value = 2.0 // ATR乘数,值越小越敏感
supertrend_factor = 3.0 // 超级趋势因子
// 风险管理
risk_percent = 19.9 // 单次交易风险%
leverage = 1.0 // 杠杆倍数
Hull均线设置
pinescript
length = 73 // Hull周期 (55-200)
modeSwitch = "Hma" // Hull变体 (Hma/Thma/Ehma)
🟠 使用指南
初始设置
添加到BTCUSDT永续合约15分钟图表
配置Webhook信号ID和用户ID
根据风险偏好调整仓位参数
信号监控
多单信号:绿色箭头,Hull均线转绿
空单信号:红色箭头,Hull均线转红
趋势方向:超级趋势线颜色变化
执行流程
等待三重信号共振
确认入场条件满足
系统自动计算仓位和止盈
通过Webhook发送交易指令
高级功能
K线均线模式:使用Heikin-Ashi平滑价格
固定仓位模式:禁用倍投,固定仓位大小
多时间框架:集成更高时间框架确认

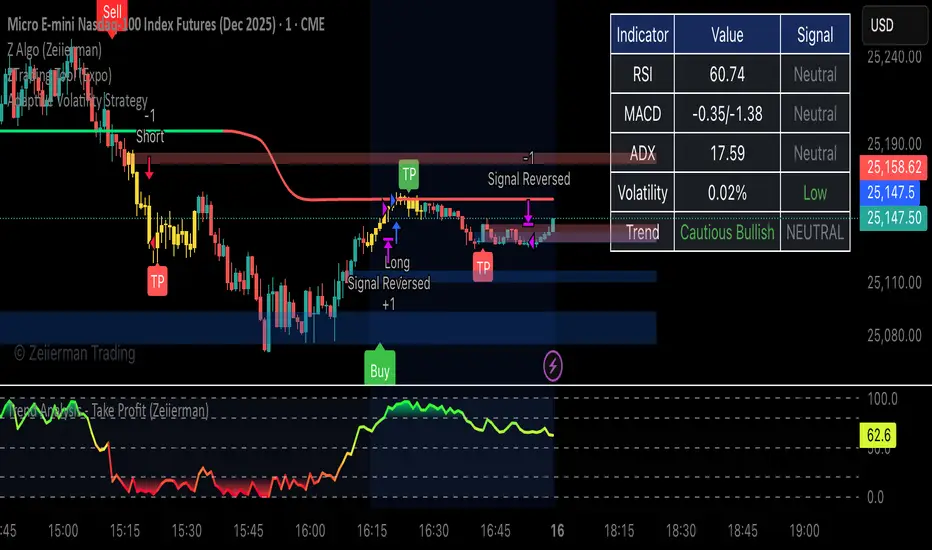
Adaptive Volatility StrategyHere's a professional description for publishing your indicator:
Adaptive Volatility Strategy - Multi-Indicator Confirmation System
A comprehensive trading strategy that combines multiple technical indicators with adaptive volatility filtering to identify high-probability trade setups while managing risk effectively.
Key Features:
Multi-Indicator Confirmation: Combines RSI, MACD, and ADX signals with trend analysis (20/50/200 EMAs) to reduce false signals and improve entry quality
Adaptive Volatility Filter: Intelligent volatility detection using ATR that can filter trades based on either fixed percentage thresholds or multiples of average volatility, helping avoid unstable market conditions
Flexible Session Filtering: Optional time-based trading windows with customizable hours and trading days to align with your preferred market sessions
Smart Signal Generation: Requires minimum signal confirmations before entering trades, with separate tracking for directional and confirmation signals
Comprehensive Risk Management: Configurable take profit and stop loss percentages with automatic position exits on signal reversals
Real-Time Dashboard: Visual display showing current indicator values, signals, volatility levels, and trend direction for quick market assessment
Strategy Logic:
Enters long when bullish signals outnumber bearish signals (minimum 2 signals) with ADX confirmation
Enters short when bearish signals outnumber bullish signals with ADX confirmation
All trades must pass volatility and session filters when enabled
Exits on take profit, stop loss, or signal reversal
Best Used For:
Swing trading on 1H to daily timeframes
Markets with clear trending behavior
Traders who prefer multiple confirmations before entering positions
Note: This is a complete strategy with entry/exit logic. Backtest thoroughly and adjust parameters for your specific instrument and timeframe before live trading.
Supertrend +QQE + DEMASupertrend + QQE + DEMA — Strategy
Inspired by UNITED and my best friend ChatGPT
This strategy combines dual Supertrends, a QQE trend filter, and a 200-period DEMA directional filter to generate structured, trend-aligned entries. It is designed for Heikin Ashi charts , where trend noise is reduced and swing structure becomes clearer.
How It Works
The system fires a trade only when all conditions agree:
1. Both Supertrends flip in the same direction
This identifies strong directional shifts and removes weak reversals.
2. QQE Trend Confirmation
QQE acts as a momentum filter, requiring either a green (bullish) or red (bearish) state with optional consecutive-bar confirmation.
3. 200 DEMA Filter
Only longs above the DEMA and only shorts below the DEMA.
This keeps trades aligned with the higher-timeframe trend.
Because each component filters the other, signals are high-quality, controlled, and structured rather than frequent or reactive.
Expected Performance
Based on the design and typical market testing, this combination yields a 50–70% win rate, depending on:
The market (best on indices like NQ/MNQ, ES/MES, DAX, etc.)
Volatility conditions
Whether used on Heikin Ashi , which increases trend-cleanliness and reduces chop
Timeframe (1m–5m often optimal for intraday)
The system avoids rapid flip-flopping by using “arm → confirm → fire once” logic, which further improves win consistency and reduces whipsaw losses.
How to Properly Use It (IMPORTANT)
This strategy is meant to be run on a Heikin Ashi chart.
Why?
Heikin Ashi smooths candles, giving clearer:
Trend transitions
Pullbacks
Momentum continuation
Supertrend reliability
Running this on normal candles will still work, but the win rate and smoothness drop significantly because Supertrend + QQE respond more cleanly to HA structure.
Trade Behavior
Longs trigger when both Supertrends flip up, QQE is bullish, and price is above DEMA.
Shorts trigger when both Supertrends flip down, QQE is bearish, and price is below DEMA.
Strategy closes when the opposite Supertrend flip occurs.
Alerts fire automatically for buy/sell confirmations.
Best Use Cases
Intraday trend trading
Momentum continuation after a confirmed reversal
Avoiding chop with multi-layer confirmation
Backtesting rule-based execution

Qullamagi EMA Breakout Autotrade (Crypto Futures L+S)Title: Qullamagi EMA Breakout – Crypto Autotrade
Overview
A crypto-focused, Qullamagi-style EMA breakout strategy built for autotrading on futures and perpetual swaps.
It combines a 5-MA trend stack (EMA 10/20, SMA 50/100/200), volatility contraction boxes, volume spikes and an optional higher-timeframe 200-MA filter. The script supports both long and short trades, partial take profit, trailing MA exits and percent-of-equity position sizing for automated crypto futures trading.
Key Features (Crypto)
Qullamagi MA Breakout Engine – trades only when price is aligned with a strong EMA/SMA trend and breaks out of a tight consolidation range. Longs use: Close > EMA10 > EMA20 > SMA50 > SMA100 > SMA200. Shorts are the mirror condition with all MAs sloping in the trend direction.
Strict vs Loose Modes – Strict (Daily) is designed for cleaner swing trades on 1H–4H (full MA stack, box+ATR and volume filters, optional HTF filter). Loose (Intraday) focuses on 10/20/50 alignment with relaxed filters for more frequent 15m–30m signals.
Volatility & Volume Filters for Crypto – ATR-based box height limit to detect volatility contraction, wide-candle filter to avoid chasing exhausted breakouts, and a volume spike condition requiring current volume to exceed an SMA of volume.
Higher-Timeframe Trend Filter (Optional) – uses a 200-period SMA on a higher timeframe (default: 1D). Longs only when HTF close is above the HTF 200-SMA, shorts only when it is below, helping avoid trading against dominant crypto trends.
Autotrade-Oriented Trade Management – position size as % of equity, initial stop anchored to a chosen MA (EMA10 / EMA20 / SMA50) with optional buffer, partial take profit at a configurable R-multiple, trailing MA exit for the remainder, and an optional cooldown after a full exit.
Markets & Timeframes
Best suited for BTC, ETH and major altcoin futures/perpetuals (Binance, Bybit, OKX, etc.).
Strict preset: 1H–4H charts for classic Qullamagi-style trend structure and fewer fake breakouts.
Loose preset: 15m–30m charts for higher trade frequency and more active intraday trading.
Always retune ATR length, box length, volume multiplier and position size for each symbol and exchange.
Strategy Logic (Quick Summary)
Long (Strict): MA stack in bullish alignment with all MAs sloping up → tight volatility box (ATR-based) → volume spike above SMA(volume) × multiplier → breakout above box high (close or intrabar) → optional HTF close above 200-SMA.
Short: Mirror logic: bearish MA stack, tight box, volume spike and breakdown below box low with optional HTF downtrend.
Best Practices for Crypto
Backtest on each symbol and timeframe you plan to autotrade, including commissions and slippage.
Start on higher timeframes (1H/4H) to learn the behavior, then move to 15m–30m if you want more signals.
Use the higher-timeframe filter when markets are strongly trending to reduce counter-trend trades.
Keep position-size percentage conservative until you fully understand the drawdowns.
Forward-test / paper trade before connecting to live futures accounts.
Webhook / Autotrade Integration
Designed to work with TradingView webhooks and external crypto trading bots.
Alert messages include structured fields such as: EVENT=ENTRY / SCALE_OUT / EXIT, SIDE=LONG / SHORT, STRATEGY=Qullamagi_MA.
Map each EVENT + SIDE combination to your bot logic (open long/short, partial close, full close, etc.) on your preferred exchange.
Important Notes & Disclaimer
Crypto markets are highly volatile and can change regime quickly. Backtest and forward-test thoroughly before using real capital. Higher timeframes generally produce cleaner MA structures and fewer fake breakouts.
This strategy is for educational and informational purposes only and does not constitute financial advice. Trading leveraged crypto products involves substantial risk of loss. Always do your own research, manage risk carefully, and never trade with money you cannot afford to lose.

Trilok saini EMA Pullback + MACD + ADX Strategy📌 HA Double EMA Pullback + MACD + ADX Strategy — Description
This strategy combines Heikin Ashi candles, Double EMA pullbacks, MACD momentum filtering, and ADX trend-strength confirmation to generate high-probability trend-continuation signals.
It is designed to avoid choppy markets and focus only on strong trending conditions.
🔥 Key Features
1️⃣ Heikin Ashi Trend Analysis
Heikin Ashi candles are calculated on the selected timeframe.
They smooth out market noise to highlight clear bullish or bearish trends.
Trend direction is displayed in a live info table.
2️⃣ Double EMA Pullback Logic
The main signal engine of this strategy:
Buy conditions
Price crosses above EMA 20
EMA 20 > EMA 50 (confirming uptrend)
A pullback is detected using the back-step (price was above EMA earlier)
MACD + ADX filters approve the trade
Sell conditions
Price crosses below EMA 20
EMA 20 < EMA 50 (confirming downtrend)
Pullback confirmation based on earlier price action
MACD + ADX filters approve the trade
This logic focuses on trend continuation instead of reversal setups.
3️⃣ MACD Momentum Filter
Buy signals appear only when MACD histogram is positive (green).
Sell signals appear only when MACD histogram is negative (red).
Prevents entries during weak or directionless momentum.
4️⃣ ADX Trend Strength Filter
Signals are blocked when ADX is below the selected threshold.
Ensures trades happen only in strong trending markets, reducing false signals.
5️⃣ Visual Enhancements
Clean Heikin Ashi candles with customizable colors
Optional regular candles for comparison
EMA overlays on HA candles
Buy/Sell labels with customizable text
Info table showing:
Trend direction
HA close
Regular close
EMA values
ADX reading
Active filters
🎯 Ideal Use Cases
Trend-following traders
Swing traders
Intraday traders who want filtered signals
Anyone wanting fewer false signals in sideways markets
⚠️ Disclaimer
This script is for educational and research purposes only.
Past performance does not guarantee future results. Always backtest and use proper risk management.

LiquiBreak — Semi-Automatic Breakout, Gap & Trend-Filter StrategLiquiBreak is a semi-automatic breakout + gap detection strategy that combines pivots, a volatility filter and an optional Supertrend direction check to generate entry signals. It can optionally place take-profit and stop-loss orders in points. Use it to highlight high-probability breakout/gap setups and to automate exits when you want — otherwise treat its signals as trade alerts that require your confirmation.
📌 LiquiBreak — Semi-Automatic Breakout, Gap & Trend Strategy
1. Overview
1. LiquiBreak is a semi-automatic breakout + gap strategy designed to catch high-quality moves with volatility confirmation.
2. Uses pivot-based support/resistance , gap detection , Supertrend filtering , and optional automatic TP/SL in points .
3. Works on all assets and timeframes, especially effective on XAUUSD, Indices, Crypto and FX pairs .
---
2. What This Script Detects
1. Breakouts above resistance and below support during strong volatility.
2. Bullish & bearish gap patterns confirmed with momentum sequences.
3. Dynamic volatility zones based on normalized ATR ranges.
4. Optional Supertrend trend direction for filtering bad signals.
5. Automatic TP/SL orders when enabled.
---
3. Recommended Indicators to Combine With
To increase accuracy and reduce false breakouts:
1. Supertrend (included) – best for trend direction.
2. EMA 9/21 or EMA 20/50 – confirms trend strength & pullbacks.
3. RSI or Stoch RSI – avoid overbought/oversold breakouts.
4. VWAP – institutional bias & fair value zones.
5. CPR / Pivot Points – confluence with breakout levels.
6. MACD – trend confirmation on higher timeframe.
7. Volume Profile (optional) – find breakout liquidity zones.
These indicators help filter low-quality signals without affecting the script’s core logic.
---
4. Key Features
1. Volatility-based pivot support & resistance .
2. Reliable breakout confirmation using real-time volatility strength.
3. Strong gap pattern detection with ATR threshold.
4. Optional Supertrend confirmation for safer entries.
5. Point-based Take Profit / Stop Loss .
6. Toggle on/off: Longs, Shorts, TP, SL .
7. Semi-automatic execution — not fully automated.
8. Clean, optimized structure for stability and speed.
---
5. Inputs / Settings
1. Pivot / Levels Period – defines structural S/R levels.
2. Volatility Filter (%) – prevents low-quality signals.
3. TP Points – automatic take-profit target.
4. SL Points – automatic stop-loss.
5. Enable TP / Enable SL – full exit control.
6. Allow Long / Allow Short – direction control.
7. Supertrend Filter – filter weak counter-trend trades.
---
6. How to Use the Strategy
1. Select timeframe & tune pivot/volatility settings.
2. Enable/disable automatic TP/SL based on your style.
3. Turn ON Supertrend for safer trend-based trades.
4. Confirm signals using EMA, RSI, VWAP, Volume or CPR.
5. Watch for high-volatility breakouts near key levels.
6. Use multiple timeframe analysis for stronger confirmation.
---
7. Important Warning (User Must Monitor Trades)
⚠ This script is NOT a fully automatic bot.
1. You MUST monitor the chart while using this strategy.
2. You MUST manually close trades if market conditions change.
3. Auto TP/SL helps, but during news events or fast markets, slippage may occur.
4. Treat this script as a signal + entry assistant , not a fire-and-forget system.
---
8. Best Practices
1. Works best on XAUUSD, NAS100, BTC, ETH, EURUSD .
2. Avoid major news unless experienced.
3. Increase volatility filter during choppy markets.
4. Use M15–H1 for clean breakouts; M5 for scalping.
5. For beginners: keep TP/SL enabled for safety.
6. Backtest first → then paper trade → then live trade.
---
9. Disclaimer
1. For educational and research purposes only .
2. Not financial advice.
3. User is fully responsible for their trades and risk.
4. Past performance does not guarantee future results.

Braid Filter StrategyThis strategy is like a sophisticated set of traffic lights and speed limit signs for trading. It only allows a trade when multiple indicators line up to confirm a strong move, giving it its "Braid Filter" name—it weaves together several conditions.
The strategy is set up to use 100% of your account equity (your trading funds) on a trade and does not "pyramid" (it won't add to an existing trade).
1. The Main Trend Check (The Traffic Lights)
The strategy uses three main filters that must agree before it considers a trade.
A. The "Chad Filter" (Direction & Strength)
This is the heart of the strategy, a custom combination of three different Moving AveragesThese averages have fast, medium, and slow settings (3, 7, and 14 periods).
Go Green (Buy Signal): The fastest average is higher than the medium average, AND the three averages are sufficiently separated (not tangled up, which indicates a strong move).
Go Red (Sell Signal): The medium average is higher than the fastest average, AND the three averages are sufficiently separated.
Neutral (Wait): If the averages are tangled or the separation isn't strong enough.
Key Trigger: A primary condition for a signal is when the Chad Filter changes color (e.g., from Red/Grey to Green).
B. The EMA Trend Bars (Secondary Confirmation)
This is a simpler, longer-term filter using a 34-period Exponential Moving Average (EMA). It checks if the current candle's average price is above or below this EMA.
Green Bars: The price is above the 34 EMA (Bullish Trend).
Red Bars: The price is below the 34 EMA (Bearish Trend).
Trades only happen if the signal direction matches the bar color. For a Buy, the bar must be Green. For a Sell, the bar must be Red.
C. ADX/DI Filter (The Speed Limit Sign)
This uses the Average Directional Index (ADX) and Directional Movement Indicators (DI) to check if a trend is actually in motion and getting stronger.
Must-Have Conditions:
The ADX value must be above 20 (meaning there is a trend, not just random movement).
The ADX line must be rising (meaning the trend is accelerating/getting stronger).
The strategy will only trade when the trend is strong and building momentum.
2. The Trading Action (Entry and Exit)
When all three filters (Chad Filter color change, EMA Trend Bar color, and ADX strength/slope) align, the strategy issues a signal, but it doesn't enter immediately.
Entry Strategy (The "Wait-for-Confirmation" Approach):
When a Buy Signal appears, the strategy sets a "Buy Stop" order at the signal candle's closing price.
It then waits for up to 3 candles (Candles Valid for Entry). The price must move up and hit that Buy Stop price within those 3 candles to confirm the move and enter the trade.
A Sell Signal works the same way but uses a "Sell Stop" at the closing price, waiting for the price to drop and hit it.
Risk Management (Stop Loss and Take Profit):
Stop Loss: To manage risk, the strategy finds a recent significant low (for a Buy) or high (for a Sell) over the last 20 candles and places the Stop Loss there. This is a logical place where the current move would be considered "broken" if the price reaches it.
Take Profit: It uses a fixed Risk:Reward Ratio (set to 1.5 by default). This means the potential profit (Take Profit distance) is $1.50 for every $1.00 of risk (Stop Loss distance).
3. Additional Controls
Time Filter: You can choose to only allow trades during specific hours of the day.
Visuals: It shows a small triangle on the chart where the signal happens and colors the background to reflect the Chad Filter's trend (Green/Red/Grey) and the candle bars to show the EMA trend (Lime/Red).
🎯 Summary of the Strategy's Goal
This strategy is designed to capture strong, confirmed momentum moves. It uses a fast, custom indicator ("Chad Filter") to detect the start of a new move, confirms that move with a slower trend filter (34 EMA), and then validates the move's strength with the ADX. By waiting a few candles for the price to hit the entry level, it aims to avoid false signals.

Braid Filter StrategyAnother of TradeIQ's youtube strategies. It looks a little messy but it combines all the indicators into one so there are no extra panes. This strategy is like a sophisticated set of traffic lights and speed limit signs for trading. It only allows a trade when multiple indicators line up to confirm a strong move, giving it its "Braid Filter" name—it weaves together several conditions.
The strategy is set up to use 100% of your account equity (your trading funds) on a trade and does not "pyramid" (it won't add to an existing trade).
1. The Main Trend Check (The Traffic Lights)
The strategy uses three main filters that must agree before it considers a trade.
A. The "Braid Filter" (Direction & Strength)
This is the heart of the strategy, a custom combination of three different Moving Averages
These averages have fast, medium, and slow settings (3, 7, and 14 periods).
Go Green (Buy Signal): The fastest average is higher than the medium average, AND the three averages are sufficiently separated (not tangled up, which indicates a strong move).
Go Red (Sell Signal): The medium average is higher than the fastest average, AND the three averages are sufficiently separated.
Neutral (Wait): If the averages are tangled or the separation isn't strong enough.
Key Trigger: A primary condition for a signal is when the Chad Filter changes color (e.g., from Red/Grey to Green).
B. The EMA Trend Bars (Secondary Confirmation)
This is a simpler, longer-term filter using a 34-period Exponential Moving Average (EMA). It checks if the current candle's average price is above or below this EMA.
Green Bars: The price is above the 34 EMA (Bullish Trend).
Red Bars: The price is below the 34 EMA (Bearish Trend).
Trades only happen if the signal direction matches the bar color. For a Buy, the bar must be Green. For a Sell, the bar must be Red.
C. ADX/DI Filter (The Speed Limit Sign)
This uses the Average Directional Index (ADX) and Directional Movement Indicators (DI) to check if a trend is actually in motion and getting stronger.
Must-Have Conditions:
The ADX value must be above 20 (meaning there is a trend, not just random movement).
The ADX line must be rising (meaning the trend is accelerating/getting stronger).
The strategy will only trade when the trend is strong and building momentum.
2. The Trading Action (Entry and Exit)
When all three filters (Chad Filter color change, EMA Trend Bar color, and ADX strength/slope) align, the strategy issues a signal, but it doesn't enter immediately.
Entry Strategy (The "Wait-for-Confirmation" Approach):
When a Buy Signal appears, the strategy sets a "Buy Stop" order at the signal candle's closing price.
It then waits for up to 3 candles (Candles Valid for Entry). The price must move up and hit that Buy Stop price within those 3 candles to confirm the move and enter the trade.
A Sell Signal works the same way but uses a "Sell Stop" at the closing price, waiting for the price to drop and hit it.
Risk Management (Stop Loss and Take Profit):
Stop Loss: To manage risk, the strategy finds a recent significant low (for a Buy) or high (for a Sell) over the last 20 candles and places the Stop Loss there. This is a logical place where the current move would be considered "broken" if the price reaches it.
Take Profit: It uses a fixed Risk:Reward Ratio (set to 1.5 by default). This means the potential profit (Take Profit distance) is $1.50 for every $1.00 of risk (Stop Loss distance).
3. Additional Controls
Time Filter: You can choose to only allow trades during specific hours of the day.
Visuals: It shows a small triangle on the chart where the signal happens and colors the background to reflect the Chad Filter's trend (Green/Red/Grey) and the candle bars to show the EMA trend (Lime/Red).
🎯 Summary of the Strategy's Goal
This strategy is designed to capture strong, confirmed momentum moves. It uses a fast, custom indicator ("Chad Filter") to detect the start of a new move, confirms that move with a slower trend filter (34 EMA), and then validates the move's strength with the ADX. By waiting a few candles for the price to hit the entry level, it aims to avoid false signals.

FVG Session Break Strategy with ATR RR🧠 FVG Session Break Strategy with ATR RR — Timezone-Aware, Session-Savvy, and Risk-Calibrated
This strategy captures high-probability reversals and continuations by combining Fair Value Gap (FVG) imbalances with session-based breakout logic and ATR-calibrated risk management. It’s designed for traders who want to exploit structural inefficiencies during key market sessions — with precision and portability across global exchanges.
🔍 Core Logic:
Fair Value Gap Detection: Identifies bullish and bearish FVGs using a 3-bar displacement pattern.
Session Breakout Engine: Tracks session highs and lows (Asian, London, NY) and triggers trades only when price breaks these levels — ensuring trades occur at meaningful inflection points.
ATR-Based RR Control: Dynamically sizes stop-loss and take-profit levels using ATR × multiplier, maintaining consistent risk across volatility regimes.
🌐 Timezone-Aware Session Logic:
Session boundaries are defined in UTC-5 (e.g., NY: 0930–1600) but automatically converted to the exchange’s local timezone using timestamp("Etc/GMT+5", ...). This ensures:
Accurate session detection across all markets and assets
No manual timezone adjustments needed
Robust performance on crypto, forex, and global equities
📈 Visuals:
Session highs and lows plotted in orange
Bullish and bearish FVGs marked with green and red triangles
Strategy entries and exits shown on chart with full RR logic
This strategy is ideal for traders who want to combine structural edge with session context and disciplined risk.

The Butterfly Elephant EffectStrategy Overview: The Butterfly Elephant Effect
Concept & Philosophy:
Welcome to "The Butterfly Elephant Effect," a sophisticated multi-indicator strategy that operates on the principle that small, precise technical signals (the Butterfly) can trigger significant market moves (the Elephant Effect). This strategy is designed to identify high-probability reversal points by combining three powerful analytical systems into one cohesive framework. It seeks to catch major trend reversals at key support and resistance levels, using a confluence of volume, momentum, and overbought/oversold oscillators.
Core Components:
The strategy intelligently synthesizes three distinct systems:
Lucky Balls System (Volume & Trend):
Utilizes the Negative Volume Index (NVI) and Positive Volume Index (PVI) to understand smart money activity and trend strength.
Plots these indices on the price chart, scaled to the recent price range for actionable signals.
Generates signals when price interacts with a moving average envelope, identifying potential exhaustion points.
Momentum Confirmation System:
Combines RSI, CCI, and PPO momentum oscillators into a single, refined line.
This "Momentum Composite" line is used to confirm the strength of a reversal signal as it crosses the dynamic envelope bands.
Lucky Table System (Market Breadth & Confluence):
This is the heart of the strategy's filtering mechanism. It runs 36 different oscillator readings across 6 different timeframes for Stochastic, Williams %R, RSI, and MACD.
It counts the number of these oscillators that are in extreme overbought or oversold territory.
A "Lucky Table" signal is generated when the number of matching oscillators exceeds your customizable threshold (e.g., 30 out of 36), indicating a massive, multi-timeframe consensus on market exhaustion.
The Ultimate Signals:
The strategy's most powerful entries are the specially named signals that require a perfect storm of conditions:
🐘 Elephant Long Signal: Triggers when the Momentum System gives a buy, the Lucky Table shows extreme oversold consensus, AND the price is at or below the adjusted lower envelope band. This represents a potential major bullish reversal from a support zone.
🦋 Butterfly Short Signal: Triggers when the Momentum System gives a sell, the Lucky Table shows extreme overbought consensus, AND the price is at or above the adjusted upper envelope band. This represents a potential major bearish reversal from a resistance zone.
Key Features:
Visual Clarity: A rich set of plotshapes (🪜, 🐍, 🐸, ✈️, ⚽) makes it easy to identify the contributing signals from each subsystem on the chart.
Comprehensive Dashboard: A real-time table displays all 36 oscillator values from the Lucky Table, color-coded for quick assessment of market conditions.
Flexible Risk Management: Includes optional Profit Target and Stop Loss based on a percentage of entry price.
Highly Customizable: Every parameter—from lookback lengths and scale factors to the crucial match threshold—can be adjusted to fit your trading style and instrument.
How to Use:
Add the strategy to your chart.
Look for the primary Elephant (🐘) or Butterfly (🦋) signals near the envelope boundaries.
Use the Lucky Table on the top-right to confirm the strength of the oversold/overbought conditions.
Manage your trade using the built-in PT/SL or your own discretion.
Ideal For: Swing traders and position traders looking for high-conviction entries at potential market turning points.
Disclaimer: This is a complex strategy designed for educational and research purposes. Always test and forward-test any strategy in a simulated environment before committing real capital. Past performance is not indicative of future results.
PS Look out for the Frog :-)

Velocity SmartMoney Engine work - Delta Exchange📈 Velocity SmartMoney Engine
Adaptive Breakout & Order Block Strategy with Dynamic Risk Control
---
🔍 Overview
The Velocity SmartMoney Engine is a next-generation trading strategy that fuses Smart Money breakout logic , Order Block structure detection , and Supertrend-based directional filtering into one precision-built system.
It identifies institutional-level breakouts , manages positions with ATR-based adaptive risk , and executes disciplined exits using stop-loss, trailing stop, and profit target logic.
Designed for swing and short-term system traders, this strategy performs excellently on BTC, ETH, NIFTY, BANKNIFTY, Gold, and major FX pairs — best on 15m to 4h timeframes .
---
⚙️ Core Components
1️⃣ Smart Money Breakout Logic
Detects real breakouts using dynamic support/resistance pivots.
Confirms entries only during strong volatility bursts.
Avoids false breakouts in sideways markets.
2️⃣ Order Block Gap Detection
Finds institutional imbalance zones (Smart Money footprints).
Bullish gaps = Long bias; Bearish gaps = Short bias.
Works with candle confirmation and momentum validation.
3️⃣ Supertrend Directional Filter
Trades only in direction of Supertrend bias.
Exits instantly when Supertrend flips.
Prevents entries against dominant trend.
4️⃣ ATR-Based Risk & Volatility Filter
Uses ATR × multiplier for adaptive stop sizing.
Volatility filter ensures trades trigger only during active markets.
Avoids whipsaw zones.
---
💰 Position Management
Stop-Loss: Adaptive ATR-based.
Take-Profit: Default 5% target (editable input).
Trailing Stop: Auto-adjusts to lock profits.
No-Exit Hold: Hold position for defined candles before exits.
Supertrend Flip Exit: Instant trend-based closure.
---
🧠 Built-In Trade Discipline
One-trade-per-bar guard prevents duplicate entries.
Volatility-weighted breakout validation.
Clean and conflict-free exit hierarchy.
---
🎯 Key Features
✅ Smart Money breakout + Order Block fusion
✅ Supertrend-based trend confirmation
✅ ATR dynamic stop + 5% profit target
✅ Adaptive trailing logic
✅ One-trade-per-bar control
✅ Works across Crypto, Indices, FX, Commodities
✅ Ideal for 1h–4h swing setups
---
📊 Recommended Settings
Parameter | Typical Value | Purpose
--- | --- | ---
Levels Period | 20 | Pivot lookback for S/R zones
Volatility Filter | 20–40 | Filters out low-momentum areas
ATR Multiplier | 1.5 | Adjust stop size by volatility
Supertrend Length | 10 | ATR period for trend bias
Supertrend Multiplier | 3.0 | Supertrend sensitivity
Target Profit | 5% | Default take-profit level
---
⚡ Suggested Use
• Best suited for swing entries on 1H / 4H charts .
• Combine with session filters or trend confluence for automation.
• Ideal as a base module for TradingView + Broker integrations .
---
🧩 Disclaimer
This script is for educational purposes only .
Past performance does not guarantee future returns.
Use responsibly. The developer assumes no liability for financial losses.
---
💬 Community & Access
Developed by: Shubham Singh
Version: Velocity SmartMoney Engine v1.0
For premium modules & automation: DM "Velocity Access" on chat to request access.
---
© 2025 Velocity SmartMoney Engine — All Rights Reserved

TitanEdge Algo Suite — 4H BTC & ETH (Delta Exchange Ready)TitanEdge Algo Suite — 4H BTC & ETH (Delta Exchange Ready)
TitanEdge Algo Suite is a next-generation trading system that fuses volatility-adaptive logic, order-block structure, SuperTrend direction filtering, and ATR-based exits into a single modular framework.
It’s engineered for 4-hour BTC and ETH swing trading, delivering institutional-grade entries, dynamic risk control, and precise exits.
⚙️ Core Features
1. Volatility Oscillator (0–100)
• Filters trades by volatility intensity.
• Uses ATR, Range, or Bollinger Band Width normalization.
• Trades trigger only when market volatility is high — filtering out sideways or weak trends.
• Ensures trades occur during real momentum expansions.
2. Breakout + Order Block Engine
• Detects pivot highs/lows to confirm authentic breakout levels.
• Identifies “smart money” gaps — institutional imbalance zones often leading to strong reversals or continuations.
• Captures both breakout continuations and order-block reversals.
• Works as a hybrid structure detector combining price action and volatility alignment.
3. SuperTrend Directional Filter
• Optional filter that only allows trades in the direction of the SuperTrend.
• Can automatically close trades when a SuperTrend flip occurs.
• Provides strong trend-following bias and helps avoid countertrend traps.
4. ATR-Based Stop & Trailing System
• Adaptive stop-loss and trailing logic that expands or tightens based on volatility.
• Supports three modes: StopOnly, TrailOnly, and StopAndTrail.
• Works in both ATR-based distance or percentage-based configuration.
• Keeps losing trades small and lets winning trades extend dynamically.
5. Volume-Based Exit Logic
• Detects low-volume exhaustion to identify momentum loss.
• Detects opposite-volume spikes as early reversal signals.
• Optional hybrid “Both” mode combines both detection methods for stronger reliability.
• Ideal for markets where volume surges indicate smart money exits or trap formations.
6. Session Filter & Anti-Churn Control
• Restrict trading hours (optional; not required for crypto).
• Prevents repeated signals and noise-based entries through minimum bars between trades.
• Cooldown logic ensures disciplined trading and avoids strategy overlap.
• Prevents multiple entries in a single bar and filters unconfirmed breakouts.
7. SmartMoney Preset Mode
• Institutional-grade configuration automatically adjusting volatility, ATR, and structural logic.
• Mimics smart money behavior by prioritizing clean structure and high liquidity volatility zones.
• Great for traders who want simplified institutional logic without manual tuning.
Optimized for 4H BTC & ETH
TitanEdge performs best on BTCUSDT and ETHUSDT pairs in the 4-hour timeframe.
The 4H chart captures high-volatility institutional swings, eliminates intraday noise, and provides clear order-block setups.
This timeframe aligns with BTC/ETH volatility cycles, providing consistent signals and cleaner trend confirmation.
Recommended settings for 4H charts:
• Levels Period: 25
• Volatility Filter: 20
• volatility oscillator Auto: disable ( it depend upon your plan test with Disable/enable)
• Volatility Method: BBWidth
• ATR Multiplier: 1.8
• ATR Stop %: 5
• SuperTrend ATR Length: 10
• SuperTrend Factor: 3
• ATR Mode: StopAndTrail
• Hold Bars: 1
• Volume Exit: Disable (Both)
• Session Filter: Off (Crypto runs 24/7)
Entry Logic
• Long Entry: Price breaks above resistance (pivot high), volatility above threshold, and optional SuperTrend confirmation.
• Short Entry: Price breaks below support (pivot low), volatility above threshold, and optional bearish SuperTrend confirmation.
• Additional Entry: Triggered by order-block gaps (smart money imbalances) in volatility expansion phases.
• Trades only when both direction and volatility align to ensure precision entries.
Exit Logic
• ATR Stop and Trail dynamically manage open trades.
• SuperTrend Flip forces exit on trend reversal.
• Volume Exit triggers when volume momentum drops or opposite spike occurs.
• Optional session close exit to flatten trades outside hours.
• Logic prevents premature exits with “Hold Bars” delay after entry.
Why You Need TitanEdge Algo Suite
• Trades only during high-volatility, strong-momentum phases — no false breakouts or choppy trades.
• ATR risk control automatically adjusts to each market’s volatility conditions.
• Identifies institutional order-blocks and clean breakouts for precise entries.
• SuperTrend filter adds directional bias, boosting win-rate consistency.
• Volume exit logic ensures profits are protected when market momentum fades.
• Works 24/7 across all major crypto pairs — fully automated and customizable.
• Built for 4H swing trades — fewer but higher-quality setups.
• Fully compatible with TradingView alerts and bot integration for hands-free execution.
How TitanEdge Makes Profit
• TitanEdge only trades during volatility expansion, when breakout continuation probability is statistically high.
• ATR dynamic stops prevent large losses by scaling protection according to real volatility.
• Trend filtering keeps positions aligned with major market flows.
• Order-block detection ensures entries are based on price structure rather than random signals.
• Volume-based exits secure profits early when momentum weakens.
• SmartMoney Preset provides optimal balance between trade frequency, accuracy, and drawdown control.
• The system compounds edge by maintaining trade discipline — fewer but stronger trades over time.
Delta Exchange Integration (TradingView Bot Ready)
TitanEdge is fully compatible with TradingView alert webhooks and can connect to Delta Exchange or any bot-supported broker.
Alert JSON message format:
{"symbol":"{{ticker}}","side":"{{strategy.order.action}}","qty":1,"trigger_time":"{{timenow}}","strategy_id":"code"}
qty 1 represent 1 lot so if you want to take trade with 5 lots or 0.05eth and write
{"symbol":"{{ticker}}","side":"{{strategy.order.action}}","qty":5,"trigger_time":"{{timenow}}","strategy_id":"code"}
Steps to automate:
Create an alert on TradingView using “Once Per Bar Close”.
Paste your bot or automation webhook URL.
Paste the JSON above as the message.
Configure your bot or API bridge (like PineConnector, AutoView, or WunderTrading) to route signals to Delta Exchange.
On Delta, use BTCUSD or ETHUSD Perpetual pairs with moderate leverage (3x–5x).
Enable Cross Margin for smooth drawdown handling.
Test first on Delta Testnet for safety.
Why 4H BTC & ETH Works Best
• 4H candles capture true volatility swings and filter lower-timeframe noise.
• Aligns with institutional liquidity cycles in BTC and ETH.
• ATR and volume-based stops perform optimally on larger bars.
• Smoother equity curve and less drawdown compared to intraday trading.
• Ideal for traders seeking structured, medium-term trades with high reward-to-risk.
Unique Edge
• Combines breakout, order-block, and volatility principles into one adaptive model.
• Incorporates volatility normalization (ATR/BBWidth) for multi-market adaptability.
• Dynamic ATR stops and trailing protect capital during unstable phases.
• Volume and trend exits create layered protection systems.
• 4H optimization eliminates noise and provides clear institutional alignment.
• SmartMoney preset auto-configures settings to mimic large-player behavior.
• Fully automated via webhooks — no manual execution required.
• Modular design lets you customize each component for different trading styles.
TradingView Bot Integration
TitanEdge is fully plug-and-play with all TradingView-compatible bots.
Each alert sends structured JSON data containing direction, symbol, and quantity, ready for execution on your connected broker.
You can route the data to:
• PineConnector (MT4/MT5 bridge)
• WunderTrading
• AutoView
• Custom Node/REST API handler
This makes TitanEdge a professional-grade strategy suitable for semi-automatic or fully automated crypto trading setups.
Professional Recommendations
• Timeframe: 4H
• Instruments: BTCUSDT, ETHUSDT
• Exchange: Delta Exchange (Perpetual Futures)
• Leverage: 3x–5x
• Session Filter: Off (crypto 24/7)
• Risk per trade: 0.5%–1% of total equity
• Alert Type: Once Per Bar Close
• Volatility Filter: 25–35 depending on market activity
• Always use realistic slippage and fees for backtests.
Summary
TitanEdge Algo Suite is a complete trading framework built to deliver institutional-quality precision with full automation support.
It captures powerful volatility expansions on 4H BTC and ETH charts using clean structure, adaptive stops, and directional trend filters.
Every feature — from entry logic to exits — is designed to protect capital and amplify performance through disciplined, volatility-aware execution.
TitanEdge is not just another script — it’s a professional-grade algorithm that combines volatility intelligence, structural precision, and adaptive risk control.
TitanEdge Algo Suite = Smart Logic × Trend Discipline × Adaptive Risk Control
Optimized for BTC & ETH on 4H charts. Built for traders who demand precision, control, and consistency.

FVG Strategy with One Trade Per Hour and Tick-based TP/SLThis strategy hunts for Fair Value Gaps (FVGs)—three-bar displacement gaps that mark imbalances where price moved so fast it left a “void.” It detects bullish (green) and bearish (red) FVGs on the chart timeframe or a higher timeframe you choose via the Timeframe input. Each detected zone is stored and optionally drawn as a box (static or “dynamic” that tightens with price). A simple threshold lets you filter out tiny gaps: either set a fixed percent (Threshold %) or let the script estimate it automatically. As price trades later, the engine watches for interaction with any stored zone.
Entries are taken on a touch/retest of the zone: buy when price intersects a green (bullish) FVG; short when it intersects a red (bearish) FVG. Risk management is manual and straightforward—your stop loss and take profit are set in ticks, placed off the signal bar’s close. To avoid over-trading, there’s a cap of one trade per hour (it resets when the clock hour changes). In short, it’s an intraday “gap fill / bounce” system: identify an imbalance, wait for price to revisit it, and take a directional trade with fixed tick targets and stops.

Momentum Swing 1–3 Weeks
✅ Entry (LONG) Conditions
Price above EMA9 and SMA20
SMA20 > SMA50 (trend confirmation)
MACD above the signal line
RSI between 50–65 (healthy momentum)
Volume at least 20% above the 20-day average
When all conditions align, a LONG signal is generated.
✅ Exit (SELL) Conditions
Price closes below EMA9
MACD gives a bearish crossover
Or TP/SL levels are hit
Position is closed.
✅ Multi-Stage Take Profit
TP1: ATR × 1.5 → closes 50% of the position
TP2: ATR × 3.0 → closes remaining 50%
✅ Stop Loss
ATR × 1.5 dynamic SL
✅ What This Strategy Aims For
Catching early trend continuation signals
Filtering weak / low-volume breakouts
Exiting when momentum fades
Eliminating emotional decision-making through rules
📌 Note
Backtest performance may vary by symbol and volatility. Proper risk management is strongly recommended.

Quantura - Quantified Price Action StrategyIntroduction
“Quantura – Quantified Price Action Strategy” is an invite-only Pine Script strategy designed to combine multiple price action concepts into a single trading framework. It integrates supply and demand zones, liquidity sweeps and runs, fair value gaps (FVGs), RSI filters, and EMA trend confirmation. The strategy also provides a visual overlay with dynamic trend-colored candles for easier chart interpretation. It is intended for multi-market use across cryptocurrencies, Forex, equities, and indices.
Originality & Value
The strategy is original in how it unifies several institutional-style price action elements and validates trades only when they align. This reduces noise compared to using single indicators in isolation. Its unique value lies in the combination of:
Supply & Demand detection: Dynamic boxes identified through pivots, ATR, and volume sensitivity.
Liquidity sweeps and runs: Detects when swing highs/lows are broken and retested, distinguishing between liquidity grabs (sweeps) and directional runs.
RSI filter: Can be set to normal or aggressive, confirming momentum before trades.
Fair Value Gaps (FVGs): Optional detection and filtering of price inefficiencies.
EMA filter: Aligns trades with the broader market trend.
Trend candle visualization: Candles dynamically colored bullish, bearish, or neutral, based on strategy positions.
This layered confluence approach ensures that entries are not taken on a single condition but require agreement across several dimensions of market structure, momentum, and order flow.
Functionality & Indicators
Supply & Demand Zones: Zones are created when pivots, ATR sensitivity, and volume thresholds overlap.
Liquidity: Swing highs and lows are tracked, with options for sweep (fakeout/reversal) or run (continuation) detection.
RSI: Confirms long signals when oversold and shorts when overbought, with configurable aggressiveness.
FVG filter: Adds validation by requiring price interaction with inefficiency zones.
EMA filter: Ensures longs are above EMA and shorts below EMA.
Signals & Visualization: Trade entries are marked on the chart, while candles change color to reflect trade direction and status.
Parameters & Customization
Supply & Demand: Sensitivity (swing range, volume multiplier, ATR multiplier) and display options.
Liquidity filter: Mode (Run or Sweep), display, and swing length.
RSI: Enable/disable, length, and style (normal or aggressive).
Fair Value Gaps: Sensitivity via ATR factor, optional volume filter, and display toggles.
EMA: Length, enable/disable, and visualization.
Risk management: Up to three configurable take-profit levels, stop-loss, break-even logic, and capital-based position sizing.
Visualization: Custom candle coloring and optional overlay for better clarity.
Default Properties (Strategy Settings)
Initial Capital: 10,000 USD
Position Size: 100% of equity per trade (backtest default)
Commission: 0.1%
Slippage: 1
Pyramiding: 0 (only one position at a time)
Note: The default of 100% equity per trade is used for testing purposes only and would not be sustainable in real trading. A typical allocation in practice would be between 1–5% of account equity per trade, sometimes up to 10%.
Backtesting & Performance
Backtests on XPTUSD over 2.5 years with the default settings produced:
164 trades
67.68% win rate
Profit factor: 1.7
Maximum drawdown: 27.81%
These results show how the confluence of supply/demand, liquidity, and RSI filters can produce robust setups. However, past performance does not guarantee future results. While the trade count (164) is sufficient for statistical analysis, results may vary across markets and timeframes.
Risk Management
Three configurable take-profit levels with percentage allocation.
Initial stop-loss based on user-defined percentage.
Dynamic stop-loss that adjusts with market movement.
Break-even logic that shifts stops to entry after predefined gains.
Position sizing based on risk percentage of equity.
This framework allows both conservative and aggressive configurations, depending on user preference.
Limitations & Market Conditions
Works best in volatile and liquid markets such as crypto, metals, indices, and FX.
May produce false signals in low-volume or sideways environments.
Unexpected news or macro events can override technical conditions.
Default position sizing of 100% equity is highly aggressive and should be reduced before any practical use.
Usage Guide
Add “Quantura – Quantified Price Action Strategy” to your chart.
Select Supply & Demand, Liquidity, RSI, EMA, and FVG settings according to your market and timeframe.
Configure risk management: take-profits, stop-loss, and risk-per-trade percentage.
Use the Strategy Tester to analyze statistics, equity curve, and performance under different conditions.
Optimize parameters before applying the strategy to different markets.
Author & Access
Developed 100% by Quantura. Published as an Invite-Only script.
Important
This description complies with TradingView’s publishing rules. It clarifies originality, explains the underlying logic, discloses default properties, and presents backtest results with realistic disclaimers.

Quantura - Quantitative AlgorythmIntroduction
“Quantura – Quantitative Algorithm” is an invite-only Pine Script strategy designed for multi-timeframe analysis, combining technical filters with user-adjustable fundamental sentiment. It was primarily developed for cryptocurrency markets but can also be applied across other assets such as Forex, stocks, and indices. The goal is to generate structured trade signals through a confluence of techniques rather than relying on a single indicator.
Originality & Value
Quantura is not a simple mashup of indicators. Its originality comes from how multiple layers of analysis are integrated into a single decision framework . Instead of showing indicators separately, the strategy only issues trades when several conditions align simultaneously:
RSI entry triggers confirm overbought/oversold reversals.
Market structure on a higher timeframe confirms trend direction.
Order block detection highlights zones of concentrated supply and demand.
Premium/Discount zones identify potential over- and undervaluation.
HTF EMA provides trend confirmation.
Optional candlestick patterns strengthen reversal or continuation signals.
An optional correlation filter compares the main asset to a reference instrument.
This design forces agreement between different methodologies (momentum, structure, value, volume, sentiment), which reduces noise compared to using them in isolation.
Functionality & Indicators
Entry trigger: RSI exits from extreme zones.
Filters: Only valid when all selected filters (HTF structure, EMA, order blocks, premium/discount, candlesticks, correlation, volume) confirm the direction.
Fundamental bias: User-defined sentiment and analysis settings (bullish, bearish, neutral) influence whether long or short trades are permitted.
Exits: ATR-based take profit and stop loss, with optional breakeven, opposite-signal exit, and session-end exit.
Visualization: Buy/Sell markers, trend-colored candles, and an optional dashboard summarizing indicator status.
Parameters & Customization
Timeframes: Independent HTF and LTF selection.
Trading direction: Long / Short / Both.
Session and weekday filters.
RSI length and thresholds.
Filters: HTF structure, order blocks, premium/discount, EMA, candlestick, ATR volatility, volume zones, correlation.
Exit rules: ATR multipliers for TP/SL, breakeven logic, session-end exit, opposite-signal exit.
Visuals: Toggle signals, candles, dashboard, custom colors.
Default Properties (Strategy Settings)
Initial Capital: 100,000 USD
Position Size: 15% of equity per trade
Commission: 0.25%
Slippage: enabled
Pyramiding: 0 (one position at a time)
Note: The position sizing of 15% equity per trade is intentionally set for backtesting demonstration. In real trading, risking this much is considered aggressive. Most traders prefer to risk 1-5% of equity, and rarely above 10%.
Backtesting & Performance
Backtests on BTCUSD (2 years) with the above defaults showed:
112 trades
Win rate: 40%
Profit factor: 1.4
Maximum drawdown: 34%
These results illustrate how the confluence model behaves, but they are not predictive of future performance . The trade sample size (72 trades) is below the 100+ usually recommended for statistical robustness. Users should re-test with their own preferred symbols, settings, and timeframes.
Risk Management
ATR-based stops and targets scale with volatility.
Commission and slippage are included by default for realistic modeling.
Opposite-signal exit helps capture trend reversals.
Session-end exit can close intraday positions before illiquid hours.
Breakeven option protects profits when available.
Although the default allocation uses 15% per trade for demonstration, this is not a recommendation. Users are encouraged to adjust risk sizing downwards to sustainable levels (commonly 1-5%).
Limitations & Market Conditions
Performs best in volatile, liquid markets (e.g., crypto).
May struggle in prolonged sideways markets with low volatility.
News events and fundamentals outside user inputs can override signals.
Backtests below 100 trades should be considered exploratory, not statistically conclusive.
Usage Guide
Add “Quantura – Quantitative Algorithm” to your chart in strategy mode.
Select HTF and LTF timeframes, trading direction, and session filters.
Configure confluence filters (structure, EMA, order blocks, premium/discount, candlestick, correlation, volume).
Set sentiment and analysis bias in fundamental settings.
Adjust ATR multipliers and exits.
Review buy/sell signals and analyze performance in the Strategy Tester.
Author & Access
Developed 100% by Quantura . Distributed as an Invite-Only script . Details are provided in the Author’s Instructions field.
Important: This description complies with TradingView’s Script Publishing Rules and House Rules. It does not guarantee profitability, avoids unrealistic claims, and explains how the strategy integrates multiple methods into a coherent decision framework.

SMC Adaptive Breakout v1XSMC Adaptive Breakout v1X — Adaptive Smart Money Breakout Strategy
SMC Adaptive Breakout v1X is a Smart-Money–inspired breakout strategy that adapts to changing volatility and market structure in real time. It identifies recent pivot structure, verifies volatility expansion, uses ATR-scaled stops, and manages exits with fixed profit targets plus price-based trailing.
Why this strategy is unique / original
This strategy combines three concept layers into a single, cohesive system: (1) structure detection using adaptive pivots, (2) a normalized volatility filter (range percentile over a long lookback) to permit only expansion-phase breakouts, and (3) context-aware trade management using ATR-scaled stops and percentage-based profit/ trailing rules. The combination reduces false breakouts during low-volatility periods while preserving entries when institutional-style expansion occurs.
Core logic (high level)
1. Structure detection: recent pivot highs and lows (configurable lookback) form the active Support and Resistance reference levels used to define breakouts.
2. Volatility confirmation: raw bar range is normalized into a percentile within a long volatility lookback window; breakouts are only considered when normalized volatility exceeds the user filter threshold.
3. Order-block / gap detection: the script detects large price gaps relative to ATR(200) and flags them as bullish/bearish gaps (order-block style footprints) to add confluence to entries.
4. Entry criteria: a long entry is signalled when price closes above the most recent resistance and the volatility filter is satisfied (or a bullish gap condition is met). Shorts mirror this logic below support. Debug/force flags allow manual/backtest forcing of trades.
5. Risk & exits: stops are ATR-based (ATR length configurable, multiplier configurable) giving context-aware stop distances. Each entry sets a profit target as a percent of entry and attaches a trailing exit (points and offset defined as percent of price) to protect profits. Exits are placed with one strategy.exit per entry so they are executed by the strategy engine.
6. Non-premature confirmation: entries are determined using closed-bar conditions (no intrabar triggers), consistent with strategy backtesting expectations.
Key inputs (and what they control)
1. Levels Period (length) — pivot lookback used to compute support/resistance structure; larger values = larger, fewer zones.
2. Volatility Filter (filter 0–100) — normalized volatility threshold (percentile) required to allow breakout signals. Increase to reduce signals during quiet markets.
3. Volatility lookback (volatility_len) — window length used to normalize the raw range into a percentile.
4. ATR length (atr_len) & ATR Stop Multiplier (atr_multiplier) — ATR parameters used for stop distance; ATR gives volatility-adaptive stop sizing.
5. Profit target (%) — target as percent of entry price.
6. Trailing points (%) & offset (%) — trailing stop size and activation offset, expressed as percent of price (converted internally to price points).
7. Visual & debug toggles — show/hide levels, entry markers, and enable debug/force entry flags for manual/backtest validation.
Practical Usage & Recommended Settings
Timeframes – Works efficiently across multiple time horizons.
• 5–15 minutes → Scalping setups.
• 15 minutes–1 hour → Intraday opportunities.
• 4 hours–1 day → Swing trading confirmation.
Adjust length and Volatility Filter parameters to match your timeframe and instrument behavior.
Default Sensitivity –
The default length = 20 offers balanced structure detection.
• Lower values → faster, more frequent signals.
• Higher values → smoother structure and fewer breakouts.
Volatility Tuning –
Modify the Volatility Filter (0–100) according to market conditions.
• Increase the filter during low-volume or choppy sessions to reduce false signals.
• Decrease it during trending or high-volatility markets for greater responsiveness.
Stop / Target Sizing –
ATR-based stop-losses automatically adapt to market volatility.
• Recommended starting point: ATR Multiplier = 1.5 and Profit Target = 1.5%.
• Fine-tune both based on each asset’s typical volatility profile.
Backtesting –
Use TradingView’s built-in Strategy Tester to analyze results over different symbols and timeframes.
The strategy executes only on bar close, ensuring accurate, non-repainting backtest results.
What the strategy plots / visual cues
•Forward-extended pivot lines for support/resistance (configurable color/transparency).
•Order-block / gap markers when large ATR-scaled gaps are detected.
•Entry labels (“LONG” / “SHORT”) at position changes if enabled.
•Strategy entries/exits are placed through strategy.entry and strategy.exit so performance reports are available in the Tester.
Risk management & notes
•This script is a discretionary tool — it automates entries and exits for backtesting and strategy simulation, but users should still confirm trades with broader market context and higher-timeframe bias.
•Always run thorough backtests (multi-symbol, multi-timeframe) and forward test on a paper account before any live deployment.
•Adjust position sizing externally; the strategy code sets orders and exits but does not enforce a specific money-management sizing rule. Use the strategy tester’s default position size controls or integrate a sizing method in your own workflow.
Technical details & behavior
•Pine Script v6 strategy.
•Uses closed-bar confirmation for signals (no repainting on close).
•Order-block / gap detection uses ATR(200) as a volatility reference to identify large structural gaps.
•Trail calculations convert percent-based inputs to absolute price units each bar to maintain consistent behavior across price levels.
Limitations & disclaimers
•Past performance is not indicative of future results. This strategy does not guarantee profits and will produce losing trades.
•Results depend on parameter choices, instrument volatility, market regime, and execution slippage. Always test on the exact symbol and timeframe you intend to trade.
Invite-only / Access note (for Publish window)
This strategy is invite-only. Please use the TradingView Request Access button on this page to request access.

Volumemetrix Variance StrategyThe “Volumemetrix Variance Strategy” is an advanced Pine Script strategy designed to identify trade entries and exits using a combination of volume profile analysis, candle structure, and volatility filters. It constructs a dynamic volume profile over a specified lookback period to identify critical price levels such as the Point of Control (PoC), Value Area High (VAH), and Value Area Low (VAL). These levels represent zones of high trading activity that often act as support and resistance. The script smooths and adjusts these levels across different timeframes to align short-term market structure with higher-timeframe trends. It incorporates a variety of filters to exclude doji candles, detect continuation or rejection patterns, and confirm alignment with higher timeframe candle direction (e.g., 4-hour bullish or bearish bias).
Trade logic is built around detecting crossovers and breakouts relative to the PoC and value areas. The system can trigger entries based on several configurable behaviors: breakout, retake, bounce, reversal, or rejection near key volume zones. It supports flexible entry conditions for long, short, or both sides of the market, as well as a range of customizable settings for time-based trading restrictions, end-of-day position closures, and alert-based data capture. For execution, the script includes integrated risk management—users can specify take-profit and stop-loss levels, enable moving (trailing) stops, and even apply a “power curve” model to dynamically adjust trailing stops using exponential decay logic that adapts to price progress.
Overall, the Volumemetrix Variance Strategy is a hybrid between a quantitative volume-based strategy and a volatility-adaptive trade manager. It combines fixed range volume profiling with multi-timeframe confirmation, candle pattern validation, and adaptive exit logic. Its architecture allows for detailed trade automation, alert generation for external systems, and real-time control over parameters such as ATR scaling, entry delay, or bar confirmation. The result is a high-granularity framework for both backtesting and live execution that seeks to capture statistically favorable setups around liquidity concentration zones.

CDC BACKTEST (MACD) FIX AMOUNT $200k per trade This strategy implements an Exponential Moving Average (EMA) Crossover System designed for backtesting and performance evaluation. EMA 12,26 (MACD)
The trading logic is based on the crossover between two EMAs — a short-term EMA (12) and a long-term EMA (26) — which serves as a momentum-based signal for trend identification.
Buy Condition:
A long (buy) position is entered when the 12-period EMA crosses above the 26-period EMA, indicating a potential upward trend or bullish momentum.
Sell Condition:
A position is closed, or a short (sell) position is opened, when the 12-period EMA crosses below the 26-period EMA, signaling a potential downward trend or bearish momentum.
Position Sizing:
Each trade with a fixed position size of 200,000 USD (default), while the starting account balance is set at 400,000 (USD).
Both the fixed trade amount and the initial balance are user-adjustable parameters, allowing flexibility for different risk preferences and portfolio sizes.
