Separated ATR - evoThis script plots two ATR (Average True Range) values, one based on only bullish and the other based on only bearish bars. If the current bar is positive, the negative ATR will use its last known negative bar for the calculation. You can smooth bar directions by using the Heikin Ashi setting.
Use this the same way how you would use the regular ATR indicator, but with the added value of knowing which side of the market has more volatility.
Buscar en scripts para "bear"


TMMS OscillatorThe TMMS oscillator (aka “Trading Made More Simpler”) is an indicator made of conditions based on both 2 separated Stochastic and 1 RSI.
Bullish zone is green and bearish one is red. When the histogram is grey, no signals is available at that time.
The indicator has an option to show the current trend of an Hull moving average (ascending or descending curve). When the trend is up, green dots are plotted on the zero line. When the trend is down, the dots are coloured in red.
Greetings, success with your trade!!!

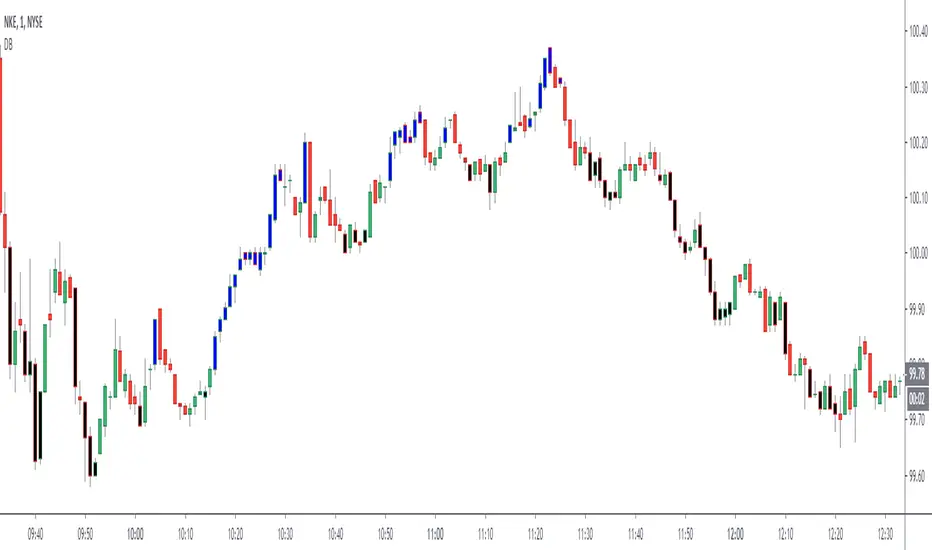
Dreadblitz BarsThese bars can give you good opportunities if you know how to analyze the context.
blue=bullish
black=bearish
thumbs up
Market Thrust IndicatorThe Market Thrust indicator is a powerful measure of the stock market's internal strength or weakness. There are four components to this indicator:
1-Advancing Issues on the New York Stock Exchange (NYSE) – $ADV
2-Advancing Volume on the NYSE – $UVOL
3-Declining Issues on the NYSE – $DECL
4-Declining Volume on the NYSE – $DVOL
The formula for Market Thrust is given below:
($ADV x $UVOL)-($DECL x $DVOL)
When used for day-trading, the trend of the Market Thrust indicator is what is most important.
Rising Market Thrust Indicator: Considered a bullish sign; can act as a confirmation signal when combined with a rising stock, index ETF, or stock index future's price.
Falling Market Thrust Indicator: Considered a bearish sign; can act as a confirmation signal of a decreasing market price.
The Market Thrust indicator could be used for detecting divergences in trends. Divergences occur when:
- Price is trending higher, but the Market Thrust indicator is not moving higher or is even going down.
- Price is trending lower, however, the Market Thrust technical analysis tool is not trending lower, it is either not trending or is trending higher.
Add a fully configurable trend line over MTI.
Read more at: commodity.com

Engulfing Scanner v1This indicator helps you to quickly identify bullish and bearish engulfing patterns.
Works on currencies only (pips required).

Differential Price Counter for Bullish/Bearish BarsThis script can show the cumulative differential price of both bullish/bearish bars with the 0.1pip precision for the currencies having five decimal precision. However, can be useful for all markets.

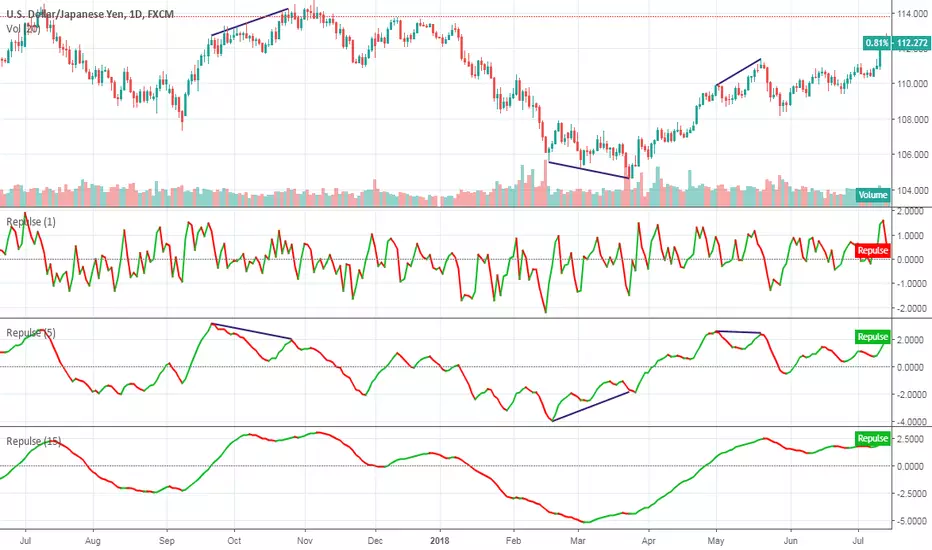
RepulseThis indicator was originally developed by Eric Lefort, a professional trader and author from France.
It gauges and displays the bullish or bearish pressure.
Like and follow for more open source indicators!
Happy Trading!
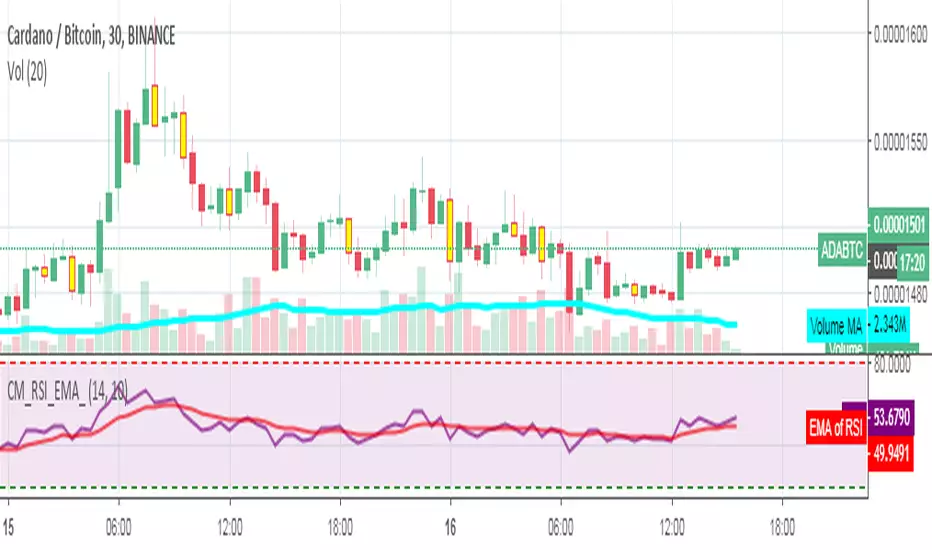
RSI_EMA & Bearish EngulfingThis is a RSI-RSI of EMA and bearish candlestick reversal pattern formed by two candlesticks. Following an uptrend, the first candlestick is a up candlestick which is followed by a down candlestick which has a long real body that engulfs or contains the real body of the prior bar. following an uptrend, if RSI and EMA line cross then Sell and for downtrend if RSI and EMA line cross then Buy.
CMYK VRMI◊ Introduction
This script indicates the relative movement of price x volume.
◊ Origin
Based on 'The Relative Momentum Index' by Roger Altman : February, 1993 issue of Technical Analysis of Stocks & Commodities magazine.
While RSI counts up and down days from close to close, the Relative Momentum Index counts up and down days from the close relative to a close x number of days ago.
This results in an RSI that is smoother. The input has been changed to the change of a smoothed close multiplied by a smoothed volume.
The polarity of VRMI indicates bearish/bullish movement.
◊ Adjustments
CMYK color theme applied.
◊ Usage
VRMI indicates the force the market moves with.
◊ Future Prospects
-
◊ ◊ ◊ ◊ ◊ ◊ ◊ ◊ ◊ ◊ ◊ ◊ ◊ ◊ ◊ ◊ ◊ ◊ ◊ ◊ ◊ ◊ ◊ ◊ ◊ ◊ ◊ ◊ ◊ ◊ ◊ ◊ ◊ ◊ ◊ ◊ ◊ ◊ ◊ ◊ ◊ ◊ ◊ ◊ ◊ ◊ ◊ ◊ ◊ ◊ ◊ ◊ ◊ ◊ ◊ ◊ ◊ ◊ ◊ ◊ ◊ ◊ ◊ ◊ ◊ ◊ ◊ ◊ ◊ ◊ ◊ ◊ ◊ ◊ ◊ ◊ ◊ ◊ ◊ ◊ ◊ ◊ ◊ ◊ ◊ ◊ ◊ ◊ ◊ ◊ ◊ ◊ ◊ ◊ ◊ ◊ ◊ ◊ ◊ ◊ ◊ ◊ ◊ ◊ ◊ ◊

CMYK VRMI RAYS ◊ Introduction
Introducing VRMI in this script, an RMI based on price movement and volume, to indicate bullish and bearish trends.
This script marks the background depending on RMI <> VRMI , VRMI polarity and large buy/sell sprees.
◊ Origin
Based on 'The Relative Momentum Index' by Roger Altman : February, 1993 issue of Technical Analysis of Stocks & Commodities magazine.
While RSI counts up and down days from close to close, the Relative Momentum Index counts up and down days from the close relative to a close x number of days ago.
This results in an RSI that is smoother.
In addition VRMI reacts quick, it is used to cut off latency from RMI, and it's polarity indicates the beginning and end of a trend.
Large buy sell sprees and detected in their proportion with an sma on the volume
◊ Adjustments
CMYK color theme applied.
◊ Usage
This indicator can be used to detect trends and mark reversals.
◊ Prospects
◊ ◊ ◊ ◊ ◊ ◊ ◊ ◊ ◊ ◊ ◊ ◊ ◊ ◊ ◊ ◊ ◊ ◊ ◊ ◊ ◊ ◊ ◊ ◊ ◊ ◊ ◊ ◊ ◊ ◊ ◊ ◊ ◊ ◊ ◊ ◊ ◊ ◊ ◊ ◊ ◊ ◊ ◊ ◊ ◊ ◊ ◊ ◊ ◊ ◊ ◊ ◊ ◊ ◊ ◊ ◊ ◊ ◊ ◊ ◊ ◊ ◊ ◊ ◊ ◊ ◊ ◊ ◊ ◊ ◊ ◊ ◊ ◊ ◊ ◊ ◊ ◊ ◊ ◊ ◊ ◊ ◊ ◊ ◊ ◊ ◊ ◊ ◊ ◊ ◊ ◊ ◊ ◊ ◊ ◊ ◊ ◊ ◊ ◊ ◊ ◊ ◊ ◊ ◊ ◊ ◊


Super Envolvente (Bullish y Bearish)Identificador de Super-envolventes (SE), se encarga de darle un color verde a la SE alzista (Bullish) verde y rojo a la bajista (Bearish).

Bearish Trailing stopIt is a trailing SL. Works very well. Good good very good. Looks like my description needs more, so here is more random text.


Bearish signal using Point of Control (POC) with PAC by guruThis indicator code helps traders identify potential sell opportunities using several important technical indicators:
Point of Control (POC) – This is the price level where the most volume was traded over the past several days.
Previous Day's Low – This shows the lowest price reached during the previous day.
PAC (Price Action Channel) EMA – These are two moving averages (one based on the low price and one based on the close price) that help determine if the price is trending within a certain range.
Volume SMA – This is a 3-day simple moving average (SMA) of volume, which helps filter out signals based on market activity.
What the Script Does:
Point of Control (POC):
The script looks at the last 50 days (configurable) and calculates which price level had the highest trading volume.
It then plots a red line on the chart at the POC level. This is important because it helps identify areas where there was strong market interest in the past.
Volume Moving Average:
The script calculates a 3-day SMA of volume, but it excludes the current day to avoid premature signals based on today’s trading.
The volume SMA is used to ensure there’s enough market activity (with a threshold set to 25 units) before triggering a sell signal.
Price Action Channel (PAC) EMA:
The PAC consists of two exponential moving averages (EMAs):
The PAC Low EMA: This is based on the low prices over the last 34 periods (configurable).
The PAC Close EMA: This is based on the closing prices over the last 34 periods.
These EMAs help determine if the price is trending above or below certain price levels.
Sell Signal Logic: The script checks three conditions before displaying a "Sell" signal:
Price Below POC and Previous Day’s Low:
The close price must be below both the Point of Control (POC) and the previous day's low.
Volume SMA Above 25:
The 3-day volume SMA must be greater than 25. This ensures the signal only triggers when there’s enough trading volume in the market.
Today’s Low is Above PAC EMAs:
Today's low price must be above both the PAC low EMA and the PAC close EMA. This prevents sell signals when prices are already significantly below the PAC, indicating possible exhaustion in the downtrend.
If all three conditions are met, the script will display a red "Sell" label on the chart, signaling a potential selling opportunity.
No Sell Signal if Price Reverses:
If the price crosses back above the POC or the previous day's low, the script will remove the sell signal and reset for a new opportunity.
Summary of Conditions:
For the script to display a "Sell" label:
The close price must be below the Point of Control (POC) and the previous day’s low.
The 3-day volume SMA (excluding today) must be greater than 25 units.
The low price of the current day must be above both the PAC low EMA and the PAC close EMA.
If these conditions are met, a red sell label appears on the chart as a potential signal for a short (sell) trade.

[CT] Displacement FVG Toolkit Displacement FVG Toolkit is a complete ICT market-structure and execution toolkit designed to help you identify when price is truly repricing, where that repricing left inefficiencies, and how to frame trades with clear context, confirmation, and invalidation. The indicator brings together six institutional-grade concepts into one workflow, Displacement, Fair Value Gaps, Reload Zones, Dealing Range premium and discount, CISD, and Market Structure breaks, so you can stop reacting to random candles and start trading the sequence that professional order flow tends to follow, impulse, imbalance, retrace, and continuation or reversal.
The Displacement tool is the engine that decides whether a candle represents meaningful participation or ordinary noise. Displacement is measured by comparing the current candle’s size to the average candle size over a user-defined lookback. You can choose whether the script uses the candle body size or the full high-to-low range for this calculation. When the candle exceeds the average by your selected displacement factor, it is flagged as displacement. Displacement is important because it is the clearest visible clue that the market has moved from balanced auction to aggressive repricing, which is the environment where inefficiencies form and where your best retest trades are born. In the photo, the yellow bars represent the displacement bars, and the indicator prints Buy and Sell markers on those displacement events. The user also has full control to color displacement bars to a color of their choice, so whether you prefer bright yellow, muted gray, or any custom brand color, you can set the exact bullish and bearish displacement bar colors in the inputs. If you do not want bar coloring at all, you can simply turn off displacement bar coloring and use only the markers.
The Structure Filter is a powerful addition that prevents displacement from becoming “any big candle.” When enabled, the indicator requires the displacement candle to also break recent structure, meaning price must break above a recent high for bullish displacement or below a recent low for bearish displacement. You can decide whether the structure break is judged by a candle close beyond the prior structure level or by a wick that pierces it. Close-based structure breaks are cleaner and generally reduce false positives, while wick-based breaks are more sensitive and can trigger earlier at the cost of more noise. This filter matters because a large candle in the middle of chop is not the same as a large candle that actually breaks a meaningful swing point, and the indicator gives you a way to enforce that distinction mechanically.
The Fair Value Gap tool identifies the most valuable type of imbalance, the three-candle FVG, but it only plots those gaps when they are created by validated displacement. A bullish FVG forms when the current candle’s low is above the high from two candles ago, showing that price skipped a region without fully transacting through it. A bearish FVG forms when the current candle’s high is below the low from two candles ago. These gaps represent unfinished auction, a fast repricing that often leaves behind an inefficiency the market may later revisit to rebalance. You can choose to extend FVGs to the right for a set number of bars so you can see the levels well into the future, or you can keep them confined to the period when they formed. You can also choose whether mitigated FVGs remain visible or are hidden. Mitigation in this script means price has traded back into the gap far enough to invalidate it as an active inefficiency, and when that happens you can either keep it on the chart as historical context or remove it to keep your chart clean. The script also manages object limits by keeping only a user-defined maximum number of FVGs, trimming older ones as needed so the indicator remains stable.
Reload Zones are derived directly from the FVGs and are built for execution. Instead of treating the entire gap as the same, the indicator highlights the portion of the imbalance that most often functions as the highest-quality retest area for continuation entries. For bullish FVGs, the Reload Zone is drawn as the upper portion of the gap, and for bearish FVGs it is drawn as the lower portion, which keeps your focus on the retest region that is closest to the direction of repricing and typically provides tighter invalidation. The indicator also includes an optional Invalidation line that marks the far edge of the full FVG, giving you a clean and consistent “line in the sand” for risk management. The intended use is straightforward, you wait for displacement to print and create an FVG, you allow price to retrace into the Reload Zone, and you look for rejection behavior that confirms responsive participation, such as wicks into the zone that close back out, sharp reaction candles, or structure holding in the direction of the displacement. When price accepts inside the zone with multiple closes and slow grind, that’s often a sign the inefficiency is being repaired rather than defended, and the reload entry loses quality. Because reload zones are tied to displacement-generated FVGs, they naturally filter out weaker imbalances and focus you on the kind created during true repricing.
The Dealing Range tool provides context by defining a rolling high-to-low range over a user-defined lookback, then splitting that range into premium and discount. The indicator plots DR High, DR Low, and a DR Mid 50% line, and can optionally show PD 62% and PD 38% reference levels inside the range. The fill visually highlights premium above the midpoint and discount below it, which helps you avoid the most common retail mistake, buying in premium and selling in discount without a strong reason. The dealing range is not meant to be a rigid “support and resistance box.” It is meant to help you frame location. In general, long ideas have better location when price is in discount or reclaiming the midpoint with momentum, and short ideas have better location when price is in premium or rejecting the midpoint from below. This becomes especially powerful when combined with your other tools, because a bullish displacement and FVG that forms in discount and then holds the reload zone tends to have much better continuation odds than the same pattern forming at the very top of premium into overhead liquidity.
CISD in this indicator is your liquidity-sweep and directional-shift engine, designed to answer a very specific question, did price just take liquidity and then flip orderflow enough to justify a new directional bias. The script first maps swing liquidity using pivot highs and pivot lows over your selected swing period, then tracks when those levels are wicked or mitigated within an expiry window. When a swing high or swing low is taken, the CISD logic watches for the characteristic shift pattern that follows, and when it qualifies it prints a CISD level and establishes a trend state. The “Noise Filter” setting controls how strict the CISD trigger is, higher values reduce noise and produce fewer but more meaningful CISDs, while lower values produce more signals but may include weaker shifts. The indicator also distinguishes between a normal CISD and a stronger CISD that occurs after opposing liquidity was recently wicked within your liquidity lookback, and those stronger events are marked with the directional ▲/▼ symbols so you can immediately recognize when a sweep-and-shift sequence likely occurred instead of a random flip.
A key feature you asked for, and that this indicator includes, is that CISD levels can extend in a very controlled way so you can keep trading them without guessing where the level “ends.” The current timeframe CISD lines are drawn at the origin level and then the script can extend only the most recent X CISD lines out past the current bar by a user-defined number of bars, without creating gaps or redrawing incorrectly. This means your newest CISD levels remain visually “live” and tradable into the immediate future, while older CISDs automatically restore to their original endpoints and behave normally. This is important for execution because it keeps the focus on the levels that are most likely to matter now, while still preserving history without clutter.
The MTF CISD add-on is what gives you institutional alignment, because it allows a higher timeframe CISD to print onto your execution timeframe. The script computes CISD on the selected HTF using request.security and then draws HTF CISD lines on your chart in real time. You can choose “Confirmed HTF only,” which means the HTF CISD only prints when the higher timeframe candle closes, or you can turn confirmation off to see developing HTF CISDs while the HTF candle is still building. The HTF line style is configurable, and the HTF lines can extend to the right so they behave like real mapped levels. The HTF label is also supported and can be pinned to the right edge with an x-offset, so you always know which timeframe the CISD came from without having to guess. Optional HTF markers can print ▲/▼ on the bar where a new HTF CISD event is detected, which gives you a fast “regime shift” alert that pairs extremely well with your displacement and FVG tools.
CISD also includes a candle coloring option so you can visually trade the bias without constantly reading every label. You can keep candle coloring off, turn on an overlay candle layer using plot candle, or use bar color to recolor the native chart candles. The trend that drives candle color can be the current timeframe CISD trend or, if enabled, the HTF CISD trend so your execution timeframe candles reflect the higher timeframe shift. In the combined script, displacement bar coloring still has priority if you leave it enabled, meaning displacement bars will show your displacement color choice first, and the CISD candle coloring will apply where displacement is not overriding. That’s intentional, because displacement bars are “event bars,” while CISD coloring is “state,” and you want to see both without confusion.
In terms of how to use CISD with the rest of this indicator, the cleanest institutional workflow is to treat CISD as the directional context and trigger, and use displacement, FVG, and Reload Zones as the execution framework. A fresh HTF CISD is your “macro shift” that tells you which side is likely building control, then you wait for displacement on your execution timeframe that agrees with that bias and produces an FVG. The Reload Zone becomes your location for entry on the retrace, BOS/CHOCH tells you if structure is truly transitioning or continuing, and your invalidation stays anchored to the far edge of the FVG or the CISD level depending on which is tighter and more structurally meaningful. When CISD and displacement disagree, that’s usually a “stand down or reduce size” condition unless you’re explicitly trading a reversal, because it often means the market is still in rotation or repairing imbalance rather than trending cleanly.
The BOS and CHOCH tool is the structure confirmation layer. The indicator finds swing highs and swing lows using a pivot-based swing length and then plots structure lines at those pivots. Breaks are detected either by close or by wick, based on your setting. BOS, Break of Structure, signals continuation in the current structural regime, while CHOCH, Change of Character, signals a likely regime change. The indicator uses a simple internal state to differentiate BOS from CHOCH, so you can read structure shifts in real time rather than labeling everything as a generic “break.” You can display structure as lines, labels, or both. The lines extend until price breaks them, then they stop at the break so you can visually see exactly where the market transitioned. This module is especially useful for keeping you out of the trap of assuming a pullback is a reversal. If you see displacement and FVGs but no structural confirmation, you can reduce size or wait. If you see a CHOCH that aligns with a displacement shift and then price returns to a reload zone, you have a much higher quality reversal framework.
When you put these tools together, the intended trading workflow becomes a complete narrative. First you identify meaningful movement through displacement, and if you use the structure filter you ensure it is not just a large candle but a break in the auction. That displacement then creates an FVG, the inefficiency left behind by repricing. The Reload Zone marks the most tradable retest area of that inefficiency, and the invalidation line gives you a clear risk boundary. The Dealing Range tells you whether you are taking that setup from a favorable location, discount for longs or premium for shorts. BOS and CHOCH provide the final confirmation layer that tells you whether you are trading continuation or a genuine structural shift. This structure keeps you from chasing breakouts, because it naturally trains you to wait for the pullback into the reload zone and to only participate when price proves acceptance and rejection behavior at the level.
This indicator is built to be flexible. You can run it as a clean displacement plus imbalance tool by focusing on displacement, FVGs, and reload zones, or you can turn it into a full context-and-confirmation system by adding dealing range and BOS/CHOCH. If you want a high-signal, low-noise chart, keep the structure break requirement on, use close-based breaks, limit the number of active gaps, and hide mitigated gaps. If you want more sensitivity and earlier signals, use wick-based breaks and allow more gaps to remain visible. The goal is always the same, to help you see when the market is actually repricing, to mark the price areas where that repricing left unfinished business, and to give you a consistent way to execute retests with defined risk and clear structural context.

Bernoulli Process: Trend Probability & Entropy [MarkitTick]💡 This technical indicator introduces a rigorous probabilistic framework to the evaluation of market regimes by modeling price fluctuations as a Bernoulli Process. Unlike traditional oscillators that merely measure the magnitude of price movement, this script treats every bar as a discrete "trial" that either succeeds or fails based on specific conditions—such as directional price action, momentum thresholds, or trend alignment. By applying Information Theory and the principles of Maximum Likelihood Estimation (MLE), the script quantifies not just the direction of the market, but the statistical reliability and the "noise" content of the current sequence. This allows traders to distinguish between a structured trend and high-entropy market "chop," providing a level of objective clarity often missing in standard technical analysis.
● ✨ Originality and Utility
The primary innovation of this script lies in its transition from deterministic price tracking to stochastic regime modeling. Most indicators suffer from the "binary trap," where they simply tell a trader if price is above or below a level without assessing the statistical significance of that state.
• Quantifying Market Information
By integrating Shannon’s Binary Entropy, the script measures the uncertainty inherent in a price sequence. When entropy is near 1.0, the market is in a state of maximum uncertainty (effectively a fair coin toss), signaling that a trader should likely avoid the "noise." Conversely, low entropy values indicate a high-information state where one side of the Bernoulli trial is dominating, suggesting a persistent trend.
• Adaptive Definition of Success
The script is not limited to a single logic; it allows the user to define what constitutes a "Success" in the Bernoulli trial. Whether you prioritize raw price action (Close > Open), momentum (RSI > 50), or trend-following (Price > Moving Average), the underlying probabilistic engine remains consistent, making it a versatile tool for various trading styles.
• Z-Score Significance Testing
It applies a Central Limit Theorem (CLT) approximation to calculate a Z-Score. This tells the trader how many standard deviations the current trend is away from a random walk (p=0.5). This provides a mathematical filter to avoid entering "trends" that are actually within the bounds of statistical randomness.
● 🔬 Methodology and Concepts
The script operates through a four-stage mathematical pipeline that converts raw market data into probabilistic metrics.
• Stage 1: The Bernoulli Trial (I)
The foundation is the indicator variable (I). On every bar, the script evaluates a boolean condition. If the condition is met, the trial is a "Success" (1.0); otherwise, it is a "Failure" (0.0). This transforms complex candles into a simple binary sequence: {1, 0, 1, 1, 0...}.
• Stage 2: Probability Estimation (p-hat)
Using a rolling window of length N, the script calculates the Maximum Likelihood Estimate (MLE) of the probability parameter 'p'. This is essentially the sample mean of the successes within the window. A value of 0.7 suggests that in the last N trials, 70% were successful.
• Stage 3: Binary Entropy Calculation
The script calculates Entropy H(p) using the formula:
H(p) = -p * log2(p) - (1-p) * log2(1-p)
This provides a metric for "Trend Quality." If p is 0.5 (random), H(p) is 1.0 (maximum noise). If p is 1.0 or 0.0 (perfect trend), H(p) is 0.0 (maximum order).
• Stage 4: Volatility-Adjusted Z-Score
To determine if a sequence is truly anomalous, the script calculates the standard deviation of a fair process and compares the observed deviations to this baseline. This identifies "Significant Trends" that are mathematically distinct from a 50/50 random distribution.
● 🎨 Visual Guide
The visual interface is designed to communicate complex statistical data through intuitive color-coded cues.
• The Bernoulli Probability Line
The main plot is a continuous line representing the estimated probability (p).
A value above 0.5 indicates a bullish bias (p-hat > 0.5).
A value below 0.5 indicates a bearish bias (p-hat < 0.5).
• Dynamic Entropy Coloring
The line does not just change color based on direction; it changes based on certainty.
Vibrant Green: Strong bullish trend with low entropy (High Certainty).
Vibrant Red: Strong bearish trend with low entropy (High Certainty).
Gray/Faded Color: High entropy regime (Entropy > 0.9). This signals that the market is "choppy" and the probability of success is too close to random to be reliable.
• Background Entropy Zones
The chart background highlights areas of "Max Entropy" in a subtle gray color. When you see these zones, it suggests the current Bernoulli definition is failing to find a directional edge, signaling a period of market consolidation.
• Real-Time Metrics Dashboard
A table in the top-right corner displays:
Probability (p): The exact decimal value of the current trend probability.
Entropy (Bits): The current level of uncertainty in the sequence.
Regime: A text-based label identifying the market state (Bull Trend, Bear Trend, or Noise/Chop).
• Execution Signals
Small triangles appear on the chart to mark high-probability transition points. A Triangle Up (Green) marks a bullish breakout from a low-entropy state, while a Triangle Down (Red) marks a bearish breakdown.
● 📖 How to Use
• Identifying Low-Noise Entries
Traders should look for instances where the Probability Line crosses the 0.5 threshold while Entropy is low (vibrant colors). If the line is gray, the "trend" lacks statistical significance, and the risk of a whip-saw is high.
• Regime Filtering
Use the indicator as a "Mode Filter." If the Dashboard displays "NOISE / CHOP," it is a signal to stay flat or use mean-reversion strategies. If it displays a "TREND" regime, trend-following strategies can be deployed with higher confidence.
• Interpreting the Z-Score
While not directly plotted, the Z-Score logic powers the signal generation. A signal is only produced when the deviation from the "Fair Coin" (0.5) is substantial enough to suggest a non-random event.
● ⚙️ Inputs and Settings
• Bernoulli Trial Definition
Choose between three calculation modes:
Price Action: Uses the relationship between Close and Open (Directional bars).
Momentum: Uses RSI relative to the 50-level (Standard momentum).
Trend: Uses Price relative to a Simple Moving Average (Long-term regime).
• Sample Window (N)
Determines the "lookback" for the probability calculation. Smaller values (e.g., 10-15) are more responsive but noisier; larger values (e.g., 30-50) provide a smoother, more institutional view of the regime.
• Risk Management (Alerts)
Target R:R Ratio: Used to calculate the Take Profit level in the JSON alerts.
Stop ATR Multiplier: Uses Average True Range to calculate a volatility-adjusted stop loss for signals.
● 🔍 Deconstruction of the Underlying Scientific and Academic Framework
The "Bernoulli Process: Trend Probability & Entropy" script is built upon the pillars of Discrete Stochastic Processes and Information Theory.
• The Law of Large Numbers (LLN)
The script relies on the LLN, which states that as a sample size grows, its mean gets closer to the average of the whole population. By using a "Sample Window," we are performing a rolling MLE of the true underlying probability parameter of the market at that moment.
• Shannon Entropy and Information Theory
Claude Shannon’s 1948 work on information entropy is the bedrock of the "Noise" detection in this script. In the context of trading, entropy represents the "surprise" or "uncertainty" in the price sequence. A low-entropy market is one where the next bar's success/failure is highly predictable based on the recent past, which is the mathematical definition of a trend.
• Bernoulli vs. Gaussian Distributions
Most indicators assume a Normal (Gaussian) distribution of price returns. However, market states are often better modeled as discrete outcomes (Up/Down). By treating the market as a Bernoulli Process, we bypass the "fat-tail" problem of Gaussian distributions and focus purely on the frequency of successful outcomes, making the tool more robust against outliers.
• The Z-Test for Proportions
By applying a Z-score calculation to a Bernoulli distribution, the script treats the market like a "biased coin" experiment. It tests the Null Hypothesis ($H_0$): "The market is a fair coin (p=0.5)." When the Z-score is high, we reject $H_0$ in favor of the Alternative Hypothesis ($H_1$): "The market is trending (p != 0.5)."
⚠️ Disclaimer
All provided scripts and indicators are strictly for educational exploration and must not be interpreted as financial advice or a recommendation to execute trades. I expressly disclaim all liability for any financial losses or damages that may result, directly or indirectly, from the reliance on or application of these tools. Market participation carries inherent risk where past performance never guarantees future returns, leaving all investment decisions and due diligence solely at your own discretion.

Mossan's Farming System [Taolue Remix]Mossan's Farming System
**【概要】**
このインジケーターは、「物理的なコスト(**WTI原油価格**)」と「金融的なコスト(**米10年債利回り**)」という2つのマクロ指標を監視し、現在の市場が**「農耕(トレンドフォロー)」**に適しているか、**「嵐(高ボラティリティ・警戒)」**の状態にあるかを背景色で可視化します。
さらに、環境認識に基づいたRSIの押し目買い・戻り売りシグナルと、ダイバージャンス検知機能を提供します。
**【コンセプト:狩猟から農耕へ】**
* **🌱 農耕モード (背景:緑)**
* 原油価格と米金利が共に移動平均を**下回っている**状態。
* 実体経済へのコスト負担が軽く、流動性が確保されています。
* **戦略:** 押し目買い(**Plant**)推奨。トレンドが育ちやすい土壌です。
* **⚠️ 嵐/警戒モード (背景:赤)**
* 原油価格と米金利が共に移動平均を**上回っている**状態。
* インフレ懸念と金融引き締めが同時に起きている「カオス」な状態です。
* **戦略:** キャッシュポジション推奨、または短期的な戻り売り(**Harvest**)。
* **☁️ 待機 (背景:グレー)**
* 方向感が定まらない状態。無理にトレードせず**「休む」**期間です。
**【機能とロジック】**
1. **マクロ環境認識:**
* **USOIL** (WTI原油) と **US10Y** (米10年債利回り) を取得し、指定した移動平均線(MA)と比較します。
* **マルチタイムフレーム対応:** 設定から「環境認識を行う時間足」を固定できます(例:15分足チャートを見ながら、**日足**の環境を表示)。
* **カスタムMA:** 環境判定に使うMAの種類を **SMA, EMA, HMA, WMA** 等から選択可能です。
2. **売買シグナル (Plant & Harvest):**
* **Plant (買い):** 環境が「緑」かつ、RSIが**売られすぎ**水準から復帰した時。
* **Harvest (売り):** 環境が「赤」かつ、RSIが**買われすぎ**水準から反落した時。
* 環境認識フィルターにより、マクロ環境に逆行する危険なシグナルを排除します。
3. **RSIダイバージャンス:**
* 強気(**Bull**)および弱気(**Bear**)のダイバージャンスを自動検知し、チャート上にラインを描画します。
**【設定】**
* **環境認識の時間足:** デフォルトはチャートと同じですが、「**D(日足)**」などに固定することを推奨します。
* **MAの種類/期間:** 反応速度を調整できます(デフォルト: SMA 20)。
* **RSI設定:** 期間や感度を調整可能です。
---
** **
This indicator visualizes the current market regime by monitoring two key macro factors: **Physical Cost (WTI Crude Oil)** and **Financial Cost (US 10Y Yield)**. It determines whether the market is in a **"Farming Mode" (Safe/Trend Following)** or a **"Storm Mode" (High Volatility/Risk-Off)** based on background colors.
It also provides RSI-based buy/sell signals filtered by this macro environment, along with divergence detection.
** **
* **🌱 Farming Mode (Green Background)**
* Both Oil and Yields are **below** their moving averages.
* Indicates lower operational costs for the economy and stable liquidity.
* **Strategy:** Look for dip buys (**Plant**). Trends are likely to grow steadily.
* **⚠️ Storm Mode (Red Background)**
* Both Oil and Yields are **above** their moving averages.
* Indicates inflation fears and monetary tightening. High risk.
* **Strategy:** Stay in cash or look for short-term selling opportunities (**Harvest**).
* **☁️ Wait (Gray Background)**
* Mixed signals. It is recommended to **wait** for a clearer direction.
** **
1. **Macro Environment Recognition:**
* Fetches data for **USOIL** and **US10Y** to compare against a user-defined Moving Average.
* **Multi-Timeframe Support:** You can fix the timeframe for environment detection (e.g., view **Daily** environment on a 15m chart).
* **Custom MA Types:** Choose from **SMA, EMA, HMA, WMA**, etc., for the trend detection logic.
2. **Trading Signals (Plant & Harvest):**
* **Plant (Buy):** Triggered when the environment is "Green" AND RSI crosses up from the **oversold** zone.
* **Harvest (Sell):** Triggered when the environment is "Red" AND RSI crosses down from the **overbought** zone.
* The environment filter helps filter out dangerous counter-trend signals.
3. **RSI Divergence:**
* Automatically detects and draws lines for **Bullish** and **Bearish** RSI divergences.
** **
* **Environment Timeframe:** Default is same as chart, but fixing it to higher timeframes (e.g., "**D**") is recommended for stability.
* **MA Type/Length:** Adjust the sensitivity of the trend detection (Default: SMA 20).
* **RSI Settings:** Customizable length and thresholds.
**Disclaimer:**
This script is for educational purposes only. Past performance does not guarantee future results. Please manage your risk carefully.

Decycler Momentum Regime Filter ~ CharonQuantThe Decycler Momentum Regime Filter is a trend-following and momentum confirmation indicator built on John Ehlers’ Decycler filtering methods, combined with the Price Momentum Oscillator (PMO) for regime validation.
The original Decycler concept uses high-pass filtering techniques to suppress cyclical noise and isolate the underlying directional structure of price.
This version extends that foundation into a unified trend regime system designed for real trading conditions, not constant flipping in chop.
What’s different in this implementation:
• Ehlers Decycler trend backbone to smooth price action and reduce noise
• Momentum confirmation using PMO
• Zero-line regime filter to avoid weak or transitional environments
• Directional state engine that clearly defines bullish, bearish, or neutral trend regimes
• Clean visual context using adaptive trend coloring, bar bias, and background shading
Trend regimes are only confirmed when all conditions align:
• Decycler slope confirms directional trend persistence
• PMO is aligned with its signal line (momentum continuation)
• PMO is above or below zero (trend-strength regime validation)
• The CharonQuant state updates only when trend + momentum agree
If one condition fails, the system remains neutral or holds its previous state.
This design prioritizes signal quality over signal frequency.
Visual interpretation:
• Gold (CharonQuant = +1) → Confirmed Bullish Trend Regime
• Wine (CharonQuant = –1) → Confirmed Bearish Trend Regime
• Gray (Neutral) → No strong trend / transition zone
This makes the indicator especially useful as a trend bias filter for systematic swing and position trading.
Development and calibration notes:
This indicator was developed and calibrated on the 1D CRYPTO:SOLUSD chart.
Default parameters are optimized for SOL’s volatility structure and daily trend behavior.
You must tweak the settings to fit your asset, timeframe, and trading style.
If you do not read this description or do not understand what the indicator is designed to do, do not use it.
Indicators amplify both discipline and mistakes.
Important reminder: No single indicator is sufficient on its own.
This tool is a trend regime filter, not a complete trading system.

Sniper Structure Signals (HH HL LH LL)Sniper Structure Signals is a professional market structure indicator designed to help traders read price action with clarity and consistency. It automatically identifies and labels Higher Highs, Higher Lows, Lower Highs, and Lower Lows using a configurable swing strength to reduce market noise and highlight meaningful structure.
The indicator defines directional bias based on confirmed market structure. A bullish bias is established after the formation of a Higher High followed by a Higher Low. A bearish bias is established after the formation of a Lower High followed by a Lower Low. This approach keeps the trader aligned with the dominant trend.
Trade signals are generated only after price confirms the active bias. Buy signals appear when price breaks above the most recent swing high during a bullish bias. Sell signals appear when price breaks below the most recent swing low during a bearish bias. The current bias is displayed on the chart, and built in alerts notify the trader when valid buy or sell conditions are met.

DeM Indicator
This script provides an implementation of the DеMаrker (DeM) Oscillator , a classic technical indicator developed by Thomas DеMаrk to identify trend exhaustion and market reversal points.
Unlike the Relative Strength Index (RSI), which primarily uses closing prices, the DеMаrker indicator focuses specifically on intra-period highs and lows to measure buying and selling pressure.
🚀 How It Works
The DеMаrker indicator compares the current period's price extremes to the previous period to isolate demand:
DeMax (Buying Pressure): Calculated when the current high is higher than the previous high.
DeMin (Selling Pressure): Calculated when the current low is lower than the previous low.
Smoothing: Both values are smoothed using a Simple Moving Average (SMA), typically over 14 periods.
The resulting value oscillates between 0 and 1.0 , providing a clear visual of price exhaustion.
💡 Trading Strategies
Overbought/Oversold Reversals:
- Bearish Signal: A reading above 0.70 suggests the market is overbought. Traders often look for the line to cross back below 0.70 to confirm a downward reversal.
- Bullish Signal: A reading below 0.30 suggests the market is oversold. A cross back above 0.30 can signal a potential upward reversal.
Trend Exhaustion: High DеMаrker values during an uptrend often precede a period of consolidation or "price exhaustion."
Divergence: Watch for cases where price makes a new high but the DeM indicator fails to reach a new peak, suggesting weakening momentum.
⚙️ Settings & Customization
DеMаrker Period: The default is set to 14. Shorten for more sensitivity; lengthen to filter out noise.
Visual Thresholds: Levels are set at 0.7 and 0.3. For volatile assets like Crypto, some traders prefer 0.8 and 0.2.
🛠️ Integration
The DеMаrker is most effective when combined with other tools such as Volume Profile, Moving Averages, etc.
Disclaimer: This script is for educational and analytical purposes only. Past performance does not guarantee future results. Always manage your risk according to your personal trading plan.
