Log Regression Channel [UAlgo]The "Log Regression Channel " channel is useful for analyzing price trends and volatility in a financial instrument over a specified period. By using logarithmic scaling, this indicator can more effectively handle the wide range of price movements seen in many financial markets, making it particularly valuable for assets with exponential growth characteristics.
The indicator plots the central regression line along with upper and lower deviation bands, providing a visual representation of potential support and resistance levels.
🔶 Key Features
Logarithmic Regression Line: The central line represents the logarithmic regression, which fits the price data over the specified length using a logarithmic scale. This helps in identifying the overall trend direction.
Deviation Bands: The upper and lower bands are plotted at a specified multiple of the standard deviation from the regression line, highlighting areas of potential overbought and oversold conditions.
Customizable Parameters: Users can adjust the length of the regression, the deviation multiplier, the color of the labels, and the size of the text labels to suit their preferences.
R-Squared Display: The R-squared value, which measures the goodness of fit of the regression model, is displayed on the chart. This helps traders assess the reliability of the regression line.
🔶 Calculations
The indicator performs several key calculations to plot the logarithmic regression channel:
Logarithmic Transformation: The prices and time indices are transformed using the natural logarithm to handle exponential growth in price data.
Regression Coefficients: The slope and intercept of the regression line are calculated using the least squares method on the transformed data.
Predicted Values: The regression equation is used to calculate predicted values for each data point.
Standard Deviation: The standard deviation of the residuals (differences between actual and predicted values) is computed to determine the width of the deviation bands.
Deviation Bands: Upper and lower bands are plotted at a specified multiple of the standard deviation above and below the regression line.
R-Squared Value: The R-squared value is calculated to measure how well the regression line fits the data. This value is displayed on the chart to inform the user of the model's reliability.
🔶 Disclaimer
The "Log Regression Channel " indicator is provided for educational and informational purposes only.
It is not intended as investment advice or a recommendation to buy or sell any financial instrument. Trading financial instruments involves substantial risk and may not be suitable for all investors.
Past performance is not indicative of future results. Users should conduct their own research.
Buscar en scripts para "bands"

Adaptive RSI | Lyro RSThe Adaptive RSI | 𝓛𝔂𝓻𝓸 𝓡𝓢 indicator enhances the traditional Relative Strength Index (RSI) by integrating adaptive smoothing techniques and dynamic bands. This design aims to provide traders with a nuanced view of market momentum, highlighting potential trend shifts and overbought or oversold conditions.
Key Features
Adaptive RSI Calculation: Combines fast and slow Exponential Moving Averages (EMAs) of the RSI to capture momentum shifts effectively.
Dynamic Bands: Utilizes a smoothed standard deviation approach to create upper and lower bands around the adaptive RSI, aiding in identifying extreme market conditions.
Signal Line: An additional EMA of the adaptive RSI serves as a signal line, assisting in confirming trend directions.
Customizable Color Schemes: Offers multiple predefined color palettes, including "Classic," "Mystic," "Accented," and "Royal," with an option for users to define custom colors for bullish and bearish signals.
How It Works
Adaptive RSI Computation: Calculates the difference between fast and slow EMAs of the RSI, producing a responsive oscillator that adapts to market momentum.
Band Formation: Applies a smoothing factor to the standard deviation of the adaptive RSI, generating dynamic upper and lower bands that adjust to market volatility.
Signal Line Generation: Computes an EMA of the adaptive RSI to act as a signal line, providing additional confirmation for potential entries or exits.
Visualization: Plots the adaptive RSI as color-coded columns, with colors indicating bullish or bearish momentum. The dynamic bands are filled to visually represent overbought and oversold zones.
How to Use
Identify Momentum Shifts: Observe crossovers between the adaptive RSI and the signal line to detect potential changes in trend direction.
Spot Overbought/Oversold Conditions: Monitor when the adaptive RSI approaches or breaches the dynamic bands, signaling possible market extremes.
Customize Visuals: Select from predefined color palettes or define custom colors to align the indicator's appearance with personal preferences or chart themes.
Customization Options
RSI and EMA Lengths: Adjust the lengths of the RSI, fast EMA, slow EMA, and signal EMA to fine-tune the indicator's sensitivity.
Band Settings: Modify the band length, multiplier, and smoothing factor to control the responsiveness and width of the dynamic bands.
Color Schemes: Choose from predefined color modes or enable custom color settings to personalize the indicator's appearance.
⚠️ DISCLAIMER ⚠️: This indicator alone is not reliable and should be combined with other indicator(s) for a stronger signal.
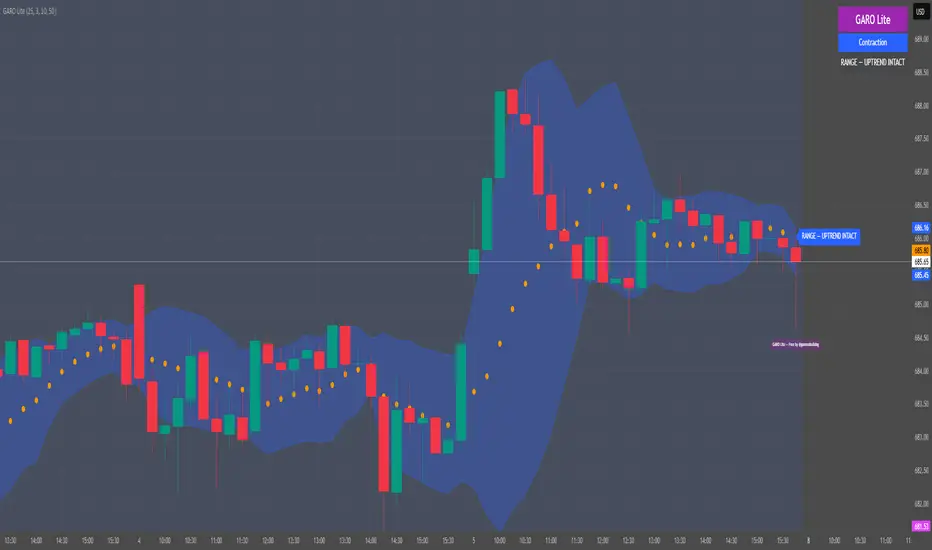
GARO Lite - Free Regime EngineGARO — Gamma Regime Engine
Overview
GARO (Gamma Regime Oscillator) is a visual regime engine that shows market conditions in real-time. This free edition is for educational and charting purposes only.
Key Features
Regime Detection: Highlights Expansion, Contraction, and Spike conditions using trend, volatility, and volume-based calculations.
Core and Bands: Central reference line with upper and lower bands.
Visual Alerts: Orange dots appear under candles during compressions; background colors indicate current regime.
Signal Labels: Labels provide visual guidance based on regime and trend slope.
Gamma Exposure (GEX) Proxy & Zero Gamma Flip: Optional visual overlays for contextual awareness.
User Inputs: Some settings are visible in the input panel but are disabled in this free edition.
How to Use
Regime Colors:
Expansion (green background): Market trending/expanding; core line indicates direction.
Contraction (blue background): Market range-bound; orange dots indicate compression.
Spike (red background): High volatility; visual alert only.
Labels & Signals:
Labels highlight potential regime moves; not trade advice.
Combine colors, core/band positions, and label cues with your own analysis.
Core Line & Bands:
Core line shows central reference per regime.
Upper/lower bands provide context for potential support/resistance zones.
Orange Dots:
Indicate compressions or regime-specific signals; visual only.
Gamma Exposure & Zero Gamma Flip (Optional):
Illustrates potential price sensitivity; charting/educational use only.
Important:
Protected code; underlying calculations are not visible.
For educational and visual guidance only; not financial or trading advice.
Works on any timeframe; free edition gives visual regime insights.
Dix$ons Tackle BoxDixsons Tackle Box — Multi-Tool Trend & Levels Suite (MA/EMA + VWAP + BB + Adaptive Trend Channels + Auto Fibs)
---
**Dixsons Tackle Box** is an all-in-one overlay for traders who want a clean chart with *stacked edge* instead of stacked indicators.
It combines:
* A **5-slot MA/EMA pack** with live slope % labels and MTF smoothing
* A **full VWAP engine** with event-based anchors, trend angle coloring, and VWAP bands
* **Bollinger Bands** with volatility-aware coloring and optional gradient background
* A **Short-Term & Long-Term Adaptive Trend Channel (ATC)** with automatic period detection, log-regression channels, and performance tables
* A **Dixson Auto Fibonacci suite**: ATR-based “rail” Fibs + Lookback Fibs off HH/LL, both driving a shared, fully customizable Fib bank
Everything is controlled logically by feature groups under the **“Tackle Box”** section, so you can quickly turn modules on/off and tune the tool to your style (scalp, intraday, swing, or position).
> **Important:** This is an analysis/visualization tool only. Nothing here is financial advice or an automatic trading system. Always test and manage risk yourself.
---
## 1. MA/EMA Pack — 5 Smart Averages with Slope %
**Group:** `Tackle Box` + per-slot groups `MA/EMA 1` … `MA/EMA 5`
**Main toggle:** `Enable MA's`
**Per-slot master row:** `_maRow1` … `_maRow5`
### What it does
This module gives you **five independent MA/EMA slots**, each with:
* Its own **type** (MA or EMA)
* **Length**, **color**, **line width**, and **plot style** (`Solid`, `Step`, or `Circles`)
* **Timeframe per slot** (MTF)
* Rich **label controls** (slope %, length/type text, timeframe text, etc.)
* **Label size** per slot (`tiny → huge`)
On top of that, each average has a **live slope % readout**, normalized by instrument tick size, so you can compare trend steepness across assets.
### Key features
* **Master slot row (1–5):**
In the `Tackle Box` group you have `_maRow1`–`_maRow5` toggles. These gate each slot globally, so you can quickly show/hide specific MAs without digging into each slot.
* **MTF Smoothed Mode:**
* `MTF Smoothed Mode` (on by default) makes higher-timeframe MAs **update only when the HTF bar closes (and on the last bar)**.
* That reduces the stair-stepping noise you often get when pulling HTF data onto an LTF chart, while still giving you accurate levels and a smooth, tradeable line.
* **Per-slot label text controls:**
Each MA group has toggles to control exactly what the label shows:
* `Show Label` – show/hide label entirely
* `Slope` – append slope % to the label
* `Len+Type` – show e.g. `50EMA` or `200MA`
* `TF` – show HTF name if the slot is on an MTF
* `'slope' text` – optionally include the word `slope` in the label
* **Slope % (angle) logic:**
Slope for each MA uses a normalized **“angle %” in **, based on the 1-bar change vs `syminfo.mintick`.
* Big positive values = strong uptrend
* Big negative values = strong downtrend
* Near zero = flat/neutral
This makes it easy to build rules like:
* “Only trade long if the **50EMA slope** is above +20% and price is above VWAP”
* “Take profit if slope on my faster MA collapses back toward 0.”
### Typical use
* Slot 1–2: **fast intraday EMAs** (e.g., 9 / 20 EMA)
* Slot 3–4: **structural EMAs/MAs** (e.g., 50 / 200)
* Slot 5: a **dedicated MTF trend filter** (e.g., 5-minute or 1-hour EMA on a 1-minute chart)
---
## 2. VWAP Engine + Bands — Anchor-Aware, Angle-Aware VWAP
**Group:** `Enable VWAP` + `------ VWAP Settings ------`, `Bands Settings`, `Color Settings`
### Core VWAP
* **Anchors:**
`Anchor Period` lets you choose where each VWAP reset starts:
* `Session` (day session VWAP, perfect for intraday)
* `Week`, `Month`, `Quarter`, `Year`, `Decade`, `Century`
* Corporate events: `Earnings`, `Dividends`, `Splits`
This lets you build VWAP logic around:
* **Intraday mean reversion** (Session VWAP + bands)
* **Swing anchor VWAPs** (Weekly/Monthly)
* **Event-based anchors** (earnings/dividend/split reaction)
* **Hide on DWM:**
`Hide VWAP on 1D or Above` lets you keep intraday VWAP from cluttering higher-TF charts.
* **Angle/Trend Detection:**
The VWAP engine computes a **regression slope** over each anchor segment and converts it to an **angle %**:
* `Angle Lookback (bars)` controls how many bars are used
* `Angle Trend Threshold (%)` sets the threshold where a slope is considered “trending”
With `Color VWAP by Trend` enabled:
* Uptrend > threshold → VWAP turns **trend up color** (e.g., lime)
* Downtrend < −threshold → VWAP turns **trend down color** (e.g., red)
* Inside threshold → VWAP uses a neutral color
You can also set separate **line widths** for neutral vs trend state and transparency to give a “Hull-style” visual feel.
* **VWAP Labels:**
You get a single, de-duplicated VWAP label on the last bar with:
* Optional **name** (`VWAP`)
* Optional **price** (`$xxx.xx`)
* Optional **angle %** and optional `"slope"` word
* Global **label size** for VWAP + bands
### VWAP Bands
* **Calc modes:**
`Bands Calculation Mode`:
* `Standard Deviation` – classic VWAP ± n * σ
* `Percentage` – bands as a fixed % of VWAP
* **Bands 1-3:**
Each band has:
* Visibility toggle, independent multiplier (`×`)
* Separate **upper/lower colors** per band
* Optional **fill** between upper/lower for each band
* Label toggles:
* `Show All Labels`
* `Show Band #X Label`
* `Band Labels: Show Names` (VWAP+1, VWAP-1, etc.)
* `Band Labels: Show Prices`
This lets you configure anything from a minimalist “just VWAP + 1 band” view to a full 3-band ladder.
### VWAP Highlight Fill
* **Premium/discount shading**:
Optional fill that shades:
* Region **above VWAP** when price is above (e.g., greenish)
* Region **below VWAP** when price is below (e.g., reddish)
This makes it extremely easy to see when price is trading at **premium vs discount** relative to the current anchor VWAP.
### Typical use
* Intraday scalpers: Session VWAP + 1–2 bands + highlight fill
* Swing traders: Weekly/Monthly VWAP + only the main line and label
* Event traders: Earnings-anchored VWAP, tracking post-earnings drift
---
## 3. Bollinger Bands — Volatility-Aware BB with Gradient Fill
**Group:** `Enable Bollinger Bands` + `------ Bollinger Band settings ------`
### What it adds
A clean Bollinger Band overlay designed to play nicely with the VWAP/MA stack:
* `Bollinger Bands Length` (default 20)
* `Bollinger Bands Multiplier` (default 2.0)
* `BB Basis Color` & **line width**
* Upper/lower bands colored based on **width change**:
* Expanding volatility → `BB Expanding Color`
* Contracting volatility → `BB Contracting Color`
You can also toggle:
* `Show Center Line MA Label` – prints something like `20ma` on the last bar.
* `Enable Gradient Background Fill` – draws a gradient between price and the bands:
* `Gradient Fill Up Color` for below-price fill
* `Gradient Fill Down Color` for above-price fill
### Why it’s unique here
Instead of just static bands, this implementation **flags volatility regimes** (expansion vs contraction) via color and optional gradient. That pairs nicely with ATR Fibs and VWAP:
* Use **BB contraction (squeeze)** + flat VWAP angle to anticipate breakouts.
* Use BB + VWAP bands to filter which “touches” are genuinely overextended.
---
## 4. Dixson Adaptive Trend Channel (ATC) — Short-Term & Long-Term Log Channels
**Master toggle:** `Enable Adaptive Trend Channel`
**Groups:** `------ Dixson ATC Settings ------`, `Short-Term Channel Settings`, `Long-Term Channel Settings`, `Short-Term Midline Settings`, `Long-Term Midline Settings`, `Channel Trend Background Fill Settings`, `Short-Term Table Settings`, `Long-Term Table Settings`
### Under the hood
ATC is a **log-scale regression channel engine** that automatically:
1. Scans a set of candidate periods.
* **Short-term:** 20 → 200 bars
* **Long-term:** 300 → 1200 bars
2. For each period, it computes:
* Log-price regression slope & intercept
* Standard deviation of residuals
* A Pearson-style R value (trend “strength”)
3. Picks the period with the **highest correlation (|R|)** and uses that as the **detected trend length**.
This yields a **data-driven channel** that adapts to whatever trend the market is actually respecting.
> For long-term stats, annualized return only makes sense on **daily/weekly** charts. On intraday charts, treat the “Annual Return” purely as informational.
### Short-Term Channel
Controls in `Short-Term Channel Settings` + `Short-Term Midline Settings`:
* `Show Short-Term Channel` – on/off
* `Deviation Multiplier (Short-Term)` – how wide the channel is (in standard deviations)
* **Upper/Lower colors**, line width, style (Solid/Dotted/Dashed), transparency
* `Line Extension Style` – Extend Right / Extend Both / Extend None / Extend Left
Optional **Short-Term Midline**:
* Toggle + color, style, width, transparency
* Tracks the regression line itself (center of the channel)
Background fill:
* `Enable ST Background Fill` with separate **ST Uptrend** / **ST Downtrend** colors
* Trend direction is inferred from regression slope sign
### Long-Term Channel
Mirrors the ST controls with its own group:
* `Show Long-Term Channel`
* `Deviation Multiplier (Long-Term)`
* Upper/Lower channel colors, thickness, style, transparency
* `Line Extension Style`
* Optional Long-Term midline + colors/styles
* Optional **background fill** with separate colors for up vs down
You can run **both channels at once**, giving a panel of:
* **Macro trend structure** (Long-Term ATC)
* **Current swing trend** (Short-Term ATC)
* MAs, VWAP, and Auto Fibs on top for entries/exits
### Trend Info Tables
Each channel has its own table options:
* `Show Detected Period` (bars used)
* `Show Trend Strength` – either:
* Descriptive text: “Extremely Weak” → “Ultra Strong”, or
* Raw Pearson R value if `Show Pearson R` is enabled
* `Show Annualized Return` (when timeframe is daily/weekly)
* Table position (`Top Left`, `Bottom Right`, etc.)
* Text size (`Small`, `Normal`, `Large`)
These tables quantify:
* Over what lookback the trend is being measured
* How “clean” that trend is
* What the approximate annualized performance of that trend has been
---
## 5. Dixson Auto Fibonacci Suite — ATR Fibs + Lookback Fibs + Shared Fib Bank
**Master toggle:** `Enable Auto Fibonacci`
**Groups:** `Dixson Auto Fibonacci`, `ATR Auto Fib`, `Previous ATR Fib`, `Lookback Auto Fib`, `Lookback Anchor Overrides`, `Fibonacci Levels`
You get **two separate engines** (ATR-based and Lookback-based) that both draw from the **same customizable Fib bank**, with optional log scaling.
---
### 5.1 Global Auto Fib Settings
* `Logarithmic Scale`
* When ON, Fib levels are interpolated in log-space (better for assets that move in percentages).
* When OFF, interpolation is linear in price.
This applies to **both** the ATR and Lookback engines.
---
### 5.2 ATR Auto Fib (Rail-Based, Supertrend-Driven)
**Groups:** `ATR Auto Fib`, `Previous ATR Fib`
The ATR engine builds **“rails”** that hug price without letting candles touch them, then projects Fib levels between these anchors.
#### How it works
1. Uses built-in `ta.supertrend` with:
* `ATR Period`
* `ATR Multiplier`
2. Builds dynamic **upper and lower rails** around price:
* Uses ATR to define a **proximity gap** (`Proximity (×ATR)`) so rails stay **just outside the wicks** (no-touch behavior).
* Smooths raw highs/lows slightly (RMA) to avoid spiky rails.
* Ensures the upper rail is always ≥ high+gap and lower rail ≤ low−gap.
3. The **direction** (uptrend/downtrend) is inferred from the Supertrend direction:
* On trend flips, the script:
* Captures the prior rail pair as a **“previous segment”**
* Starts a new rail segment in the new direction
4. From these rails, the script draws **directional Fib “ladders”**:
* For the **current ATR Fib**:
* The Fib is drawn from one anchor to the other depending on the trend sign.
* Rays are projected `Ray Length` bars to the right of `Current Offset`.
* For the **previous ATR Fib**:
* The last completed segment’s start/end rails are used as anchors
* Rays are projected using `Prev Fib Offset` and `Prev Fib Length`
#### Current ATR Fib controls
* `Enable ATR Fib` – toggles current ATR Fib bank
* `ATR Period`, `ATR Multiplier` – control the “engine” behind the rails and ST logic
* `Current Offset`, `Ray Length` – where and how far rays are drawn
* `Show Level Text`, `Show Price`, `Display % not ratio` – label style
* `Label Size (Current ATR Fib)` – for all current ATR Fib labels
Visual extras:
* `Plot Hi/Low Anchor Lines` – shows upper/lower rails
* `Plot ATR Trailing Stop` – shows clamped Supertrend as a continuous line
#### Previous ATR Fib controls
* `Enable Prev ATR Fib` – toggles previous segment ladders
* Independent `Prev Fib Offset`, `Prev Fib Length`
* Separate label controls:
* `Show Level Text (Prev)`
* `Show Price (Prev)`
* `Display % not ratio (Prev)`
* `Label Size (Previous ATR Fib)`
Use the **current ATR Fib** as your active trading “ladder” and the **previous ATR Fib** to track recently broken structure and potential retest zones.
---
### 5.3 Lookback Auto Fib — HH/LL-Driven Fib Bank, MTF + Manual Overrides
**Group:** `Lookback Auto Fib` + `Lookback Anchor Overrides`
This engine draws Fibs between **highest high** and **lowest low** within a given lookback window on a chosen timeframe.
#### How it works
1. Select higher timeframe:
* `Lookback Timeframe` (empty = chart timeframe)
2. Choose your range:
* `Lookback Bars` – number of bars on the selected TF to scan for extremes
3. Optionally allow look-ahead:
* `Look-ahead Bars (repainting)`
* `0` = no look-ahead (no forward info, no repainting)
* `>0` = uses `barmerge.lookahead_on` for forward-looking extremes (can repaint)
4. For that range, the script finds:
* Highest high + its bar offset
* Lowest low + its bar offset
5. Trend direction is determined by **which extreme is more recent**:
* Recent high → **down** direction (high → low)
* Recent low → **up** direction (low → high)
6. Manual direction overrides:
* `Force Uptrend` / `Force Downtrend` – override the auto decision
7. Manual anchor overrides:
* `Manual Anchor High (LB)`
* `Manual Anchor Low (LB)`
If both are set, those become the anchors and direction is deduced from which is higher.
8. The engine then draws a **directional Fib ladder**:
* Anchors between high/low based on direction
* Rays extend `Lookback Fib Length` bars from `Lookback Fib Offset`
#### Label controls
* `Show Level Text`, `Show Price`, `Display % not ratio`
* `Label Size (Lookback Fib)`
* Labels are prefixed with `LB` to distinguish them from ATR Fibs.
This engine is ideal for:
* **Swing structure mapping:** Drawing Fibs across the last major swing on the HTF.
* **Confluence:** Aligning Lookback Fibs with ATR Fibs, ATC channel boundaries, and VWAP bands.
---
### 5.4 Shared Fibonacci Levels — Fully Custom Fib Bank for Both Engines
**Group:** `Fibonacci Levels`
The ATR and Lookback engines **both** use the same Fib bank:
* **Ratios provided by default:**
* 0.000
* 0.146
* 0.236
* 0.382
* 0.500
* 0.618
* 0.650
* 0.707
* 0.786
* 0.886
* 1.000
* 1.130
* 1.272
* 1.618
* 2.000
Each ratio has its own:
* `Enable Level X.XXX`
* `Level X.XXX` (the actual ratio – fully editable)
* `Thickness X.XXX` (line width)
* `Style X.XXX` (Solid / Dashed / Dotted)
* `Color X.XXX` (line + label color)
Adjusting a level here **instantly updates both** ATR and Lookback ladders. This makes it very easy to:
* Run “standard” Fib sets for classic retracements
* Or define your **own Fib presets** (e.g., 0.25 / 0.5 / 0.75, or custom extension clusters)
---
## How to Use & Suggested Workflows
**Scalpers / 0DTE / Intraday:**
* Enable:
* MA/EMA pack (fast EMAs + one MTF slot)
* VWAP (Session anchor) + 1–2 VWAP bands + highlight fill
* ATR Auto Fib (current + previous)
* Optionally hide:
* Lookback Fibs
* Long-Term ATC (unless you want HTF bias on your intraday chart)
Use slope labels, VWAP angle %, and ATR Fib ladders to structure trades around pullbacks, mean reversion, and breakouts.
**Swing / Position traders:**
* Turn on:
* Long-Term ATC (with table)
* Short-Term ATC for swing structure
* Lookback Auto Fib on a higher timeframe (e.g., D on 4H chart)
* Keep VWAP anchored to Week or Month, and MA slots for key reference MAs.
Use ATC channels for **trend structure**, Lookback Fibs for **swing levels**, and long VWAPs for **value zones**.
---
## Final Notes & Disclaimer
* Works on **all symbols** and **all timeframes**, but some stats (like “Annualized Return”) are only meaningful on **daily/weekly** data.
* Some options (like Look-ahead mode for Lookback Fibs) can **repaint** on purpose. These are clearly labeled — use them only if you understand and want forward-looking behavior.
* This script does **not** place trades. It is a visual / analytical tool only.
* Nothing in this indicator or description is financial advice. Always do your own research, forward-test, and manage risk appropriately.
If you have **invite-only access** to **Dixsons Tackle Box**, you’re getting the full Dixson overlay stack in one place — designed to be the central “hub” for your chart, not just another line on it.

Channel Breakout by NatXateThe Channel Breakout by NatXate is a multi-channel technical indicator designed to identify potential breakout opportunities based on a combination of Keltner Channels, Donchian Channels, and Bollinger Bands.
This indicator helps traders pinpoint buy and sell signals by analyzing price behavior around key channel boundaries, while filtering out false signals using volatility and momentum criteria such as the Average True Range (ATR) and Bollinger Bands Width (BBW).
Key Features:
Keltner Channel:
The Keltner Channel is calculated using an Exponential Moving Average (EMA) and ATR to define upper and lower boundaries.
The upper and lower Keltner boundaries serve as potential breakout levels.
Donchian Channel:
The Donchian Channel tracks the highest high and lowest low over a user-defined period.
Price breaking above or below these boundaries indicates a potential long or short opportunity.
Bollinger Bands:
Bollinger Bands use a Simple Moving Average (SMA) and standard deviation to define dynamic support and resistance levels.
The upper and lower Bollinger boundaries provide an additional layer of confirmation for breakouts.
Bollinger Bands Width (BBW) Filter:
Measures the width of the Bollinger Bands, which reflects market volatility.
A minimum BBW threshold (minBBW) ensures signals are only generated during periods of sufficient volatility, helping to avoid false signals in consolidating markets.
ATR Filter:
The ATR is used to measure market volatility.
Only signals with ATR exceeding a user-defined percentage of the current price (atrThresholdPercent) are considered valid.
Buy and Sell Conditions:
Buy Signal:
Price breaks above the upper boundary of any of the three channels (Keltner, Donchian, or Bollinger Bands).
ATR is above its threshold, indicating sufficient volatility.
BBW is above the minBBW threshold.
Sell Signal:
Price breaks below the lower boundary of any of the three channels.
ATR is above its threshold.
BBW is above the minBBW threshold.
Non-Repainting Logic:
Signals are confirmed only after the bar closes (barstate.isconfirmed), preventing repainting and ensuring reliable signal generation.
Visual Signals:
Buy signals are marked with a green "B" label below the bar.
Sell signals are marked with a red "S" label above the bar.
The upper and lower boundaries of the Keltner Channel, Donchian Channel, and Bollinger Bands are plotted for visual clarity.
Alerts:
Separate alerts are available for Buy and Sell signals:
Buy Signal: "Channel Breakout Buy Signal by NatXate detected!"
Sell Signal: "Channel Breakout Sell Signal by NatXate detected!"
Alerts trigger once per bar close, making it suitable for real-time trading or monitoring.
How It Works:
Trend Identification:
The indicator identifies trends based on price breakouts above or below the channel boundaries.
Volatility Filtering:
Both ATR and BBW filters ensure that only high-probability breakout signals are shown, reducing noise in low-volatility environments.
Signal Confirmation:
Signals are confirmed after the bar closes to prevent false positives or premature triggers.
Parameters:
Keltner Channel Parameters:
lengthKC: Period for the Keltner Channel's EMA.
multKC: ATR multiplier for Keltner Channel boundaries.
Donchian Channel Parameters:
lengthDC: Period for calculating the highest high and lowest low.
Bollinger Bands Parameters:
lengthBB: Period for the Bollinger Bands' SMA.
multBB: Standard deviation multiplier for Bollinger Bands boundaries.
ATR Filter:
atrLength: Period for calculating ATR.
atrThresholdPercent: Minimum ATR as a percentage of the price for valid signals.
BBW Filter:
minBBW: Minimum Bollinger Bands Width required for signal generation.
Use Cases:
Breakout Trading:
Detect potential buy and sell opportunities when price breaks key channel boundaries during high volatility.
Trend Following:
Use the indicator to confirm trends and enter trades in the direction of the breakout.
Avoiding Low-Volatility Periods:
The BBW and ATR filters help avoid false signals in consolidating or choppy markets.
Recommended Usage:
Combine this indicator with additional tools such as volume analysis or momentum oscillators (e.g., MACD, RSI) for further confirmation.
Suitable for various timeframes, from intraday to swing trading.
Backtest thoroughly to adjust parameters for the specific market and timeframe you trade.

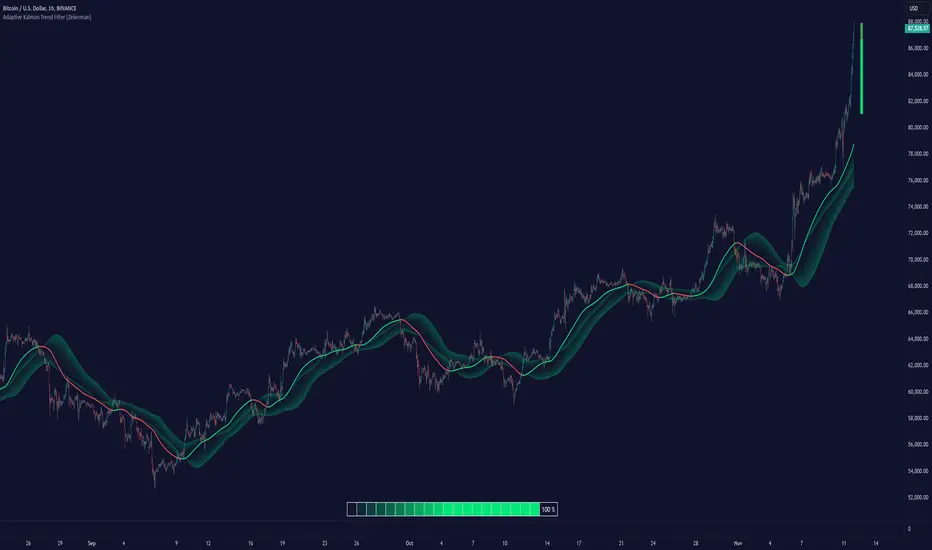
Adaptive Kalman Trend Filter (Zeiierman)█ Overview
The Adaptive Kalman Trend Filter indicator is an advanced trend-following tool designed to help traders accurately identify market trends. Utilizing the Kalman Filter—a statistical algorithm rooted in control theory and signal processing—this indicator adapts to changing market conditions, smoothing price data to filter out noise. By focusing on state vector-based calculations, it dynamically adjusts trend and range measurements, making it an excellent tool for both trend-following and range-based trading strategies. The indicator's adaptive nature is enhanced by options for volatility adjustment and three unique Kalman filter models, each tailored for different market conditions.
█ How It Works
The Kalman Filter works by maintaining a model of the market state through matrices that represent state variables, error covariances, and measurement uncertainties. Here’s how each component plays a role in calculating the indicator’s trend:
⚪ State Vector (X): The state vector is a two-dimensional array where each element represents a market property. The first element is an estimate of the true price, while the second element represents the rate of change or trend in that price. This vector is updated iteratively with each new price, maintaining an ongoing estimate of both price and trend direction.
⚪ Covariance Matrix (P): The covariance matrix represents the uncertainty in the state vector’s estimates. It continuously adapts to changing conditions, representing how much error we expect in our trend and price estimates. Lower covariance values suggest higher confidence in the estimates, while higher values indicate less certainty, often due to market volatility.
⚪ Process Noise (Q): The process noise matrix (Q) is used to account for uncertainties in price movements that aren’t explained by historical trends. By allowing some degree of randomness, it enables the Kalman Filter to remain responsive to new data without overreacting to minor fluctuations. This noise is particularly useful in smoothing out price movements in highly volatile markets.
⚪ Measurement Noise (R): Measurement noise is an external input representing the reliability of each new price observation. In this indicator, it is represented by the setting Measurement Noise and determines how much weight is given to each new price point. Higher measurement noise makes the indicator less reactive to recent prices, smoothing the trend further.
⚪ Update Equations:
Prediction: The state vector and covariance matrix are first projected forward using a state transition matrix (F), which includes market estimates based on past data. This gives a “predicted” state before the next actual price is known.
Kalman Gain Calculation: The Kalman gain is calculated by comparing the predicted state with the actual price, balancing between the covariance matrix and measurement noise. This gain determines how much of the observed price should influence the state vector.
Correction: The observed price is then compared to the predicted price, and the state vector is updated using this Kalman gain. The updated covariance matrix reflects any adjustment in uncertainty based on the latest data.
█ Three Kalman Filter Models
Standard Model: Assumes that market fluctuations follow a linear progression without external adjustments. It is best suited for stable markets.
Volume Adjusted Model: Adjusts the filter sensitivity based on trading volume. High-volume periods result in stronger trends, making this model suitable for volume-driven assets.
Parkinson Adjusted Model: Uses the Parkinson estimator, accounting for volatility through high-low price ranges, making it effective in markets with high intraday fluctuations.
These models enable traders to choose a filter that aligns with current market conditions, enhancing trend accuracy and responsiveness.
█ Trend Strength
The Trend Strength provides a visual representation of the current trend's strength as a percentage based on oscillator calculations from the Kalman filter. This table divides trend strength into color-coded segments, helping traders quickly assess whether the market is strongly trending or nearing a reversal point. A high trend strength percentage indicates a robust trend, while a low percentage suggests weakening momentum or consolidation.
█ Trend Range
The Trend Range section evaluates the market's directional movement over a specified lookback period, highlighting areas where price oscillations indicate a trend. This calculation assesses how prices vary within the range, offering an indication of trend stability or the likelihood of reversals. By adjusting the trend range setting, traders can fine-tune the indicator’s sensitivity to longer or shorter trends.
█ Sigma Bands
The Sigma Bands in the indicator are based on statistical standard deviations (sigma levels), which act as dynamic support and resistance zones. These bands are calculated using the Kalman Filter's trend estimates and adjusted for volatility (if enabled). The bands expand and contract according to market volatility, providing a unique visualization of price boundaries. In high-volatility periods, the bands widen, offering better protection against false breakouts. During low volatility, the bands narrow, closely tracking price movements. Traders can use these sigma bands to spot potential entry and exit points, aiming for reversion trades or trend continuation setups.
Trend Based
Volatility Based
█ How to Use
Trend Following:
When the Kalman Filter is green, it signals a bullish trend, and when it’s red, it indicates a bearish trend. The Sigma Cloud provides additional insights into trend strength. In a strong bullish trend, the cloud remains below the Kalman Filter line, while in a strong bearish trend, the cloud stays above it. Expansion and contraction of the Sigma Cloud indicate market momentum changes. Rapid expansion suggests an impulsive move, which could either signal the continuation of the trend or be an early sign of a possible trend reversal.
Mean Reversion: Watch for prices touching the upper or lower sigma bands, which often act as dynamic support and resistance.
Volatility Breakouts: Enable volatility-adjusted sigma bands. During high volatility, watch for price movements that extend beyond the bands as potential breakout signals.
Trend Continuation: When the Kalman Filter line aligns with a high trend strength, it signals a continuation in that direction.
█ Settings
Measurement Noise: Adjusts how sensitive the indicator is to price changes. Higher values smooth out fluctuations but delay reaction, while lower values increase sensitivity to short-term changes.
Kalman Filter Model: Choose between the standard, volume-adjusted, and Parkinson-adjusted models based on market conditions.
Band Sigma: Sets the standard deviation used for calculating the sigma bands, directly affecting the width of the dynamic support and resistance.
Volatility Adjusted Bands: Enables bands to dynamically adapt to volatility, increasing their effectiveness in fluctuating markets.
Trend Strength: Defines the lookback period for trend strength calculation. Shorter periods result in more responsive trend strength readings, while longer periods smooth out the calculation.
Trend Range: Specifies the lookback period for the trend range, affecting the assessment of trend stability over time.
-----------------
Disclaimer
The information contained in my Scripts/Indicators/Ideas/Algos/Systems does not constitute financial advice or a solicitation to buy or sell any securities of any type. I will not accept liability for any loss or damage, including without limitation any loss of profit, which may arise directly or indirectly from the use of or reliance on such information.
All investments involve risk, and the past performance of a security, industry, sector, market, financial product, trading strategy, backtest, or individual's trading does not guarantee future results or returns. Investors are fully responsible for any investment decisions they make. Such decisions should be based solely on an evaluation of their financial circumstances, investment objectives, risk tolerance, and liquidity needs.
My Scripts/Indicators/Ideas/Algos/Systems are only for educational purposes!
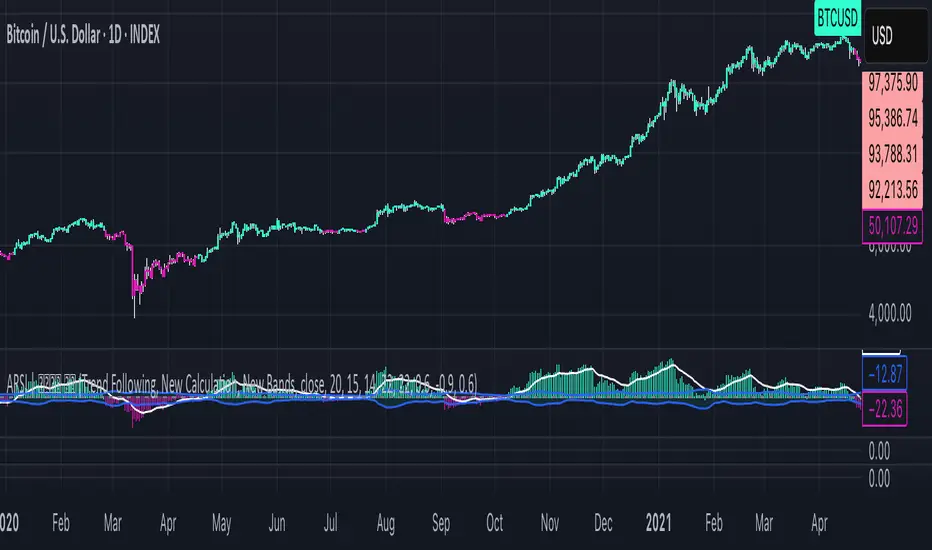
Bitcoin Cycle Master Z-ScoreThe "Bitcoin Cycle Master Z-Score" indicator is designed for in-depth, long-term analysis of Bitcoin's price cycles, using several key metrics to track market behavior and forecast potential price tops and bottoms. The indicator integrates multiple moving averages and on-chain metrics, offering a comprehensive view of Bitcoin’s historical and projected performance. Each of its components plays a crucial role in identifying critical cycle points.
The Z-Score is calculated between the 3 lower bands and the 2 upper bands
top_bands = (DeltaTop() + TerminalPrice())/2
bottom_bands = (BalancedPrice() + CVDD() + RealizedPrice())/3
The Z-Score is calculated to be -3 Z at the bottom bands and 3 Z at the top bands
mean = (top_bands + bottom_bands) / 2
bands_range = top_bands - bottom_bands
stdDev = bands_range != 0 ? bands_range / 6 : 0
zScore = stdDev != 0 ? (close - mean) / stdDev : 0
Created for TRW

Linear Regression Channel Pro# Linear Regression Channel Pro - Script Description
## English Description
### What it does
The **Linear Regression Channel Pro** is a technical analysis indicator that creates a statistical channel around price movements using linear regression mathematics. The script calculates the best-fit line through a specified number of price bars and then adds parallel boundaries based on standard deviation calculations.
### Key Features
- **Main Regression Line**: Shows the statistical trend direction of the price over the selected period
- **Channel Boundaries**: Upper and lower bands that contain most price movements (typically 95% when using 2.0 multiplier)
- **Inner Boundaries**: Additional reference lines for more precise analysis
- **Future Projection**: Extends all lines into the future to show potential price paths
- **Customizable Parameters**: Adjustable period length, deviation multipliers, and projection distance
### How it works
1. **Data Collection**: Gathers price data over the specified regression length (default 400 bars)
2. **Linear Regression**: Calculates the mathematical best-fit line through the price data
3. **Standard Deviation**: Measures how much prices deviate from the regression line
4. **Channel Creation**: Creates parallel lines above and below the regression line
5. **Future Projection**: Extends the channel into the future using the same slope
### Statistical Foundation and Band Settings
**The 68-95-99.7 Rule**
The indicator is based on the statistical principle that in a normal distribution:
- **1 Standard Deviation (σ)**: Contains approximately **68%** of price movements
- **2 Standard Deviations (σ)**: Contains approximately **95%** of price movements
- **3 Standard Deviations (σ)**: Contains approximately **99.7%** of price movements
**Outer Bands (Default 2.0 Multiplier)**
- **Coverage**: Approximately **95%** of price movements
- **Meaning**: Only 5% of price action should exceed these bands
- **Usage**: Identification of extreme overbought/oversold conditions
- **Signal**: Touching outer bands often indicates potential reversal points
**Inner Bands (Default 1.0 Multiplier)**
- **Coverage**: Approximately **68%** of price movements
- **Meaning**: 32% of movements can normally exceed these bands
- **Usage**: Identification of significant but not extreme price moves
- **Signal**: Breaking inner bands suggests meaningful directional movement
### Recommended Settings by Market Type
**Standard Configuration**
```
- Outer Bands: 2.0 (95% coverage)
- Inner Bands: 1.0 (68% coverage)
```
**High Volatility Markets (Crypto, Emerging Markets)**
```
- Outer Bands: 2.5-3.0 (99%+ coverage)
- Inner Bands: 1.5 (85% coverage)
```
**Low Volatility Markets (Major Forex, Blue Chip Stocks)**
```
- Outer Bands: 1.5 (86% coverage)
- Inner Bands: 0.5 (38% coverage)
```
### Trading Applications
**Trend Analysis**
- The slope of the regression line indicates the overall trend direction
- Steep slopes suggest strong trends, flat slopes suggest consolidation
- Price above center line = bullish bias, below = bearish bias
**Support and Resistance Levels**
- **Inner bands**: Act as first level support/resistance (68% probability)
- **Outer bands**: Act as strong support/resistance (95% probability)
- **Dynamic levels**: Bands adjust automatically to market conditions
**Entry and Exit Strategies**
*Using Inner Bands (1.0σ):*
- **Breakout signals**: Price breaking through inner bands with volume confirms direction
- **Pullback entries**: Price returning to inner band after breakout offers entry opportunity
- **Range trading**: Price oscillating between inner bands suggests consolidation
*Using Outer Bands (2.0σ):*
- **Reversal signals**: Price touching outer bands often indicates exhaustion
- **Extreme conditions**: Only 5% of movements reach these levels
- **Profit taking**: Consider closing positions when price reaches outer bands
**Risk Management Applications**
- **Stop Loss Placement**: Use opposite band as stop level (high probability of not being hit randomly)
- **Position Sizing**: Wider channels = higher volatility = smaller position sizes
- **Risk/Reward**: Measure potential moves using band distances
**Future Planning with Projections**
- **Target Setting**: Orange projection lines show potential future support/resistance
- **Trade Duration**: Plan holding periods based on projected channel direction
- **Market Timing**: Anticipate when price might reach significant levels
### Practical Trading Examples
**Bullish Trend Scenario**
1. Price consistently above center line (trend confirmed)
2. Bounces from inner lower band = re-entry opportunity
3. Reaching outer upper band = consider profit taking
4. Break above outer upper band = potential trend acceleration
**Range-Bound Market**
1. Price oscillates between inner bands = range trading mode
2. Sell near inner upper band, buy near inner lower band
3. Breakout from outer bands = range breakout signal
**Bearish Trend Scenario**
1. Price consistently below center line (downtrend confirmed)
2. Bounces from inner upper band = short entry opportunity
3. Reaching outer lower band = potential oversold bounce
4. Break below outer lower band = trend continuation likely
### Best Practices and Tips
- **Timeframe Selection**: Use higher timeframes (4H, Daily) for more reliable statistical significance
- **Confirmation**: Combine with volume analysis and other indicators
- **Market Adaptation**: Adjust multipliers based on asset volatility characteristics
- **Regression Length**: Shorter periods (100-200) for reactive signals, longer (400-800) for stable trends
- **False Breakouts**: Wait for close beyond bands rather than just touching
- **Volume Confirmation**: Higher volume on band breakouts increases signal reliability
---
## Descrizione Italiana
### Cosa fa
Il **Linear Regression Channel Pro** è un indicatore di analisi tecnica che crea un canale statistico intorno ai movimenti di prezzo utilizzando la matematica della regressione lineare. Lo script calcola la linea di miglior adattamento attraverso un numero specificato di barre di prezzo e aggiunge quindi confini paralleli basati sui calcoli della deviazione standard.
### Caratteristiche Principali
- **Linea di Regressione Principale**: Mostra la direzione statistica del trend del prezzo nel periodo selezionato
- **Confini del Canale**: Bande superiori e inferiori che contengono la maggior parte dei movimenti di prezzo (tipicamente il 95% usando il moltiplicatore 2.0)
- **Confini Interni**: Linee di riferimento aggiuntive per un'analisi più precisa
- **Proiezione Futura**: Estende tutte le linee nel futuro per mostrare potenziali percorsi di prezzo
- **Parametri Personalizzabili**: Lunghezza del periodo, moltiplicatori di deviazione e distanza di proiezione regolabili
### Come Funziona
1. **Raccolta Dati**: Raccoglie i dati di prezzo per la lunghezza di regressione specificata (default 400 barre)
2. **Regressione Lineare**: Calcola matematicamente la linea di miglior adattamento attraverso i dati di prezzo
3. **Deviazione Standard**: Misura quanto i prezzi si discostano dalla linea di regressione
4. **Creazione del Canale**: Crea linee parallele sopra e sotto la linea di regressione
5. **Proiezione Futura**: Estende il canale nel futuro usando la stessa pendenza
### Fondamenti Statistici e Impostazione delle Bande
**La Regola 68-95-99.7**
L'indicatore si basa sul principio statistico che in una distribuzione normale:
- **1 Deviazione Standard (σ)**: Contiene circa il **68%** dei movimenti di prezzo
- **2 Deviazioni Standard (σ)**: Contiene circa il **95%** dei movimenti di prezzo
- **3 Deviazioni Standard (σ)**: Contiene circa il **99.7%** dei movimenti di prezzo
**Bande Esterne (Moltiplicatore Default 2.0)**
- **Copertura**: Circa il **95%** dei movimenti di prezzo
- **Significato**: Solo il 5% dell'azione di prezzo dovrebbe superare queste bande
- **Utilizzo**: Identificazione di condizioni estreme di ipercomprato/ipervenduto
- **Segnale**: Il tocco delle bande esterne spesso indica potenziali punti di inversione
**Bande Interne (Moltiplicatore Default 1.0)**
- **Copertura**: Circa il **68%** dei movimenti di prezzo
- **Significato**: Il 32% dei movimenti può normalmente superare queste bande
- **Utilizzo**: Identificazione di movimenti di prezzo significativi ma non estremi
- **Segnale**: La rottura delle bande interne suggerisce un movimento direzionale significativo
### Impostazioni Raccomandate per Tipo di Mercato
**Configurazione Standard**
```
- Bande Esterne: 2.0 (copertura 95%)
- Bande Interne: 1.0 (copertura 68%)
```
**Mercati ad Alta Volatilità (Crypto, Mercati Emergenti)**
```
- Bande Esterne: 2.5-3.0 (copertura 99%+)
- Bande Interne: 1.5 (copertura 85%)
```
**Mercati a Bassa Volatilità (Forex Maggiori, Azioni Blue Chip)**
```
- Bande Esterne: 1.5 (copertura 86%)
- Bande Interne: 0.5 (copertura 38%)
```
### Applicazioni nel Trading
**Analisi del Trend**
- La pendenza della linea di regressione indica la direzione generale del trend
- Pendenze ripide suggeriscono trend forti, pendenze piatte suggeriscono consolidamento
- Prezzo sopra la linea centrale = bias rialzista, sotto = bias ribassista
**Livelli di Supporto e Resistenza**
- **Bande interne**: Agiscono come supporto/resistenza di primo livello (probabilità 68%)
- **Bande esterne**: Agiscono come supporto/resistenza forte (probabilità 95%)
- **Livelli dinamici**: Le bande si adattano automaticamente alle condizioni di mercato
**Strategie di Entrata e Uscita**
*Usando le Bande Interne (1.0σ):*
- **Segnali di breakout**: Il prezzo che rompe le bande interne con volume conferma la direzione
- **Entrate su pullback**: Il prezzo che ritorna alla banda interna dopo un breakout offre opportunità di entrata
- **Range trading**: Il prezzo che oscilla tra bande interne suggerisce consolidamento
*Usando le Bande Esterne (2.0σ):*
- **Segnali di inversione**: Il prezzo che tocca le bande esterne spesso indica esaurimento
- **Condizioni estreme**: Solo il 5% dei movimenti raggiunge questi livelli
- **Presa di profitto**: Considera di chiudere posizioni quando il prezzo raggiunge le bande esterne
**Applicazioni di Gestione del Rischio**
- **Posizionamento Stop Loss**: Usa la banda opposta come livello di stop (alta probabilità di non essere colpito casualmente)
- **Dimensionamento Posizioni**: Canali più larghi = volatilità maggiore = posizioni più piccole
- **Rischio/Rendimento**: Misura i movimenti potenziali usando le distanze delle bande
**Pianificazione Futura con Proiezioni**
- **Impostazione Target**: Le linee di proiezione arancioni mostrano potenziali supporti/resistenze futuri
- **Durata del Trade**: Pianifica i periodi di detenzione basandoti sulla direzione del canale proiettato
- **Timing di Mercato**: Anticipa quando il prezzo potrebbe raggiungere livelli significativi
### Esempi Pratici di Trading
**Scenario Trend Rialzista**
1. Prezzo costantemente sopra la linea centrale (trend confermato)
2. Rimbalzi dalla banda interna inferiore = opportunità di re-entrata
3. Raggiungimento banda esterna superiore = considera presa di profitto
4. Rottura sopra banda esterna superiore = potenziale accelerazione del trend
**Mercato in Range**
1. Prezzo oscilla tra bande interne = modalità range trading
2. Vendi vicino alla banda interna superiore, compra vicino a quella inferiore
3. Breakout dalle bande esterne = segnale di rottura del range
**Scenario Trend Ribassista**
1. Prezzo costantemente sotto la linea centrale (downtrend confermato)
2. Rimbalzi dalla banda interna superiore = opportunità di short
3. Raggiungimento banda esterna inferiore = potenziale rimbalzo da ipervenduto
4. Rottura sotto banda esterna inferiore = probabile continuazione del trend
### Migliori Pratiche e Consigli
- **Selezione Timeframe**: Usa timeframe più alti (4H, Giornaliero) per maggiore significatività statistica
- **Conferma**: Combina con analisi del volume e altri indicatori
- **Adattamento al Mercato**: Regola i moltiplicatori in base alle caratteristiche di volatilità dell'asset
- **Lunghezza Regressione**: Periodi più corti (100-200) per segnali reattivi, più lunghi (400-800) per trend stabili
- **Falsi Breakout**: Aspetta la chiusura oltre le bande piuttosto che solo il tocco
- **Conferma del Volume**: Volume più alto sui breakout delle bande aumenta l'affidabilità del segnale

Market Oracle Plus [ChartPrime]ChartPrime Oracle Plus combines actionable, elegant and functional indicators into a single toolkit. It builds upon previously laid out creations in order to create a more advanced experience. Combinations of both trend following and contrarian logic aim to provide traders with a deeper insight into market movements; aiming to assist in better entries and exits.
Designed and created by the ChartPrime team, this toolkit takes deeper level theory and expresses it in a usable format for traders. ChartPrime Oracle Plus is designed to satisfy and cover major trading theories allowing the user to pick and select the features that fit them.
Trend signals, Prime Ranges and Quantum Reactor
When using any indicator suite it is important to understand these tools are there to assist trading rather than to be a single source of truth. Functionality such as Auto Maximization of parameters is there to guide and enhance user experience, however it is important to be aware of overfitting results.
Plus features:
ChartPrime Market Oracle Plus has introduced some unique additions in order to enhance traders’ experiences.
Custom Signals: Toolkits and signals often limit traders to a single algorithm. This reduces flexibility and adaptability in the market. Traders will often want to develop their own systems without the constraints of an existing one. Market Oracle Plus introduces a custom signals builder; taking components in the toolkit and allowing them to be combined into a single signal/alert. Want a signal when the trend changes with bullish candlestick patterns? With a few clicks this can now be enabled. Traders can also set alerts on their custom signals making automating trades easier than ever.
Custom signals labelled with a cross
The Quantum tools. Looking at the tiny in the market and making it clearer.
Quantum Bands: The quantum bands provide areas of highly likely reversals to occur by analysing market momentum and noise. They can be used classically and are comparable in application to the commonly used bollinger bands. When price finds itself inside a zone it is more likely to reverse. This is excellent when used in confluence with other reversal indicators. The reason these bands are unique is their ability to adapt to trending markets allowing not only reversals to be identified in ranging markets but also trending ones leveraging volatility calculations. They also enable the user to use MTF functionality to load bands from higher timeframes. This allows users to have a broader perspective of support and resistance levels in the market.
The quantum bands are powerful for scalpers who want faster entries and exits. Entering a trade on a bands extremity can give earlier entries and exiting on the touch of the opposing band can serve as a great take profit.
Quantum Bands bounce
Quantum Reactor: The quantum reactor is a custom weighted moving average analyzing trends in the market. Unlike another moving averages; weighting has been considered to account for ranging markets. The Reactor will turn gray in a ranging market to avoid chop allowing for filtering of trades. This offers a unique insight into price action. Classical moving averages will constantly attempt to re-adapt to a trend whereas the Reactor will avoid adaptation where it sees fit.
Filtering a ranging market
Features included & Use cases:
Signal Mode: Select the type of assistive signals you are requiring. Provided are both trend following signals with self optimization using backtest results as well as reversal signals, aiming to provide real time tops and bottoms in markets. Both these signal modes can be fine tuned using the tuning input to refine signals to a trader's liking. The ChartPrime Auto Maximizer will automatically apply a backtested parameter and display the "best performing signals" on your chart. It is important to note this is not indicative of future results. ChartPrime Trend Signals leverage audio engineering inspired techniques and low-pass filters in order to achieve and attempt to produce lower lag response times and therefore is designed to have a uniqueness when compared to more classical trend following approaches.
Candle Highlighting: Choose between a clean gradient or more classical red/green coloring. These color the candles to assist with trend identification.
ChartPrime Dashboard: This redesigned dashboard provides 4 simple to interpret metrics. Firstly, the Optimal Tuning box provides a backtested result giving you the most accurate input. Again, it is important to note this is not indicative of future results. A Prime Score is also provided. This metric is a collection of ChartPrime trend following indicators bundled into a single item. It ranges from 0 (being a very bearish trend) to 10 (being a very bullish trend). 5 would indicate a ranging market. A consolidation score is also provided showing how "ranging" the market is. 10 being a low volatility and consolidating market and 0 being a more volatile and trending market which can assist the trader in avoiding ranges (if undesired). Finally the market prophecy gives simple forecasts in text form giving outlooks on potential activity.
The unique bar based visualization makes it clearer than ever to quantify key metrics on your chart.
Additional Features:
The Dynamic Reactor provides a simple band passing through the chart. This can provide assistance in support and resistance locations as well as identifying the trend direction expressed via green and red colors. Taking a moving average and applying unique low lag adaptivity calculations gives this plot a unique and fast behavior. This gives a unique edge to standard high length moving averages.
The Prime Ranges provide VWAP inspired real time actionable ranges on your chart. These ranges provide support and resistance levels as well as coloring, once again, there to aid trend identification. By generating a distribution and projecting it we produce real time levels for traders.
Candlestick structures analyze candlestick formation putting a spin on classical candlestick patterns and provide the most relevant formations on the chart. These are not classical and are filtered by further analyzing market activity. A trader's classic with a spin.
The Prime Trend Assistant provides a trend following dynamic support and resistance level. This makes it perfect to use in confluence or as a filter for other supporting indicators. This is an adaptive trend following system designed to handle volatility leveraging filter kernels as opposed to low pass filters.
Settings:
Signal Mode: Drop down to select the types of signals wanted
Tuning: Integer input to adjust signal's responsiveness. Lower inputs result in more frequent signals being produced.
Auto Maximizer Toggle: Automatically apply a backtested parameter to the signals
Dashboard Size: Drop down to select the size of the dashboard
Dashboard Position: Change the location of the dashboard on your chart
Additional Features: A set of toggles turning on/off these indicators.
Example Usecases:
Trend based confluences:
ChartPrime Oracle Plus provides classical (all be-it self optimizing) trend based signals. When trading, taking into consideration other forms of confluences are crucial. Take the image below:
Here we see the quantum reactor being green suggesting the market was in an upwards trend. We then see a sell signal appear. Knowing that we were in a macro uptrend allows us to filter out signals that go against this. Albeit basic; understanding multi-level confluence is key.
Features such as the Prime Ranges have duplicate usecases whereby a trend can be identified via the color of the bands as well as providing TP/SL levels. Considering these assisting features is vital before entering a trade.
Contrarian trading methodologies:
Commonly; trading with a trending market is most well known. However; markets are just as susceptible to ranging behaviors. ChartPrime has designed this toolkit to cater to most market conditions. For example, finding confluence between reversal indicators such as our contrarian signals and the Quantum Band can provide for some very strong confluence that can help a trader attempt to enter at bottoms of retracements and achieve the best possible entries or exits.
Developing confluences as shown above can be key to a trader's success. It is important to avoid biases when looking at indicators and view the market as objectively as possible.
ChartPrime believes that there is no magic indicator that is able to print money. Indicator toolkits provide value via their convenience, adaptability and uniqueness. Combining these items can help a trader make more educated; less messy, more planned trades and in turn hopefully help them succeed.
Risk Disclaimer
All content and developments created by ChartPrime are purely for informational & educational purposes only. Past performance does not guarantee future results. Suggested usecases are theoretical.
Script de pago

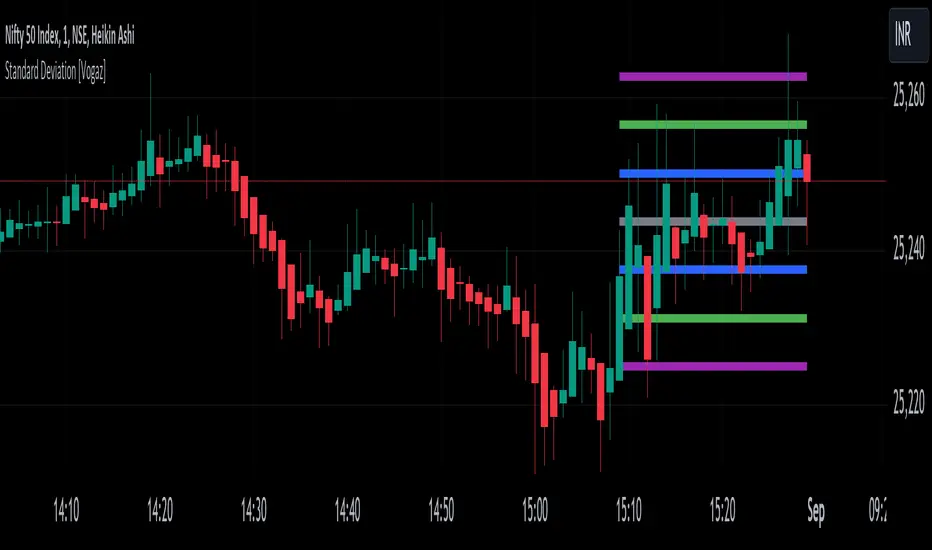
Standard Deviation [Vogaz]This Pine Script indicator provides a visualization of standard deviation bands plotted as fixed horizontal lines on the TradingView chart. The bands are based on the last candle's closing price and are designed to help traders identify potential volatility levels and deviations from the average price.
Features:
Standard Deviation Calculation: The indicator calculates standard deviation based on a user-defined length and source price. It then creates bands around the last candle's close price, showing potential ranges of price volatility.
Customizable Multipliers: You can adjust the multipliers for standard deviation levels (e.g., 1x, 2x, 3x) to set how far the bands are from the closing price.
Adjustable Line Thickness and Length: Customize the thickness and length of the horizontal lines. The lines extend backwards from the current bar to show the range over a user-defined number of bars.
Color Settings: Each band and the closing price line have configurable colors for better visual differentiation. You can set colors for:
Standard Deviation 1 Band (up and down)
Standard Deviation 2 Band (up and down)
Standard Deviation 3 Band (up and down)
Last Close Price Line
Inputs:
Length: Number of periods for calculating standard deviation.
Source: Price type used for standard deviation calculation (e.g., closing price).
StdDev Multipliers: Multipliers for different standard deviation bands.
Line Thickness: Thickness of the horizontal lines.
Line Length: Length of the lines extending from the current bar.
Line Colors: Colors for the bands and the last close price line.
Use Case:
This indicator is useful for traders who want to visualize price volatility and deviations around the last closing price. By analyzing these bands, traders can make informed decisions about potential price movements and market conditions.
How to Use:
Add the Indicator to Your Chart: Apply the indicator to your TradingView chart.
Adjust Settings: Modify the standard deviation multipliers, line thickness, and length according to your preferences.
Analyze the Bands: Use the bands to assess price volatility and identify potential trading signals.
Harmonic Rolling VWAP (Zeiierman)█ Overview
The Harmonic Rolling VWAP (Zeiierman) indicator combines the concept of the Rolling Volume Weighted Average Price (VWAP) with advanced harmonic analysis using Discrete Fourier Transform (DFT). This innovative indicator aims to provide traders with a dynamic view of price action, capturing both the volume-weighted price and underlying harmonic patterns. By leveraging this combination, traders can gain deeper insights into market trends and potential reversal points.
█ How It Works
The Harmonic Rolling VWAP calculates the rolling VWAP over a specified window of bars, giving more weight to periods with higher trading volume. This VWAP is then subjected to harmonic analysis using the Discrete Fourier Transform (DFT), which decomposes the VWAP into its frequency components.
Key Components:
Rolling VWAP (RVWAP): A moving average that gives more weight to higher volume periods, calculated over a user-defined window.
True Range (TR): Measures volatility by comparing the current high and low prices, considering the previous close price.
Discrete Fourier Transform (DFT): Analyzes the harmonic patterns within the RVWAP by decomposing it into its frequency components.
Standard Deviation Bands: These bands provide a visual representation of price volatility around the RVWAP, helping traders identify potential overbought or oversold conditions.
█ How to Use
Identify Trends: The RVWAP line helps in identifying the underlying trend by smoothing out short-term price fluctuations and focusing on volume-weighted prices.
Assess Volatility: The standard deviation bands around the RVWAP give a clear view of price volatility, helping traders identify potential breakout or breakdown points.
Find Entry and Exit Points: Traders can look for entries when the price is near the lower bands in an uptrend or near the upper bands in a downtrend. Exits can be considered when the price approaches the opposite bands or shows harmonic divergence.
█ Settings
VWAP Source: Defines the price data used for VWAP calculations. The source input defines the price data used for calculations. This setting affects the VWAP calculations and the resulting bands.
Window: Sets the number of bars used for the rolling calculations. The window input sets the number of bars used for the rolling calculations. A larger window smooths the VWAP and standard deviation bands, making the indicator less sensitive to short-term price fluctuations. A smaller window makes the indicator more responsive to recent price changes.
-----------------
Disclaimer
The information contained in my Scripts/Indicators/Ideas/Algos/Systems does not constitute financial advice or a solicitation to buy or sell any securities of any type. I will not accept liability for any loss or damage, including without limitation any loss of profit, which may arise directly or indirectly from the use of or reliance on such information.
All investments involve risk, and the past performance of a security, industry, sector, market, financial product, trading strategy, backtest, or individual's trading does not guarantee future results or returns. Investors are fully responsible for any investment decisions they make. Such decisions should be based solely on an evaluation of their financial circumstances, investment objectives, risk tolerance, and liquidity needs.
My Scripts/Indicators/Ideas/Algos/Systems are only for educational purposes!

Impulse Reactor RSI-SMA Trend Indicator [ApexLegion]Impulse Reactor RSI-SMA Trend Indicator
Introduction and Theoretical Background
Design Rationale
Standard indicators frequently generate binary 'BUY' or 'SELL' signals without accounting for the broader market context. This often results in erratic "Flip-Flop" behavior, where signals are triggered indiscriminately regardless of the prevailing volatility regime.
Impulse Reactor was engineered to address this limitation by unifying two critical requirements: Quantitative Rigor and Execution Flexibility.
The Solution
Composite Analytical Framework This script is not a simple visual overlay of existing indicators. It is an algorithmic synthesis designed to function as a unified decision-making engine. The primary objective was to implement rigorous quantitative analysis (Volatility Normalization, Structural Filtering) directly within an alert-enabled framework. This architecture is designed to process signals through strict, multi-factor validation protocols before generating real-time notifications, allowing users to focus on structurally validated setups without manual monitoring.
How It Works
This is not a simple visual mashup. It utilizes a cross-validation algorithm where the Trend Structure acts as a gatekeeper for Momentum signals:
Logic over Lag: Unlike simple moving average crossovers, this script uses a 15-layer Gradient Ribbon to detect "Laminar Flow." If the ribbon is knotted (Compression), the system mathematically suppresses all signals.
Volatility Normalization: The core calculation adapts to ATR (Average True Range). This means the indicator automatically expands in volatile markets and contracts in quiet ones, maintaining accuracy without constant manual tweaking.
Adaptive Signal Thresholding: It incorporates an 'Anti-Greed' algorithm (Dynamic Thresholding) that automatically adjusts entry criteria based on trend duration. This logic aims to mitigate the risk of entering positions during periods of statistical trend exhaustion.
Why Use It?
Market State Decoding: The gradient Ribbon visualizes the underlying trend phase in real-time.
◦ Cyan/Blue Flow: Strong Bullish Trend (Laminar Flow).
◦ Magenta/Pink Flow: Strong Bearish Trend.
◦ Compressed/Knotted: When the ribbon lines are tightly squeezed or overlapping, it signals Consolidation. The system filters signals here to avoid chop.
Noise Reduction: The goal is not to catch every pivot, but to isolate high-confidence setups. The logic explicitly filters out minor fluctuations to help maintain position alignment with the broader trend.
⚖️ Chapter 1: System Architecture
Introduction: Composite Analytical Framework
System Overview
Impulse Reactor serves as a comprehensive technical analysis engine designed to synthesize three distinct market dimensions—Momentum, Volatility, and Trend Structure—into a unified decision-making framework. Unlike traditional methods that analyze these metrics in isolation, this system functions as a central processing unit that integrates disparate data streams to construct a coherent model of market behavior.
Operational Objective
The primary objective is to transition from single-dimensional signal generation to a multi-factor assessment model. By fusing data from the Impulse Core (Volatility), Gradient Oscillator (Momentum), and Structural Baseline (Trend), the system aims to filter out stochastic noise and identify high-probability trade setups grounded in quantitative confluence.
Market Microstructure Analysis: Limitations of Conventional Models
Extensive backtesting and quantitative analysis have identified three critical inefficiencies in standard oscillator-based strategies:
• Bounded Oscillator Limitations (The "Oscillation Trap"): Traditional indicators such as RSI or Stochastics are mathematically constrained between fixed values (0 to 100). In strong trending environments, these metrics often saturate in "overbought" or "oversold" zones. Consequently, traders relying on static thresholds frequently exit structurally valid positions prematurely or initiate counter-trend trades against prevailing momentum, resulting in suboptimal performance.
• Quantitative Blindness to Quality: Standard moving averages and trend indicators often fail to distinguish the qualitative nature of price movement. They treat low-volume drift and high-velocity expansion identically. This inability to account for "Volatility Quality" leads to delayed responsiveness during critical market events.
• Fractal Dissonance (Timeframe Disconnect): Financial markets exhibit fractal characteristics where trends on lower timeframes may contradict higher timeframe structures. Manual integration of multi-timeframe analysis increases cognitive load and susceptibility to human error, often resulting in conflicting biases at the point of execution.
Core Design Principles
To mitigate the aforementioned systemic inefficiencies, Impulse Reactor employs a modular architecture governed by three foundational principles:
Principle A:
Volatility Precursor Analysis Market mechanics demonstrate that volatility expansion often functions as a leading indicator for directional price movement. The system is engineered to detect "Volatility Deviation" — specifically, the divergence between short-term and long-term volatility baselines—prior to its manifestation in price action. This allows for entry timing aligned with the expansion phase of market volatility.
Principle B:
Momentum Density Visualization The system replaces singular momentum lines with a "Momentum Density" model utilizing a 15-layer Simple Moving Average (SMA) Ribbon.
• Concept: This visualization represents the aggregate strength and consistency of the trend.
• Application: A fully aligned and expanded ribbon indicates a robust trend structure ("Laminar Flow") capable of withstanding minor counter-trend noise, whereas a compressed ribbon signals consolidation or structural weakness.
Principle C:
Adaptive Confluence Protocols Signal validity is strictly governed by a multi-dimensional confluence logic. The system suppresses signal generation unless there is synchronized confirmation across all three analytical vectors:
1. Volatility: Confirmed expansion via the Impulse Core.
2. Momentum: Directional alignment via the Hybrid Oscillator.
3. Structure: Trend validation via the Baseline. This strict filtering mechanism significantly reduces false positives in non-trending (choppy) environments while maintaining sensitivity to genuine breakouts.
🔍 Chapter 2: Core Modules & Algorithmic Logic
Module A: Impulse Core (Normalized Volatility Deviation)
Operational Logic The Impulse Core functions as a volatility-normalized momentum gauge rather than a standard oscillator. It is designed to identify "Volatility Contraction" (Squeeze) and "Volatility Expansion" phases by quantifying the divergence between short-term and long-term volatility states.
Volatility Z-Score Normalization
The formula implements a custom normalization algorithm. Unlike standard oscillators that rely on absolute price changes, this logic calculates the Z-Score of the Volatility Spread.
◦ Numerator: (atr_f - atr_s) captures the raw momentum of volatility expansion.
◦ Denominator: (std_f + 1e-6) standardizes this value against historical variance.
◦ Result: This allows the indicator scales consistently across assets (e.g., Bitcoin vs. Euro) without manual recalibration.
f_impulse() =>
atr_f = ta.atr(fastLen) // Fast Volatility Baseline
atr_s = ta.atr(slowLen) // Slow Volatility Baseline
std_f = ta.stdev(atr_f, devLen) // Volatility Standard Deviation
(atr_f - atr_s) / (std_f + 1e-6) // Normalized Differential Calculation
Algorithmic Framework
• Differential Calculation: The system computes the spread between a Fast Volatility Baseline (ATR-10) and a Slow Volatility Baseline (ATR-30).
• Normalization Protocol: To standardize consistency across diverse asset classes (e.g., Forex vs. Crypto), the raw differential is divided by the standard deviation of the volatility itself over a 30-period lookback.
• Signal Generation:
◦ Contraction (Squeeze): When the Fast ATR compresses below the Slow ATR, it registers a potential volatility buildup phase.
◦ Expansion (Release): A rapid divergence of the Fast ATR above the Slow ATR signals a confirmed volatility expansion, validating the strength of the move.
Module B: Gradient Oscillator (RSI-SMA Hybrid)
Design Rationale To mitigate the "noise" and "false reversal" signals common in single-line oscillators (like standard RSI), this module utilizes a 15-Layer Gradient Ribbon to visualize momentum density and persistence.
Technical Architecture
• Ribbon Array: The system generates 15 sequential Simple Moving Averages (SMA) applied to a volatility-adjusted RSI source. The length of each layer increases incrementally.
• State Analysis:
Momentum Alignment (Laminar Flow): When all 15 layers are expanded and parallel, it indicates a robust trend where buying/selling pressure is distributed evenly across multiple timeframes. This state helps filter out premature "overbought/oversold" signals.
• Consolidation (Compression): When the distance between the fastest layer (Layer 1) and the slowest layer (Layer 15) approaches zero or the layers intersect, the system identifies a "Non-Tradable Zone," preventing entries during choppy market conditions.
// Laminar Flow Validation
f_validate_trend() =>
// Calculate spread between Ribbon layers
ribbon_spread = ta.stdev(ribbon_array, 15)
// Only allow signals if Ribbon is expanded (Laminar Flow)
is_flowing = ribbon_spread > min_expansion_threshold
// If compressed (Knotted), force signal to false
is_flowing ? signal : na
Module C: Adaptive Signal Filtering (Behavioral Bias Mitigation)
This subsystem, operating as an algorithmic "Anti-Greed" Mechanism, addresses the statistical tendency for signal degradation following prolonged trends.
Dynamic Threshold Adjustment
• Win Streak Detection: The algorithm internally tracks the outcome of closed trade cycles.
• Sensitivity Multiplier: Upon detecting consecutive successful signals in the same direction, a Penalty_Factor is applied to the entry logic.
• Operational Impact: This effectively raises the Required_Slope threshold for subsequent signals. For example, after three consecutive bullish signals, the system requires a 30% steeper trend angle to validate a fourth entry. This enforces stricter discipline during extended trends to reduce the probability of entering at the point of trend exhaustion.
Anti-Greed Logic: Dynamic Threshold Calculation
f_adjust_threshold(base_slope, win_streak) =>
// Adds a 10% penalty to the difficulty for every consecutive win
penalty_factor = 0.10
risk_scaler = 1 + (win_streak * penalty_factor)
// Returns the new, harder-to-reach threshold
base_slope * risk_scaler
Module D: Trend Baseline (Triple-Smoothed Structure)
The Trend Baseline serves as the structural filter for all signals. It employs a Triple-Smoothed Hybrid Algorithm designed to balance lag reduction with noise filtration.
Smoothing Stages
1. Volatility Banding: Utilizes a SuperTrend-based calculation to establish the upper and lower boundaries of price action.
2. Weighted Filter: Applies a Weighted Moving Average (WMA) to prioritize recent price data.
3. Exponential Smoothing: A final Exponential Moving Average (EMA) pass is applied to create a seamless baseline curve.
Functionality
This "Heavy" baseline resists minor intraday volatility spikes while remaining responsive to sustained structural shifts. A signal is only considered valid if the price action maintains structural integrity relative to this baseline
🚦 Chapter 3: Risk Management & Exit Protocols
Quantitative Risk Management (TP/SL & Trailing)
Foundational Architecture: Volatility-Adjusted Geometry Unlike strategies relying on static nominal values, Impulse Reactor establishes dynamic risk boundaries derived from quantitative volatility metrics. This design aligns trade invalidation levels mathematically with the current market regime.
• ATR-Based Dynamic Bracketing:
The protocol calculates Stop-Loss and Take-Profit levels by applying Fibonacci coefficients (Default: 0.786 for SL / 1.618 for TP) to the Average True Range (ATR).
◦ High Volatility Environments: The risk bands automatically expand to accommodate wider variance, preventing premature exits caused by standard market noise.
◦ Low Volatility Environments: The bands contract to tighten risk parameters, thereby dynamically adjusting the Risk-to-Reward (R:R) geometry.
• Close-Validation Protocol ("Soft Stop"):
Institutional algorithms frequently execute liquidity sweeps—driving prices briefly below key support levels to accumulate inventory.
◦ Mechanism: When the "Soft Stop" feature is enabled, the system filters out intraday volatility spikes. The stop-loss is conditional; execution is triggered only if the candle closes beyond the invalidation threshold.
◦ Strategic Advantage: This logic distinguishes between momentary price wicks and genuine structural breakdowns, preserving positions during transient volatility.
• Step-Function Trailing Mechanism:
To protect unrealized PnL while allowing for normal price breathing, a two-phase trailing methodology is employed:
◦ Phase 1 (Activation): The trailing function remains dormant until the price advances by a pre-defined percentage threshold.
◦ Phase 2 (Dynamic Floor): Once armed, the stop level creates a moving floor, adjusting relative to price action while maintaining a volatility-based (ATR) buffer to systematically protect unrealized PnL.
• Algorithmic Exit Protocols (Dynamic Liquidity Analysis)
◦ Rationale: Inefficiencies of Static Targets Static "Take Profit" levels often result in suboptimal exits. They compel traders to close positions based on arbitrary figures rather than evolving market structure, potentially capping upside during significant trends or retaining positions while the underlying trend structure deteriorates.
◦ Solution: Structural Integrity Assessment The system utilizes a Dynamic Liquidity Engine to continuously audit the validity of the position. Instead of targeting a specific price point, the algorithm evaluates whether the trend remains statistically robust.
Multi-Factor Exit Logic (The Tri-Vector System)
The Smart Exit protocol executes only when specific algorithmic invalidation criteria are met:
• 1. Momentum Exhaustion (Confluence Decay): The system monitors a 168-hour rolling average of the Confluence Score. A significant deviation below this historical baseline indicates momentum exhaustion, signaling that the driving force behind the trend has dissipated prior to a price reversal. This enables preemptive exits before a potential drawdown.
• 2. Statistical Over-Extension (Mean Reversion): Utilizing the core volatility logic, the system identifies instances where price deviates beyond 2.0 standard deviations from the mean. While the trend may be technically bullish, this statistical anomaly suggests a high probability of mean reversion (elastic snap-back), triggering a defensive exit to capitalize on peak valuation.
• 3. Oscillator Rejection (Immediate Pivot): To manage sudden V-shaped volatility, the system monitors RSI pivots. If a sharp "Pivot High" or divergence is detected, the protocol triggers an immediate "Peak Exit," bypassing standard trend filters to secure liquidity during high-velocity reversals.
🎨 Chapter 4: Visualization Guide
Gradient Oscillator Ribbon
The 15-layer SMA ribbon visualized via plot(r1...r15) represents the "Momentum Density" of the market.
• Visuals:
◦ Cyan/Blue Ribbon: Indicates Bullish Momentum.
◦ Pink/Magenta Ribbon: Indicates Bearish Momentum.
• Interpretation:
◦ Laminar Flow: When the ribbon expands widely and flows in parallel, it signifies a robust trend where momentum is distributed evenly across timeframes. This is the ideal state for trend-following.
◦ Compression (Consolidation): If the ribbon becomes narrow, twisted, or knotted, it indicates a "Non-Tradable Zone" where the market lacks a unified direction. Traders are advised to wait for clarity.
◦ Over-Extension: If the top layer crosses the Overbought (85) or Oversold (15) lines, it visually warns of potential market overheating.
Trend Baseline
The thick, color-changing line plotted via plot(baseline) represents the Structural Backbone of the market.
• Visuals: Changes color based on the trend direction (Blue for Bullish, Pink for Bearish).
• Interpretation:
Structural Filter: Long positions are statistically favored only when price action sustains above this baseline, while short positions are favored below it.
Dynamic Support/Resistance: The baseline acts as a dynamic support level during uptrends and resistance during downtrends.
Entry Signals & Labels
Text labels ("Long Entry", "Short Entry") appear when the system detects high-probability setups grounded in quantitative confluence.
• Visuals: Labeled signals appear above/below specific candles.
• Interpretation:
These signals represent moments where Volatility (Expansion), Momentum (Alignment), and Structure (Trend) are synchronized.
Smart Exit: Labels such as "Smart Exit" or "Peak Exit" appear when the system detects momentum exhaustion or structural decay, prompting a defensive exit to preserve capital.
Dynamic TP/SL Boxes
The semi-transparent colored zones drawn via fill() represent the risk management geometry.
• Visuals: Colored boxes extending from the entry point to the Take Profit (TP) and Stop Loss (SL) levels.
• Function:
Volatility-Adjusted Geometry: Unlike static price targets, these boxes expand during high volatility (to prevent wicks from stopping you out) and contract during low volatility (to optimize Risk-to-Reward ratios).
SAR + MACD Glow
Small glowing shapes appearing above or below candles.
• Visuals: Triangle or circle glows near the price bars.
• Interpretation:
This visual indicates a secondary confirmation where Parabolic SAR and MACD align with the main trend direction. It serves as an additional confluence factor to increase confidence in the trade setup.
Support/Resistance Table
A small table located at the bottom-right of the chart.
• Function: Automatically identifies and displays recent Pivot Highs (Resistance) and Pivot Lows (Support).
• Interpretation: These levels can be used as potential targets for Take Profit or invalidation points for manual Stop Loss adjustments.
🖥️ Chapter 5: Dashboard & Operational Guide
Integrated Analytics Panel (Dashboard Overview)
To facilitate rapid decision-making without manual calculation, the system aggregates critical market dimensions into a unified "Heads-Up Display" (HUD). This panel monitors real-time metrics across multiple timeframes and analytical vectors.
A. Intermediate Structure (12H Trend)
• Function: Anchors the intraday analysis to the broader market structure using a 12-hour rolling window.
• Interpretation:
◦ Bullish (> +0.5%): Indicates a positive structural bias. Long setups align with the macro flow.
◦ Bearish (< -0.5%): Indicates structural weakness. Short setups are statistically favored.
◦ Neutral: Represents a ranging environment where the Confluence Score becomes the primary weighting factor.
B. Composite Confluence Score (Signal Confidence)
• Definition: A probability metric derived from the synchronization of Volatility (Impulse Core), Momentum (Ribbon), and Trend (Baseline).
• Grading Scale:
Strong Buy/Sell (> 7.0 / < 3.0): Indicates full alignment across all three vectors. Represents a "Prime Setup" eligible for standard position sizing.
Buy/Sell (5.0–7.0 / 3.0–5.0): Indicates a valid trend but with moderate volatility confirmation.
Neutral: Signals conflicting data (e.g., Bullish Momentum vs. Bearish Structure). Trading is not recommended ("No-Trade Zone").
C. Statistical Deviation Status (Mean Reversion)
• Logic: Utilizes Bollinger Band deviation principles to quantify how far price has stretched from the statistical mean (20 SMA).
• Alert States:
Over-Extended (> 2.0 SD): Warning that price is statistically likely to revert to the mean (Elastic Snap-back), even if the trend remains technically valid. New entries are discouraged in this zone.
Normal: Price is within standard distribution limits, suitable for trend-following entries.
D. Volatility Regime Classification
• Metric: Compares current ATR against a 100-period historical baseline to categorize the market state.
• Regimes:
Low Volatility (Lvl < 1.0): Market Compression. Often precedes volatility expansion events.
Mid Volatility (Lvl 1.0 - 1.5): Standard operating environment.
High Volatility (Lvl > 1.5): Elevated market stress. Risk parameters should be adjusted (e.g., reduced position size) to account for increased variance.
E. Performance Telemetry
• Function: Displays the historical reliability of the Trend Baseline for the current asset and timeframe.
• Operational Threshold: If the displayed Win Rate falls below 40%, it suggests the current market behavior is incoherent (choppy) and does not respect trend logic. In such cases, switching assets or timeframes is recommended.
Operational Protocols & Signal Decoding
Visual Interpretation Standards
• Laminar Flow (Trade Confirmation): A valid trend is visually confirmed when the 15-layer SMA Ribbon is fully expanded and parallel. This indicates distributed momentum across timeframes.
• Consolidation (No-Trade): If the ribbon appears twisted, knotted, or compressed, the market lacks a unified directional vector.
• Baseline Interaction: The Triple-Smoothed Baseline acts as a dynamic support/resistance filter. Long positions remain valid only while price sustains above this structure.
System Calibration (Settings)
• Adaptive Signal Filtering (Prev. Anti-Greed): Enabled by default. This logic automatically raises the required trend slope threshold following consecutive wins to mitigate behavioral bias.
• Impulse Sensitivity: Controls the reactivity of the Volatility Core. Higher settings capture faster moves but may introduce more noise.
⚙️ Chapter 6: System Configuration & Alert Guide
This section provides a complete breakdown of every adjustable setting within Impulse Reactor to assist you in tailoring the engine to your specific needs.
🌐 LANGUAGE SETTINGS (Localization)
◦ Select Language (Default: English):
Function: Instantly translates all chart labels, dashboard texts into your preferred language.
Supported: English, Korean, Chinese, Spanish
⚡ IMPULSE CORE SETTINGS (Volatility Engine)
◦ Deviation Lookback (Default: 30): The period used to calculate the standard deviation of volatility.
Role: Sets the baseline for normalizing momentum. Higher values make the core smoother but slower to react.
◦ Fast Pulse Length (Default: 10): The short-term ATR period.
Role: Detects rapid volatility expansion.
◦ Slow Pulse Length (Default: 30): The long-term ATR baseline.
Role: Establishes the background volatility level. The core signal is derived from the divergence between Fast and Slow pulses.
🎯 TP/SL SETTINGS (Risk Management)
◦ SL/TP Fibonacci (Default: 0.786 / 1.618): Selects the Fibonacci ratio used for risk calculation.
◦ SL/TP Multiplier (Default: 1.5 / 2): Applies a multiplier to the ATR-based bands.
Role: Expands or contracts the Take Profit and Stop Loss boxes. Increase these values for higher volatility assets (like Altcoins) to avoid premature stop-outs.
◦ ATR Length (Default: 14): The lookback period for calculating the Average True Range used in risk geometry.
◦ Use Soft Stop (Close Basis):
Role: If enabled, Stop Loss alerts only trigger if a candle closes beyond the invalidation level. This prevents being stopped out by wick manipulations.
🔊 RIBBON SETTINGS (Momentum Visualization)
◦ Show SMA Ribbon: Toggles the visibility of the 15-layer gradient ribbon.
◦ Ribbon Line Count (Default: 15): The number of SMA lines in the ribbon array.
◦ Ribbon Start Length (Default: 2) & Step (Default: 1): Defines the spread of the ribbon.
Role: Controls the "thickness" of the momentum density visualization. A wider step creates a broader ribbon, useful for higher timeframes.
📎 DISPLAY OPTIONS
◦ Show Entry Lines / TP/SL Box / Position Labels / S/R Levels / Dashboard: Toggles individual visual elements on the chart to reduce clutter.
◦ Show SAR+MACD Glow: Enables the secondary confirmation shapes (triangles/circles) above/below candles.
📈 TREND BASELINE (Structural Filter)
◦ Supertrend Factor (Default: 12) & ATR Period (Default: 90): Controls the sensitivity of the underlying Supertrend algorithm used for the baseline calculation.
◦ WMA Length (40) & EMA Length (14): The smoothing periods for the Triple-Smoothed Baseline.
◦ Min Trend Duration (Default: 10): The minimum number of bars the trend must be established before a signal is considered valid.
🧠 SMART EXIT (Dynamic Liquidity)
◦ Use Smart Exit: Enables the momentum exhaustion logic.
◦ Exit Threshold Score (Default: 3): The sensitivity level for triggering a Smart Exit. Lower values trigger earlier exits.
◦ Average Period (168) & Min Hold Bars (5): Defines the rolling window for momentum decay analysis and the minimum duration a trade must be held before Smart Exit logic activates.
🛡️ TRAILING STOP (Step)
◦ Use Trailing Stop: Activates the step-function trailing mechanism.
◦ Step 1 Activation % (0.5) & Offset % (0.5): The price must move 0.5% in your favor to arm the first trail level, which sets a stop 0.5% behind price.
◦ Step 2 Activation % (1) & Offset % (0.2): Once price moves 1%, the trail tightens to 0.2%, securing the position.
🌀 SAR & MACD SETTINGS (Secondary Confirmation)
◦ SAR Start/Increment/Max: Standard Parabolic SAR parameters.
◦ SAR Score Scaling (ATR): Adjusts how much weight the SAR signal has in the overall confluence score.
◦ MACD Fast/Slow/Signal: Standard MACD parameters used for the "Glow" signals.
🔄 ANTI-GREED LOGIC (Behavioral Bias)
◦ Strict Entry after Win: Enables the negative feedback loop.
◦ Strict Multiplier (Default: 1.1): Increases the entry difficulty by 10% after each win.
Role: Prevents overtrading and entering at the top of an extended trend.
🌍 HTF FILTER (Multi-Timeframe)
◦ Use Auto-Adaptive HTF Filter: Automatically selects a higher timeframe (e.g., 1H -> 4H) to filter signals.
◦ Bypass HTF on Steep Trigger: Allows an entry even against the HTF trend if the local momentum slope is exceptionally steep (catch powerful reversals).
📉 RSI PEAK & CHOPPINESS
◦ RSI Peak Exit (Instant): Triggers an immediate exit if a sharp RSI pivot (V-shape) is detected.
◦ Choppiness Filter: Suppresses signals if the Choppiness Index is above the threshold (Default: 60), indicating a flat market.
📐 SLOPE TRIGGER LOGIC
◦ Force Entry on Steep Slope: Overrides other filters if the price angle is extremely vertical (high velocity).
◦ Slope Sensitivity (1.5): The angle required to trigger this override.
⛔ FLAT MARKET FILTER (ADX & ATR)
◦ Use ADX Filter: Blocks signals if ADX is below the threshold (Default: 20), indicating no trend.
◦ Use ATR Flat Filter: Blocks signals if volatility drops below a critical level (dead market).
🔔 Alert Configuration Guide
Impulse Reactor is designed with a comprehensive suite of alert conditions, allowing you to automate your trading or receive real-time notifications for specific market events.
How to Set Up:
Click the "Alert" (Clock) icon in the TradingView toolbar.
Select "Impulse Reactor " from the Condition dropdown.
Choose one of the specific trigger conditions below:
🚀 Entry Signals (Trend Initiation)
Long Entry:
Trigger: Fires when a confirmed Bullish Setup is detected (Momentum + Volatility + Structure align).
Usage: Use this to enter new Long positions.
Short Entry:
Trigger: Fires when a confirmed Bearish Setup is detected.
Usage: Use this to enter new Short positions.
🎯 Profit Taking (Target Levels)
Long TP:
Trigger: Fires when price hits the calculated Take Profit level for a Long trade.
Usage: Automate partial or full profit taking.
Short TP:
Trigger: Fires when price hits the calculated Take Profit level for a Short trade.
Usage: Automate partial or full profit taking.
🛡️ Defensive Exits (Risk Management)
Smart Exit:
Trigger: Fires when the system detects momentum decay or statistical exhaustion (even if the trend hasn't fully reversed).
Usage: Recommended for tightening stops or closing positions early to preserve gains.
Overbought / Oversold:
Trigger: Fires when the ribbon extends into extreme zones.
Usage: Warning signal to prepare for a potential reversal or pullback.
💡 Secondary Confirmation (Confluence)
SAR+MACD Bullish:
Trigger: Fires when Parabolic SAR and MACD align bullishly with the main trend.
Usage: Ideal for Pyramiding (adding to an existing winning position).
SAR+MACD Bearish:
Trigger: Fires when Parabolic SAR and MACD align bearishly.
Usage: Ideal for adding to short positions.
⚠️ Chapter 7: Conclusion & Risk Disclosure
Methodological Synthesis
Impulse Reactor represents a shift from reactive price tracking to proactive energy analysis. By decomposing market activity into its atomic components — Volatility, Momentum, and Structure — and reconstructing them into a coherent decision model, the system aims to provide a quantitative framework for market engagement. It is designed not to predict the future, but to identify high-probability conditions where kinetic energy and trend structure align.
Disclaimer & Risk Warnings
◦ Educational Purpose Only
This indicator, including all associated code, documentation, and visual outputs, is provided strictly for educational and informational purposes. It does not constitute financial advice, investment recommendations, or a solicitation to buy or sell any financial instruments.
◦ No Guarantee of Performance
Past performance is not indicative of future results. All metrics displayed on the dashboard (including "Win Rate" and "P&L") are theoretical calculations based on historical data. These figures do not account for real-world trading factors such as slippage, liquidity gaps, spread costs, or broker commissions.
◦ High-Risk Warning
Trading cryptocurrencies, futures, and leveraged financial products involves a substantial risk of loss. The use of leverage can amplify both gains and losses. Users acknowledge that they are solely responsible for their trading decisions and should conduct independent due diligence before executing any trades.
◦ Software Limitations
The software is provided "as is" without warranty. Users should be aware that market data feeds on analysis platforms may experience latency or outages, which can affect signal generation accuracy.

Investor Tool - Z ScoreThe Investor Tool is intended as a tool for long term investors, indicating periods where prices are likely approaching cyclical tops or bottoms. The tool uses two simple moving averages of price as the basis for under/overvalued conditions: the 2-year MA (green) and a 5x multiple of the 2-year MA (red).
Price trading below the 2-year MA has historically generated outsized returns, and signalled bear cycle lows.
Price trading above the 2-year MA x5 has been historically signalled bull cycle tops and a zone where investors de-risk.
Just like the Glassnode one, but here on TV and with StDev bands
Now with Z-SCORE calculation:
The Z-Score is calculated to be -3 Z at the bottom bands and 3 Z at the top bands
mean = (upper_sma + bottom_sma) / 2
bands_range = upper_sma - bottom_sma
stdDev = bands_range != 0 ? bands_range / 6 : 0
zScore = stdDev != 0 ? (close - mean) / stdDev : 0
Created for TRW
Fibonacci & Volume Bell CurveBell Curve + Fibonacci Retracement
This custom indicator combines Fibonacci retracement levels with volume-weighted statistics (VWAP Bell Curve) to provide high-probability trading signals.
Indicator Components:
Fibonacci Retracement
Key Level Used:
Cyan (61.8%) – Golden Ratio: Most significant for identifying potential reversals.
Volume-Weighted Bell Curve (VWAP Bands)
White Line – VWAP (Volume Weighted Average Price).
Orange Bands (±2σ) – Represent two standard deviations above and below VWAP. Indicates the range where approximately 95% of volume-weighted price action occurs.
Trading Strategies:
Support & Resistance Trading
Fibonacci levels act as dynamic support/resistance.
The 61.8% level is especially effective for spotting reversal opportunities.
VWAP Mean Reversion
When price moves outside the ±2σ orange bands, expect a reversion back to the white VWAP line.
High-probability trades occur when price is extended to extremes.
Confluence Trading (High-Probability Setups). Strongest signals occur when Fibonacci levels align with VWAP bands. Look for overlap between Fib levels and VWAP support/resistance zones.
Pro Tips for Best Results:
Volume Confirmation: Look for increased volume at key levels for stronger signals.
Timeframes: Effective on all timeframes; higher timeframes offer more reliable signals.
Market Context: Always consider overall market direction and news events.
Multiple Touches: Levels become more valid when tested multiple times.
My settings:
Fibonacci Settings
Lookback Period: 50
Swing Detection Sensitivity: 5
Show Fibonacci Labels: ✅ Enabled
Bell Curve (VWAP Bands) Settings
Bell Curve Period: 100
VWAP Source: (H + L + C) / 3 (typical price)
Show Bell Curve Bands: ✅ Enabled
Confidence Levels: 2 Standard Deviations (±2σ)
Visual Settings
Fibonacci Line Width: 2
Bell Curve Line Width: 2
Extend Lines Right: ✅ Enabled
Fibonacci Levels
61.8% – ✅ Enabled, Color: Bright Blue
Other levels are disabled
VWAP & Bell Curve Bands
VWAP (White Line) – ✅ Enabled
Upper 1 SD – ✅ Enabled, Color: Gray
Lower 1 SD – ✅ Enabled, Color: Gray
Upper 2 SD – ✅ Enabled, Color: Orange-Red (with transparency)
Lower 2 SD – ✅ Enabled, Color: Orange-Red (with transparency)

Daily ATR Bonanza: Expected Moves - Tr33man Daily ATR Bonanza: Expected Moves
Overview 🤷♂️
The Daily ATR Bonanza script is a powerful trading tool designed to help traders visualize and understand potential price movements using the Average True Range (ATR). It provides daily and weekly ATR levels, historical statistics, and conditional probability analysis to give traders actionable insights. The script also plots the daily Keltner channel. This script is ideal for traders who want to gauge volatility, identify key levels, and make data-driven decisions.
b]Key Features:
📈 1. Daily and Weekly ATR Levels
🔵ATR Levels: The script calculates and displays ATR-based levels for the day and week. These levels are derived from the previous day's or week's close price and are adjusted using customizable multipliers (0.5x, 1x, and 1.5x by default).
🔵You can choose the number of ATR levels (1, 2, or 3) and adjust the multipliers to suit your trading strategy.
🌐 2. ATR Bands (Keltner Channels)
🔵The script includes an option to display ATR Bands, which are volatility-based envelopes around a moving average. These bands help identify overbought and oversold conditions.
🔵You can adjust the ATR multiplier and the length of the moving average used for the bands.
🧮 3. Historical Statistics and Conditional Probability
🔵 Historical Analysis: The script analyzes historical price movements to calculate the likelihood of closing at certain ATR levels.
🔵 Conditional Probability: This feature shows the probability of the price reaching specific ATR levels given the current market conditions. The conditional matches historical data by an open in the same opening ATR bucket, as well as the current price bucket having been visited in the historical case. Conditional probabilities are just statistics, and do not predict anything.
Data Table: 📚
🔵 Historical Close Probability: The percentage of days the price closed within each ATR level.
🔵 Conditional Close Probability: The likelihood of the price closing within each ATR level today.
❓ What is Conditional Probability? ❓
Conditional probability is a statistical measure that calculates the likelihood of an event occurring given that another event has already occurred. In this script, it is used to determine the probability of the price reaching specific ATR levels based on the current opening range as well as current ATR distance from the previous close.
For example:
If the market opens near the lower end of the first ATR level, the script calculates the likelihood of the price reaching the upper end of the first, second, or third ATR level.
This analysis is based on historical data, making it a powerful tool for understanding potential price movements.
🌟 Understanding the Levels
🔵Daily Levels: These are based on the previous day's close price and ATR. They are updated at the start of each new day.
🔵Weekly Levels: These are based on the previous week's close price and ATR. They are updated at the start of each new week.
🔵ATR Bands: These are dynamic levels that adjust with market volatility.
🔬 Analyze the Statistics (Daily only for now, no weekly yet)
🔵Use the interactive table to understand historical probabilities and conditional probabilities.
🔵Focus on the current opening range and the likelihood of reaching specific levels.
🧠 Make Trading Decisions
🔵Use the ATR levels and bands to identify key support and resistance levels.
🔵Use the conditional probability table to gauge the likelihood of reaching specific targets.
🔵Adjust your strategy based on the historical performance of the market.
Example Use Cases
1. Day Trading
Use the daily ATR levels to set intraday targets and stop-loss levels.
Monitor the conditional probability table to adjust your expectations based on the opening range.
2. Swing Trading
Use the weekly ATR levels to identify longer-term support and resistance levels.
3. Scalping
Use the ATR bands to identify overbought and oversold conditions.
Use the conditional probability table to quickly assess the likelihood of price movements.

Half-Trend Channel [BigBeluga]Half Trend Channel is a powerful trend-following indicator designed to identify trend direction, fakeouts, and potential reversal points. The combination of upper/lower bands, midline coloring, and specific signals makes it ideal for spotting trend continuation and market reversals.
The base of the channel is calculated using smoothed half-trend logic.
// Initialize half trend on the first bar
if barstate.isfirst
hl_t := close
// Update half trend value based on conditions
switch
closeMA < hl_t and highestHigh < hl_t => hl_t := highestHigh
closeMA > hl_t and lowestLow > hl_t => hl_t := lowestLow
=> hl_t := hl_t
// Smooth
float s_hlt = ta.hma(hl_t, len)
🔵 Key Features:
Upper and Lower Bands:
The bands adapt dynamically to market volatility.
Price movements toward the bands help identify areas of overextension and potential reversal points.
Midline Trend Signal:
The midline changes color to reflect the current trend:
Green Midline: Indicates an uptrend.
Purple Midline: Signals a downtrend.
Fakeout Signals ("X"):
"X" markers appear when price briefly breaches the outer bands but fails to sustain the move.
Fakeouts help traders identify areas where price momentum weakens.
Reversal Signals (Triangles):
Triangles (▲ and ▼) mark potential tops and bottoms:
▲ Up Triangles: Suggest a potential bottom and a reversal to the upside.
▼ Down Triangles: Indicate a potential top and a reversal to the downside.
Dynamic Trend Labels:
At the last bar, the indicator displays labels like "Trend Up" or "Trend Dn" , reflecting the current trend direction.
🔵 Usage:
Use the colored midline to determine the overall trend direction.
Monitor "X" fakeout signals to spot failed breakouts or momentum exhaustion near the bands.
Watch for reversal triangles (▲ and ▼) to identify potential trend reversals at tops or bottoms.
Combine the bands and midline signals to confirm trade entries and exits:
Enter long trades when price bounces off the lower band with a green midline.
Consider short trades when price reverses from the upper band with a purple midline.
Use the trend label (e.g., "Trend Up" or "Trend Dn") for quick confirmation of the current market state.
The Half Trend Channel is an essential tool for traders who want to follow trends, avoid fakeouts, and identify reliable tops and bottoms to optimize their trading decisions.

Volatility Signaling 50SMAOverview of the Script:
The script implements a volatility signaling indicator using a 50-period Simple Moving Average (SMA). It incorporates Bollinger Bands and the Average True Range (ATR) to dynamically adjust the SMA's color based on volatility conditions. Here's a detailed breakdown:
Components of the Script:
1. Inputs:
The script allows the user to customize key parameters for flexibility:
Bollinger Bands Length (length): Determines the period for calculating the Bollinger Bands.
Source (src): The price data to use, defaulting to the closing price.
Standard Deviation Multiplier (mult): Scales the Bollinger Bands' width.
ATR Length (atrLength): Sets the period for calculating the ATR.
The 50-period SMA length (smaLength) is fixed at 50.
2. Bollinger Bands Calculation:
Basis: Calculated as the SMA of the selected price source over the specified length.
Upper and Lower Bands: Determined by adding/subtracting a scaled standard deviation (dev) from the basis.
3. ATR Calculation:
Computes the Average True Range over the user-defined atrLength.
4. Volatility-Based Conditions:
The script establishes thresholds for Bollinger Band width relative to ATR:
Yellow Condition: When the band width (upper - lower) is less than 1.25 times the ATR.
Orange Condition: When the band width is less than 1.5 times the ATR.
Red Condition: When the band width is less than 1.75 times the ATR.
5. Dynamic SMA Coloring:
The 50-period SMA is colored based on the above conditions:
Yellow: Indicates relatively low volatility.
Orange: Indicates moderate volatility.
Red: Indicates higher volatility.
White: Default color when no conditions are met.
6. Plotting the 50-Period SMA:
The script plots the SMA (sma50) with a dynamically assigned color, enabling visual analysis of market conditions.
Use Case:
This script is ideal for traders seeking to assess market volatility and identify changes using Bollinger Bands and ATR. The colored SMA provides an intuitive way to gauge market dynamics directly on the chart.
Example Visualization:
Yellow SMA: The market is in a low-volatility phase.
Orange SMA: Volatility is picking up but remains moderate.
Red SMA: Higher volatility, potentially signaling significant market activity.
White SMA: Neutral/default state.

Triple VWAP: Anchored# Triple VWAP: Anchored + Last 2 Sessions
## 📊 Overview
**Triple VWAP** is a professional-grade Volume Weighted Average Price (VWAP) indicator designed for serious traders who need multi-timeframe volume analysis on a single chart. This indicator combines three powerful VWAP calculations: a custom **Anchored VWAP** from any historical date, a real-time **Current Session VWAP**, and **Previous Session VWAP** reference levels—all with configurable standard deviation bands.
Perfect for intraday traders, swing traders, and institutional-level analysis on Indian markets (Nifty, BankNifty) and global instruments.
***
## ✨ Key Features
### 🎯 Three Independent VWAP Calculations
**📍 Anchored VWAP (Long-term Reference)**
- Anchor VWAP from any specific date and time (year, month, day, hour, minute)
- Ideal for tracking price action from significant market events, earnings, or trend reversals
- Maintains accumulation from your chosen anchor point throughout the entire timeframe
**📅 Current Session VWAP (Real-Time)**
- Automatically resets at the start of each trading day
- Calculates dynamically as new bars form during the session
- Shows institutional trading levels and intraday fair value
**📆 Previous Session VWAP (Reference Levels)**
- Displays yesterday's final VWAP as horizontal reference lines
- Helps identify support/resistance zones from prior session
- Useful for gap analysis and opening range strategies
### 📐 Standard Deviation Bands
Each VWAP calculation includes optional standard deviation bands:
- **±1 SD** - Identifies normal price deviation zones
- **±2 SD** - Marks extreme price movements (high probability reversal zones)
- **±3 SD** - Ultra-extreme levels (rare price extensions)
Configure which SD levels to display for each VWAP type independently.
### 🎨 Customizable Visual Settings
- **Independent Color Schemes**: Assign unique colors to each VWAP type and its SD bands
- **Adjustable Line Widths**: Configure VWAP and SD line thickness (1-5 for VWAP, 1-3 for SD)
- **Plot Styles**: Previous session plots use cross-style for clear differentiation from real-time plots
- **Background Zones**: Optional colored zones when price extends beyond ±2 SD levels
- **Session Labels**: Automatic date labels marking each VWAP anchor point
### 📊 Information Dashboard
Real-time statistics table displaying:
- Current VWAP values for all three calculations
- Live standard deviation values
- ±1 SD levels for quick reference
- Distance from price to each VWAP (percentage format)
- Session tracking counter
- Color-coded proximity indicators
***
## 🔧 How to Use
### For Intraday Trading
1. **Current Session VWAP** acts as dynamic support/resistance—price above VWAP indicates bullish bias, below indicates bearish bias
2. Use **±1 SD bands** for profit targets and stop-loss placement
3. **±2 SD touches** often signal mean reversion opportunities
4. **Previous Session VWAP** provides overnight gap reference levels
### For Swing Trading
1. **Anchored VWAP** from significant events (breakouts, earnings, trend changes) shows institutional cost basis
2. Price trading consistently above/below anchored VWAP confirms trend strength
3. SD band rejections provide high-probability entry zones
### For Multi-Timeframe Analysis
1. Combine all three VWAPs to identify confluence zones
2. When current session VWAP aligns with previous session and anchored VWAP, expect strong support/resistance
3. Monitor distance percentage to gauge overextension
***
## ⚙️ Input Parameters
**📍 Anchored VWAP Configuration**
- `Enable Anchored VWAP` - Toggle on/off
- `Year, Month, Day, Hour, Minute` - Set your custom anchor point (requires confirmation)
**📅 Session VWAP Toggles**
- `Enable Current Session VWAP` - Toggle real-time daily VWAP
- `Enable Previous Session VWAP` - Toggle yesterday's reference VWAP
**General Settings**
- `VWAP Source` - Choose calculation source (default: HLC3)
- `Show ±1/2/3 SD` - Enable/disable each standard deviation level
**Visual Customization**
- Individual color pickers for each VWAP type and SD bands
- Line width adjustments
- `Show VWAP Labels` - Date labels at anchor points
- `Show Info Table` - Statistics dashboard toggle
- `Show SD Zones` - Background coloring beyond ±2 SD
***
## 💡 Trading Applications
✅ **Mean Reversion Trades**: Enter when price touches ±2 SD with reversal confirmation
✅ **Trend Following**: Trade in direction when price holds above/below VWAP
✅ **Institutional Levels**: Anchored VWAP reveals where large players accumulated positions
✅ **Gap Trading**: Use previous session VWAP to gauge gap fill probability
✅ **Volume Profile Analysis**: VWAP represents fair value based on actual volume traded
✅ **Support/Resistance Confluence**: Multiple VWAP alignment creates high-probability zones
***
## 🎓 Understanding VWAP
VWAP is the average price weighted by volume—representing the true average price paid by all market participants during a specific period. Unlike simple moving averages, VWAP gives more weight to price levels with higher trading volume, making it particularly valuable for:
- Institutional traders executing large orders
- Algorithmic trading systems
- Identifying fair value and overextended prices
- Minimizing market impact on large trades
***
## 📈 Chart Setup Recommendations
**Best Timeframes**: 1-minute to 15-minute charts for intraday; 1-hour to 4-hour for swing trading
**Compatible Markets**: Stocks, Indices (Nifty 50, Bank Nifty), Futures, Forex, Crypto
**Session Settings**: Works with standard daily sessions; automatically detects trading days (not calendar days)
***
## 🚀 What Makes This Indicator Unique
Unlike standard VWAP indicators that only show current session data, **Triple VWAP** provides:
- **Multi-session analysis** on a single chart without clutter
- **Historical anchoring** capability for event-driven analysis
- **Professional-grade statistics** dashboard
- **Independent customization** for each VWAP type
- **Optimized calculations** for real-time performance
***
## ⚠️ Important Notes
- **Anchored VWAP** requires manual date input (use significant market events like breakouts, earnings, trend reversals)
- **Session detection** based on daily timeframe changes—works on all chart timeframes
- **Previous Session VWAP** displays as static horizontal lines (reference only, not recalculated)
- **Standard Deviations** calculated using volume-weighted variance formula
- Works best on instruments with **consistent volume data**
***
## 📝 Credits & License
This indicator is published under **TradingView House Rules**. Code is original and follows Pine Script v6 best practices for performance and maintainability.
***
## 🤝 Support & Feedback
If you find this indicator valuable, please:
- ⭐ **Like** this publication
- 💬 **Comment** with your feedback or questions
- 🔔 **Follow** for updates and new releases
***
**Disclaimer**: This indicator is for educational and informational purposes only. Past performance does not guarantee future results. Always use proper risk management and combine with your own analysis before making trading decisions.
***

KSL-Fullsystem V2.0Trend Following & Reversal Trading System. It combines **Price Action (Market Structure)** with multiple technical indicators to generate high-quality Buy and Sell signals.
---
1. How Signals are Generated (The Core Logic)
The script uses **"Internal Shifts"** (Market Structure Breaks) to find entry points.
* BUY Signal: The price breaks above a previous bearish structure (Higher High) + All enabled filters are Green.
* SELL Signal: The price breaks below a previous bullish structure (Lower Low) + All enabled filters are Red.
When a signal occurs, the script automatically calculates:
* Stop Loss (SL): Based on the recent Swing High/Low.
* Take Profit (TP): Three levels (TP1, TP2, TP3) based on risk-reward ratios (1.5x, 2.0x, 3.0x).
---
2. The Filters (Your Confirmation Checklist)
You can turn these On/Off in the settings. **Note:** If you turn *all* of them on, you might get very few signals because the conditions become too strict.
**A. Bollinger Bands (BB) Filters (Primary Feature)**
This is the main filter for this version.
* Squeeze Filter: Prevents trading when the bands are too narrow (low volatility). If the background turns **Yellow**, it means the market is "Squeezing" – **Do Not Trade.**
* Touch Entry: Looks for price bouncing off the Lower Band (Buy) or Upper Band (Sell).
* Breakout Entry: Looks for price blasting through the bands.
* Mean Reversion: Checks if price is reverting to the middle line (Basis).
**B. Moving Average Filters (Trend)**
The script includes three types of Moving Averages. You can choose which style suits you:
* EMA (Exponential): Fast-reacting. Good for scalping.
* SMA (Simple): Standard trend lines. Good for position trading.
* LWMA (Linear Weighted): Focuses heavily on recent data.
* Configuration: You can select specific setups like "Scalping" (9/21/50 EMA) or "Trend" (50/200 EMA).
**C. Momentum Filters**
* MACD: Checks momentum. You can choose settings for Scalping, Day Trading, or Swing Trading.
* AO (Awesome Oscillator) & AC: Helps confirm if the momentum is strong enough to support the trend.
---
**3. Visual Guide: What You See on the Chart**
* Green Box: A Buy Zone (Demand).
* Red Box: A Sell Zone (Supply).
* Labels (Text): Shows "BUY" or "SELL" with exact prices for TP1, TP2, TP3, and SL.
* Blue Lines: The Bollinger Bands (Upper and Lower).
* Orange Line: The Bollinger Band Basis (Middle).
* Small Triangles:
* Green Triangle (Below Bar): Price touched the Lower Bollinger Band.
* Red Triangle (Above Bar): Price touched the Upper Bollinger Band.
* Yellow Background: **WARNING.** The market has low volume/volatility (BB Squeeze). Wait for a breakout.
---
4. How to Use This Script
1. Select Your Style: Go to the Settings (Inputs).
* If you are a **Scalper**, turn on "Scalping EMA" or "Scalping MACD".
* If you are a **Swing Trader**, turn on "Swing SMA" or "Trend EMA".
2. Configure Bollinger Bands: Keep `Use Bollinger Bands Filter` checked. Decide if you want to trade "Squeezes" (usually safer to avoid them).
3. Wait for the Label: Do not enter blindly. Wait for the script to print a **BUY** or **SELL** label with the TP/SL targets.
4. Check the Background: If the background is **Yellow**, ignore the signal or wait until the color clears.
5. Manage Risk: Place your Stop Loss at the price shown on the label ("SL").

FeraTrading Compression Flow v1🧠 Overview:
The FeraTrading Compression Flow v1 identifies moments in the market where volatility contracts and directional momentum builds beneath the surface. It detects when price compresses into a tight range, then confirms when momentum, volatility, and trend alignment combine to signal a high-probability breakout. Once all conditions are met, the indicator activates a persistent directional bias, shown visually with colored dynamic bands.
This isn’t just another squeeze or Bollinger-style compression indicator—it adds multi-layered confirmation logic and unique bias persistence mechanics, helping traders stay aligned with trend-based breakout phases rather than just spotting volatility drops.
⚙️ How It Works:
🔹 Volatility Compression Detection:
Uses a relative ATR filter to detect when the market is in contraction.
Compares short-term range behavior to a longer-term average using a customizable multiplier.
Avoids standard band-width logic (like BB/KC), instead relying on raw candle volatility for more adaptive compression detection.
🔹 Breakout Confirmation Logic:
A breakout is confirmed only when all of the following align:
Strong Candle Body: Filters out indecision bars and ensures clear directional intent.
EMA Trend Structure: Fast EMA must be properly aligned with the slow EMA, and price must close beyond the fast EMA in the breakout direction.
Range Burst: Breakout candle must exceed historical range norms, confirming an actual volatility expansion—not a false breakout.
Each layer is required—no single condition is enough—creating a highly selective confirmation system that filters out noise.
🔹 Bias Persistence Mechanism:
Once a valid breakout is confirmed, the script activates a persistent directional bias (bullish or bearish).
The bias does not flip unless an opposing breakout confirms.
This eliminates premature resets and allows traders to hold trend alignment visually until true reversal conditions are met.
🎨 Visual Behavior:
📈 Band Calculations:
Bands are drawn using smoothed highs and lows, plus or minus a scaled ATR-based buffer.
They adjust dynamically to both price scale and volatility, expanding and contracting naturally with the market.
🎨 Band Coloring:
Green bands = Bullish breakout confirmed
Red bands = Bearish breakout confirmed
No color = Compression detected, but no directional breakout yet
These are not support/resistance levels. They are momentum flow visualizations, providing a clean, unobtrusive way to track trend phases post-compression.
💡 What Makes It Unique:
Multi-confirmation logic: Combines compression, candle strength, trend direction, and volatility surge into one system.
Bias memory: Maintains directional bias until structurally invalidated—not just until the next indecisive bar.
Volatility-scaled bands: Makes this system flexible across all assets and timeframes, without constant tweaking.
No lagging oscillators: Instead of using MACD/RSI, it reads real-time momentum through body-to-range relationships and EMA stacking.
Minimal input, maximum output: With only two adjustable inputs, the script remains simple to deploy while offering deep contextual information.
✅ How to Use It:
Add the indicator to any chart (15m and lower preferred).
Watch for band color changes:
Green = Bullish breakout phase
Red = Bearish breakout phase
Use band direction as a trend alignment filter.
Avoid trading against active bias unless part of a confirmed reversal setup.
Adjust the Input Multiplier to fine-tune compression strictness (lower = stricter, higher = more permissive).
This indicator is especially useful following periods of consolidation and works well when layered with structure, supply/demand zones, or volume overlays.
💎 Why It’s Worth Paying For
The FeraTrading Compression Flow v1 offers a uniquely structured approach to breakout detection. While most compression indicators only highlight low-volatility zones, this script confirms breakouts through confluence, activates persistent bias, and provides a visual flow overlay that dynamically adjusts to the market.
Key distinctions include:
A custom ATR-based compression filter that adapts to any asset
Breakout confirmation from price structure, EMAs, and body dominance
A bias persistence engine that filters out false flips and maintains trend visibility
Dynamic bands that scale based on both price and volatility—not just moving averages
This combination cannot be replicated with built-in indicators or open-source scripts. It reflects real trade experience, structural logic, and volatility awareness built into a visual format designed to reduce overtrading and improve signal trust.
✅ Compliance & Originality
This script was built entirely in-house using original logic. Every calculation—from compression detection to bias activation—is proprietary and coded from scratch. No open-source libraries or reused components are present. Band rendering, bias conditions, and signal architecture were designed specifically for this model. EMA's and ATR were used in filter logic, yet they are only 2 of many filters used, all of the others being fully custom built.
The script uses no external data sources and is built entirely on native Pine Script logic.
⚠️ Risk Disclaimer & Access Policy
This tool is a visual momentum and structure tracking overlay. It does not predict future price movement and should not be used in isolation to make trading decisions. Always apply proper risk management, position sizing, and market awareness.
Past performance does not guarantee future results.
🔒 Why This Script Is Invite-Only and Closed-Source
The compression detection logic, multi-step breakout confirmation, and persistent bias engine represent proprietary intellectual property developed for high-clarity directional tracking.
Releasing this logic would expose the core detection methods to copycats and diminish its edge. Access is restricted to protect:
The custom compression logic
The confluence-based breakout filters
The bias state engine and dynamic band visualizations
Closed-source protection ensures this tool retains its uniqueness and value for serious traders.

Trend Following Bundle [ActiveQuants]The Trend Following Bundle indicator is a comprehensive toolkit designed to equip traders with a suite of essential technical analysis tools focused on identifying , confirming , and capitalizing on market trends . By bundling popular indicators like Moving Averages , MACD , Supertrend , ADX , ATR , OBV , and the Choppiness Index into a single script, it streamlines chart analysis and enhances strategy development.
This bundle operates on the principle that combining signals from multiple, complementary indicators provides a more robust view of market trends than relying on a single tool. It integrates:
Trend Direction: Moving Averages, Supertrend.
Momentum: MACD.
Trend Strength: ADX.
Volume Pressure: On Balance Volume (OBV).
Volatility: Average True Range (ATR).
Market Condition Filter: Choppiness Index (Trend vs. Range).
By allowing users to selectively enable, customize, and view these indicators (potentially across different timeframes), the bundle facilitates nuanced and layered trend analysis.
█ KEY FEATURES
All-in-One Convenience: Access multiple core trend-following indicators within a single TradingView script slot.
Modular Design: Easily toggle each individual indicator (MAs, MACD, Supertrend, etc.) On or Off via the settings menu to customize your chart view.
Extensive Customization: Fine-tune parameters (lengths, sources, MA types, colors, etc.) for every included indicator to match your trading style and the specific asset.
Multi-Timeframe (MTF) Capability: Configure each indicator component to analyze data from a different timeframe than the chart's, allowing for higher-level trend context.
Integrated Alerts: Pre-built alert conditions for key events like Moving Average crossovers , MACD signals , Supertrend flips , and Choppiness Index threshold crosses . Easily set up alerts through TradingView's alert system.
When configuring your alerts in TradingView, pay close attention to the trigger option:
- Setting it to " Only Once " will trigger the alert the first time the condition is met, which might happen during an unclosed bar (intra-bar). This alert instance will then cease.
- Setting it to " Once Per Bar Close " will trigger the alert only after a bar closes if the condition was met on that finalized bar. This ensures signals are based on confirmed data and allows the alert to potentially trigger again on subsequent closing bars if the condition persists or reoccurs. Use this option for signals based on confirmed, closed-bar data.
MA Smoothing & Bands (Optional): Apply secondary smoothing or Bollinger Bands directly to the Fast and Slow Moving Averages for advanced analysis.
█ USER INPUTS
Fast MA:
On/Off: Enables/Disables the Fast Moving Average plot and related smoothing/bands.
Type: Selects the primary calculation type (SMA, EMA, SMMA (RMA), WMA, VWMA). Default: EMA.
Source: Input data for the MA calculation (e.g., close, open, hl2). Default: close.
Length: Lookback period for the primary MA calculation. Default: 9.
Color: Sets the color of the primary Fast MA line. Default: Yellow.
Line Width: Sets the thickness of the primary Fast MA line. Default: 2.
Smoothing Type: Selects secondary smoothing type applied to the primary MA (e.g., None, SMA, EMA) or adds Bollinger Bands (SMA + Bollinger Bands). Default: None.
Smoothing Length: Lookback period for the secondary smoothing MA or the basis MA for Bollinger Bands. Relevant only if Smoothing Type is not " None ". Default: 10.
BB StdDev: Standard deviation multiplier for Bollinger Bands. Relevant only if Smoothing Type is " SMA + Bollinger Bands ". Default: 2.0.
Timeframe: Sets a specific timeframe for the MA calculation. Default: Chart.
Wait TF Close: If a timeframe is set, waits for that timeframe's bar to close before plotting, preventing repainting. Default: true.
Slow MA:
On/Off: Enables/Disables the Slow Moving Average plot and related smoothing/bands.
Type: Selects the primary calculation type (SMA, EMA, SMMA (RMA), WMA, VWMA). Default: EMA.
Source: Input data for the MA calculation (e.g., close, open, hl2). Default: close.
Length: Lookback period for the primary MA calculation. Default: 9.
Color: Sets the color of the primary Slow MA line. Default: Yellow.
Line Width: Sets the thickness of the primary Slow MA line. Default: 2.
Smoothing Type: Selects secondary smoothing type applied to the primary MA (e.g., None, SMA, EMA) or adds Bollinger Bands (SMA + Bollinger Bands). Default: None.
Smoothing Length: Lookback period for the secondary smoothing MA or the basis MA for Bollinger Bands. Relevant only if Smoothing Type is not " None ". Default: 10.
BB StdDev: Standard deviation multiplier for Bollinger Bands. Relevant only if Smoothing Type is " SMA + Bollinger Bands ". Default: 2.0.
Timeframe: Sets a specific timeframe for the MA calculation. Default: Chart.
Wait TF Close: If a timeframe is set, waits for that timeframe's bar to close before plotting, preventing repainting. Default: true.
MACD:
On/Off: Enables/Disables the MACD plots (MACD line, Signal line, Histogram).
Fast Length: Lookback period for the fast MA in MACD calculation. Default: 12.
Slow Length: Lookback period for the slow MA in MACD calculation. Default: 26.
Source: Input data for the MACD MAs. Default: close.
Signal Smoothing: Lookback period for the Signal Line MA. Default: 9.
Oscillator MA Type: Calculation type for Fast and Slow MAs (SMA, EMA). Default: EMA.
Signal Line MA Type: Calculation type for Signal Line MA (SMA, EMA). Default: EMA.
MACD Color: Color of the MACD line. Default: #2962FF.
MACD Signal Color: Color of the Signal line. Default: #FF6D00.
Timeframe: Sets a specific timeframe for the MACD calculation. Default: Chart.
Wait TF Close: If a timeframe is set, waits for that timeframe's bar to close. Default: true.
On Balance Volume (OBV):
On/Off: Enables/Disables the OBV plot and its related MAs/Bands.
Type (MA Smoothing): Selects MA type for smoothing OBV (None, SMA, EMA, etc.) or SMA + Bollinger Bands. Default: None.
Length (MA Smoothing): Lookback period for the OBV smoothing MA. Default: 14.
BB StdDev: Standard deviation multiplier for Bollinger Bands if selected. Default: 2.0.
Color: Color of the main OBV line. Default: #2962FF.
Timeframe: Sets a specific timeframe for the OBV calculation. Default: Chart.
Wait TF Close: If a timeframe is set, waits for that timeframe's bar to close. Default: true.
ADX:
On/Off: Enables/Disables the ADX plot.
ADX Smoothing: Lookback period for the ADX smoothing component. Default: 14.
DI Length: Lookback period for the Directional Movement (+DI/-DI) calculation. Default: 14.
Color: Color of the ADX line. Default: Red.
Timeframe: Sets a specific timeframe for the ADX calculation. Default: Chart.
Wait TF Close: If a timeframe is set, waits for that timeframe's bar to close. Default: true.
ATR:
On/Off: Enables/Disables the ATR plot.
Length: Lookback period for the ATR calculation. Default: 14.
Smoothing: Selects the calculation type for ATR (SMMA (RMA), SMA, EMA, WMA). Default: SMMA (RMA).
Color: Color of the ATR line. Default: #B71C1C.
Timeframe: Sets a specific timeframe for the ATR calculation. Default: Chart.
Wait TF Close: If a timeframe is set, waits for that timeframe's bar to close. Default: true.
Supertrend:
On/Off: Enables/Disables the Supertrend plot and background fill.
ATR Length: Lookback period for the ATR calculation within Supertrend. Default: 10.
Factor: Multiplier for the ATR value used to calculate the Supertrend bands. Default: 3.0.
Up Trend Color: Color for the Supertrend line and background during an uptrend. Default: Green.
Down Trend Color: Color for the Supertrend line and background during a downtrend. Default: Red.
Timeframe: Sets a specific timeframe for the Supertrend calculation. Default: Chart.
Wait TF Close: If a timeframe is set, waits for that timeframe's bar to close. Default: true.
Choppiness Index:
On/Off: Enables/Disables the Choppiness Index plot and bands.
Length: Lookback period for the Choppiness Index calculation. Default: 14.
Offset: Shifts the plot left or right. Default: 0.
Color: Color of the Choppiness Index line. Default: #2962FF.
Timeframe: Sets a specific timeframe for the CI calculation. Default: Chart.
Wait TF Close: If a timeframe is set, waits for that timeframe's bar to close. Default: true.
█ STRATEGY EXAMPLES
The following strategy examples are provided for illustrative and educational purposes only to demonstrate how indicators within this bundle could be combined. They do not constitute financial advice or trading recommendations. Always conduct your own thorough research and backtesting before implementing any trading strategy.
Here are a few ways the indicators in this bundle can be combined:
1. MA Crossover with Multi-Factor Confirmation
Goal: Enter trends early with confirmation from momentum and trend strength, while filtering out choppy conditions.
Setup: Enable Fast MA (e.g., 9 EMA), Slow MA (e.g., 50 EMA), MACD, ADX, and Choppiness Index.
Entry (Long):
- Price > Slow MA (Establishes broader uptrend context).
- Fast MA crosses above Slow MA OR Price crosses above Fast MA.
- MACD Histogram > 0 (Confirms bullish momentum).
- ADX > 20 or 25 (Indicates sufficient trend strength).
- Choppiness Index < 61.8 (Filters out excessively choppy markets).
Entry (Short): Reverse logic (except for ADX and Choppiness Index).
Management: Consider using the Supertrend or an ATR multiple for stop-loss placement.
Image showing a chart with 2:1 long and short trades, highlighting a candle disqualified for a long entry due to ADX below 20.
2. Supertrend Breakout Strategy
Goal: Use Supertrend for primary signals and stops, confirming with volume and trend strength.
Setup: Enable Supertrend, Slow MA, ADX, and OBV.
Entry (Long):
- Supertrend line turns green and price closes above it.
- Price > Slow MA (Optional filter for alignment with larger trend).
- ADX is rising or above 20 (Confirms trending conditions).
- OBV is generally rising or breaks a recent resistance level (Confirms volume supporting the move).
Entry (Short): Reverse logic (except for ADX and OBV).
Management: Initial stop-loss placed just below the green Supertrend line (for longs) or above the red line (for shorts). Trail stop as Supertrend moves.
Image showing a chart with a 2:1 long trade, one candle disqualified for a short entry, and another disqualified for a long entry.
3. Trend Continuation Pullbacks
Goal: Enter established trends during pullbacks to value areas defined by MAs or Supertrend.
Setup: Enable Slow MA, Fast MA (or Supertrend), MACD, and ADX.
Entry (Long):
- Price is consistently above the Slow MA (Strong uptrend established).
- ADX > 25 (Confirms strong trend).
- Price pulls back towards the Fast MA or the green Supertrend line.
- MACD Histogram was decreasing during the pullback but turns positive again OR MACD line crosses above Signal line near the MA/Supertrend level (Indicates momentum resuming).
Entry (Short): Reverse logic (except for ADX) during a confirmed downtrend.
Management: Stop-loss below the recent swing low or the Slow MA/Supertrend level.
Image showing a chart with 2:1 long and short trades, where price pulls back to the fast MA and the MACD histogram changes color, indicating shifts in momentum during the pullbacks.
█ CONCLUSION
The Trend Following Bundle offers a powerful and flexible solution for traders focused on trend-based strategies. By consolidating essential indicators into one script with deep customization, multi-timeframe analysis, and built-in alerts, it simplifies the analytical workflow and allows for the development of robust, multi-conditional trading systems. Whether used for confirming entries, identifying trend strength, managing risk, or filtering market conditions, this bundle provides a versatile foundation for technical analysis.
█ IMPORTANT NOTES
⚠ Parameter Tuning: Indicator settings (lengths, factors, thresholds) are not one-size-fits-all. Adjust them based on the asset being traded, its typical volatility, and the timeframe you are analyzing for optimal performance. Backtesting is crucial .
⚠ Multi-Timeframe Use: Using the Timeframe input allows for powerful analysis but be mindful of potential lag, especially if Wait TF Close is disabled. Signals based on higher timeframes will update only when that higher timeframe bar closes (if Wait TF Close is enabled).
⚠ Confirmation is Key: While the bundle provides many tools, avoid relying on a single indicator's signal. Use combinations to build confluence and increase the probability of successful trades.
⚠ Chart Clarity: With many indicators available, only enable those relevant to your current strategy to avoid overwhelming your chart. Use the On/Off toggles frequently.
⚠ Confirmed Bars Only: Like most TradingView indicators, signals and plots are finalized on the close of the bar. Be cautious acting on intra-bar signals which may change before the bar closes.
█ RISK DISCLAIMER
Trading involves substantial risk of loss and is not suitable for every investor. The Trend Following Bundle indicator provides technical analysis tools for educational and informational purposes only; it does not constitute financial advice or a recommendation to buy or sell any asset. Indicator signals identify potential patterns based on historical data but do not guarantee future price movements or profitability. Always conduct your own thorough analysis, use multiple sources of information, and implement robust risk management practices before making any trading decisions. Past performance is not indicative of future results.
📊 Happy trading! 🚀

Median Volume Weighted DeviationMVWD (Median Volume Weighted Deviation)
The Median Volume-Weighted Deviation is a technical trend following indicator that overlays dynamic bands on the price chart, centered around a Volume Weighted Average Price (VWAP). By incorporating volume-weighted standard deviation and its median, it identifies potential overbought and oversold conditions, generating buy and sell signals based on price interactions with the bands. The fill color between the bands visually reflects the current signal, enhancing market sentiment analysis.
How it Works
VWAP Calculation: Computes the Volume-Weighted Average Price over a specific lookback period (n), emphasizing price levels with higher volume.
Volume Weighted Standard Deviation: Measures price dispersion around the VWAP, weighted by volume, over the same period.
Median Standard Deviation: Applies a median filter over (m) periods to smooth the stand deviation, reducing noise in volatility estimates.
Bands: Constructs upper and lower bands by adding and subtracting a multiplier (k) times the median standard deviation from the VWAP
Signals:
Buy Signal: Triggers when the closing price crosses above the upper band.
Sell Signal: Triggers when the closing price crosses below the lower band.
Inputs
Lookback (n): Number of periods for the VWAP and standard deviation calculations. Default is set to 14.
Median Standard Deviation (m): Periods for the median standard deviation. Default is set to 2.
Standard Deviation Multiplier (k): Multiplier to adjust band width. Default is set to 1.7 with a step of 0.1.
Customization
Increase the Lookback (n) for a smoother VWAP and broader perspective, or decrease the value for higher sensitivity.
Adjust Median Standard Deviation (m) to control the smoothness of the standard deviation filter.
Modify the multiplier (k) to widen or narrow the bands based on the market volatility preferences.
Dynamic VWAP Levels (V1.0)The script calculates bands around the VWAP (Volume Weighted Average Price) using the Average True Range (ATR) to adjust the levels according to market reality. Buy and sell signals are generated when the price crosses these bands.
Customizable Parameters SmoothingLength (SmoothLength): The period used to smooth the levels. A higher value results in smoother bands that are less susceptible to rapid fluctuations.
Use EMA for smoothing?: Selects between using the Exponential Moving Average (EMA) or the Simple Moving Average (SMA) for smoothing.
ATR Length: The period used to calculate the ATR, which determines the frequency.
ATR Multiplier: A multiplier that adjusts the amplitude of the bands around the VWAP.
How the Script Works Calculating VWAP and Bands: The VWAP is calculated to obtain the volume weighted average price.
Bands are created around the VWAP by adding or subtracting a fraction of the ATR to account for the current market variation.
Smoothing Application: Price levels are smoothed to reduce market noise, allowing for better visualization of trends.
Signal Generation: Buy Signal: Generated when price crosses upwards the smoothed lower band (default dp7_smooth).
Sell Signal: Generated when price crosses downwards the smoothed upper band (default dp1_smooth).
