Improved Ichimoku Cloud: smoother and easier backtesting1. Smoother
This indicator uses the moving average of the price to calculate the Ichimoku cloud. The result is a smoother indicator that filters out noise. Bear in mind, it's a bit slower as well. Change the MA Len setting to 1 in order to display the traditional Ichimoku cloud.
2. Easier backtesting
When you're using the indicator in live trades, you're used to seeing the lagging span displaced back in time (hence the name). The lagging span gives information about if it is or isn't in the price range of a certain amount of candles ago. But when you're back testing, it's hard to find the exact point on the lagging span that matches the price in the past. You have to calculate what time it was, accourding to 'lagging span periods' ago, relative to the candle you want to observe in your back test. Then you have to find that moment on the timeline by eye. Therefore I made the Visual Method adjustable.
If you set the Visual Method to 'back test', the lagging span moves forward in time instead of backward. This swaps the idea: instead of inspecting whether the lagging span was in the price range, you can inspect if the price was in the lagging span range (or forward span, if you like). Seems weird, but the result is the same.
3. Mind the crypto default settings!
I have developed the indicator for crypto currency so the default settings are 20, 60, 120, 30. When you're not trading crypto's, set it to 9, 26, 52, 26. You can always use your own favorite settings, regardless what you're trading.
Buscar en scripts para "backtest"

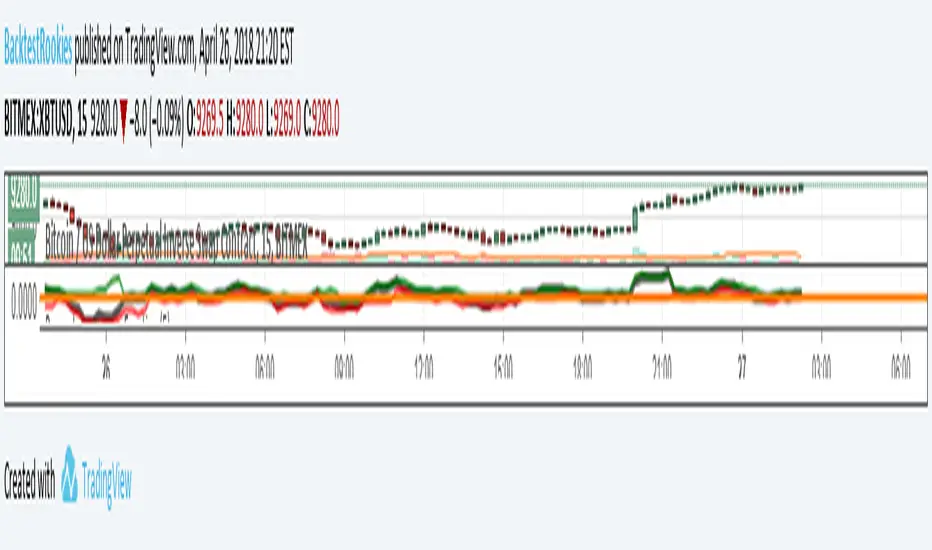
[Bybit] Gainzy Intraday Momentum AlgoOverview
This algorithm uses a single unorthodox moving average that I created by modifying an obscure moving average.
It is meant to be used on intraday time frames.
Signals
Green column: buy signal
Red column: sell signal
Wait for a candle to close in order for the signal to be confirmed
Profit tracking
The background tracks the profitability of the algorithm over the last 5000 candles or so
Every time a new signal is confirmed it updates the net profit (minus the commission)
Net profit is shown as a percentage of your starting balance. For example, say your starting balance is $1.00. Your current balance is $1.50. Net profit will appear as 50%.
Percent commission is the fee charged for entering a position using a market order. It is set to 0.75% by default.
Specifications
Net profit is based on using the entire account balance and compounding gains
For example, your balance is $100. You receive a buy signal and go long for $100. Price goes up a little over 10% and you receive a sell signal. You close your long position. Your new balance is $110. You now open a short position for $110. You have compounded the gains of your previous long position into your new short position.
Backtesting
You can view the profitability of this algorithm by Day / Week / Month / Quarter / Year / All-Time
If you choose the monthly Interval, on the final day of the month, it will display the realized profit of this algorithm. Unrealized profit will not be included. For example, if you are up 50% on the month and in a trade that is currently up 10%, net profit for the month will be shown as 50%. The 10% of unrealized profit will be carried over into the first trade of the following month.

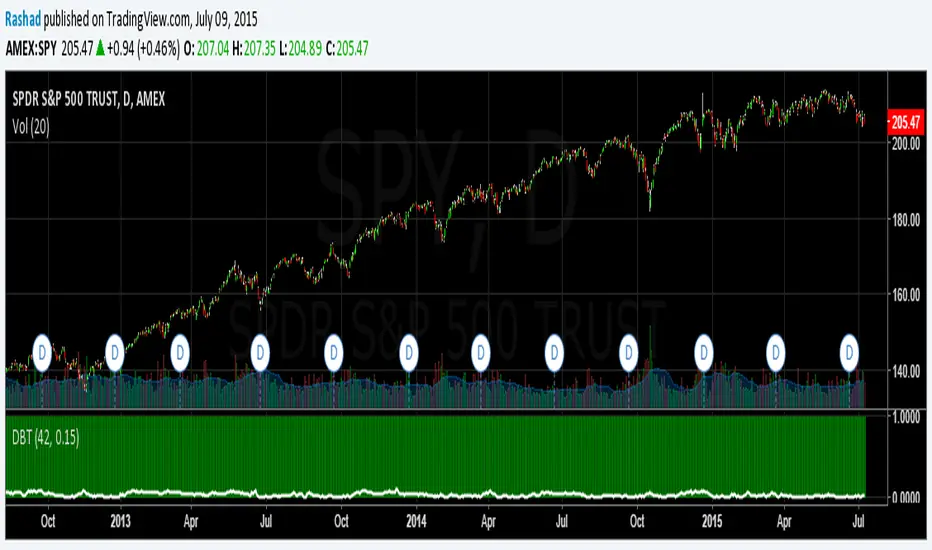
Deviation Back Tester (Great for Credit Spreads)!Error with math fixed in this one. Please use this one.
This is great for credit spreads! Lets say you wanted to know if you had sold a 15% OTM Bull Put vertical 2 months out, how often would you win? This Turns green if you would have been correct with your credit spread had it expired on that date, or red if you would've been wrong. Great for Back testing!
This could also be used for ATM debit spreads credit spreads etc. Example, how often does SPY deviate outside a 10% range relative to two months, 5% (if your doing straddles perhaps) etc.
This Can be used with any stock.
PLEASE KEEP IN MIND THAT IT TESTS DEVIATION IN BOTH DIRECTIONS. THEREFORE IT WILL HIGHLIGHT RED ON BOTH THE UPSIDE AND DOWNSIDE. WHEN BACKTESTING BE SURE TO CHECK WHETHER IT IS RED BECAUSE OF DOWNSIDE OR UPSIDE.
SMA Backtest Optimizer [Mr_Rakun]The SMA Backtest Optimizer is a powerful Pine Script tool designed to systematically analyze and compare various Simple Moving Average (SMA) periods to identify the most profitable configuration for trading strategies. This indicator tests multiple SMA periods (from 10 to 100) using a crossover strategy where buys occur when price crosses above the SMA and sells when price crosses below it.
Key Features:
Tests 10 different SMA periods to determine optimal settings
Calculates profit/loss based on a defined starting capital
Tracks total profit and number of trades for each period
Visually highlights the best performing SMA on your chart
Displays comprehensive results in an easy-to-read table
Labels the chart with key performance metrics
This code serves as a core framework that traders can customize for their specific needs. You can easily modify the strategy parameters, test different technical indicators, adjust capital settings, or implement more complex entry/exit rules. The optimization methodology can be applied to virtually any trading approach you wish to evaluate.
Feel free to adapt this framework to test your own trading ideas and discover which parameters work best in different market conditions.

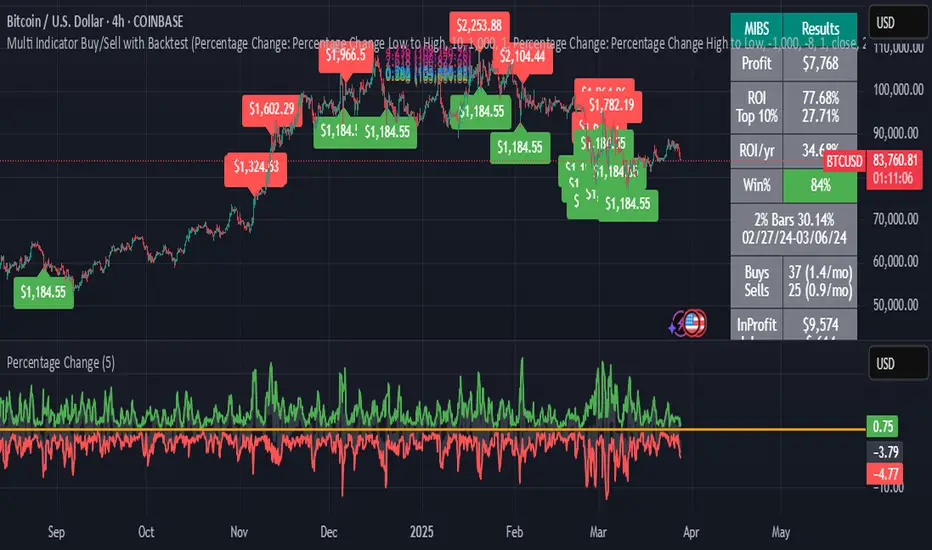
Multi Indicator Buy/Sell with BacktestThis backtest indicator allows you to configure up to 4 different indicators and set buy/sell levels for each one, then back test how well your strategy would have worked over a given time period.
EMA Crossover Backtest [BarScripts]This indicator lets you backtest an EMA crossover strategy with built-in risk management and trade tracking. It simulates long and short trades based on EMA crossovers, allowing you to fine-tune entry conditions, stop-loss placement, and reward/risk settings.
🔹 How It Works:
Long Entry: Fast EMA crosses above Slow EMA, and price closes above Fast EMA.
Short Entry: Fast EMA crosses below Slow EMA, and price closes below Fast EMA.
Stop Loss: Set based on previous bars or a fixed amount.
Take Profit: Adjustable reward/risk ratio.
Higher Timeframe Confluence: Confirms trades based on a larger timeframe.
Trade Hours Filter: Limits trades to specific time windows.
🔹 Key Features:
✅ Shows Entry & Exit Points with visual trade lines.
✅ Customizable EMA Lengths to fit any strategy.
✅ P&L Tracking & Statistics to measure performance.
✅ Position Sizing Options: Fixed position, fixed risk, or percentage of balance.
✅ Commissions Tracking (based on total trades, not contracts).
Use this tool to fine-tune your EMA crossover strategy and see how it performs over time! 🚀
💬 Let me know your feedback—suggest improvements, report issues, or request new features!

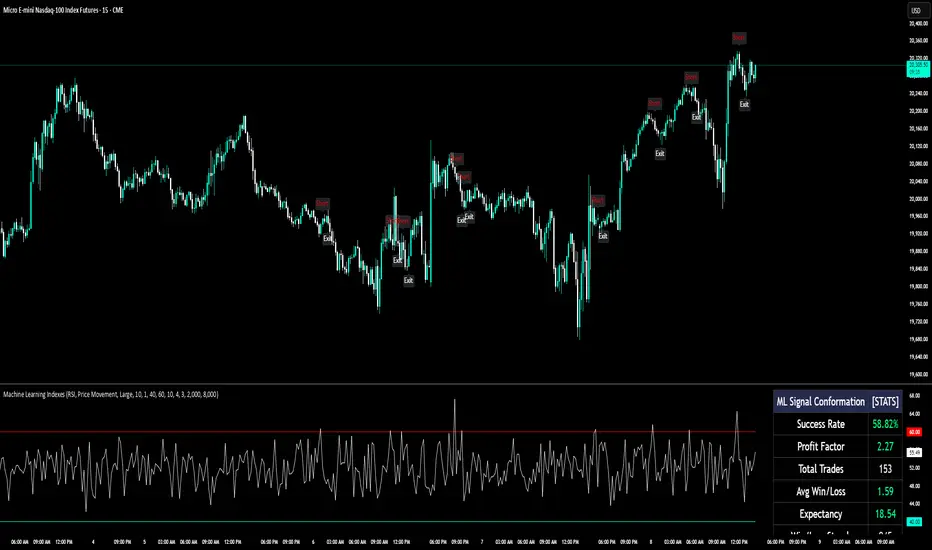
Machine Learning IndexesMachine Learning Indexes Script Description
The Machine Learning Indexes script is an advanced Pine Script™ indicator that applies machine learning techniques to analyze various market data types. It enables traders to generate adaptive long and short signals using highly customizable settings for signal detection and analysis.
Key Features:
Signal Mode: Allows the user to choose between generating signals for "Longs" (buy opportunities) or "Shorts" (sell opportunities).
Index Type: Supports multiple index types including RSI, CCI, MFI, Stochastic, and Momentum. All indexes are normalized between 0-100 for uniformity.
Data Set Selection: Provides options for analyzing Price, Volume, Volatility, or Momentum-based data sets. This enables traders to adapt the script to their preferred market analysis methodology.
Absolute vs. Directional Changes: Includes a toggle to calculate absolute changes for values or maintain directional sensitivity for trend-based analysis.
Dynamic Index Calculation: Automatically calculates and compares multiple index lengths to determine the best fit for current market conditions, adding precision to signal generation.
Input Parameters:
Signal Settings:
Signal Mode: Selects between "Longs" or "Shorts" to define the signal direction.
Index Type: Chooses the type of market index for calculations. Options include RSI, CCI, MFI, Stochastic, and Momentum.
Data Set Type: Determines the basis of the analysis, such as Price, Volume, Volatility, or Momentum-based data.
Absolute Change: Toggles whether absolute or directional changes are considered for calculations.
Index Settings:
Min Index Length: Sets the base index length used for calculations.
Index Length Variety: Adjusts the increment steps for variations in index length.
Lower/Upper Bands: Define thresholds for the selected index, indicating overbought and oversold levels.
Signal Parameters:
Target Signal Size: Number of bars used to identify pivot points.
Backtest Trade Size: Defines the number of bars over which signal performance is measured.
Sample Size: Number of data points used to calculate signal metrics.
Signal Strength Needed: Sets the minimum confidence required for a signal to be considered valid.
Require Low Variety: Option to prioritize signals with lower variability in results.
How It Works:
The script dynamically calculates multiple index variations and compares their accuracy to detect optimal parameters for generating signals.
Signal validation considers the chosen mode (longs/shorts), data set, index type, and signal parameters.
Adaptive moving averages (ADMA) and Band Signals (BS) are plotted to visualize the interaction between market trends and thresholds.
Long and short signals are displayed with clear up (L) and down (S) labels for easy interpretation.
Performance Metrics:
Success Rate: Percentage of valid signals that led to profitable outcomes.
Profit Factor: Ratio of gains from successful trades to losses from unsuccessful trades.
Disclaimer:
This indicator is for informational purposes only and does not guarantee future performance. It is designed to support traders in making informed decisions but should be used alongside other analysis methods and risk management strategies.
[TTI] Ned Davis Thrust Signal
HISTORY AND CREDITS–––––––––––––––––––––––––––––––––––––––––––––––––––––––
The indicator is inspired by studies from Ned Davis' NDR Institutional Service. I have shared before the backtest of this indicator, and now have coded it for TradingView so that you can have it on your charts.
WHAT IT DOES––––––––––––––––––––––––––––––––––––––––––––––––––––––––––––––
Thrust indicator gave a BUY signal with NYSE advancing stocks leading declining stocks by better than 1.91 to 1 over the last 10 trading sessions and a SELL signal when the ratio is less than 0.5
HOW TO USE IT–––––––––––––––––––––––––––––––––––––––––––––––––––––––––––––
I use the indicator as a gauge tool, in other words it is a piece of the puzzle to justify bullish or bearish trades. I put this type of analysis in my secondary tools that give me additional confidence for market direction and aggressiveness in my trading

[TTI] Ned Davis 3 day Price Thrust IndicatorThe NedDavis 3 Day Price Thrust Indicator
HISTORY AND CREDITS –––––––––––––––––––––––––––––––––––––––––––––––––––––––
The indicator is inspired by studies from Ned Davis' NDR Institutional Service. I have shared before the backtest of this indicator, and now have coded it for TradingView so that you can have it on your charts.
Link to idea here:
WHAT IT DOES ––––––––––––––––––––––––––––––––––––––––––––––––––––––––––––––
Thrusts occur when the S&P 500 rises at least 1.5% for one day, at least 1.15% for a second day, and at least 1.5% on the third day. The record since 1970 is perfect one year later. However, the prior 18 cases, ending in 1938, only show 11 out of 18 profitable one year later.
HOW TO USE IT –––––––––––––––––––––––––––––––––––––––––––––––––––––––––––––
I use the indicator as a gauge tool, in other words it is a piece of the puzzle to justify bullish or bearish trades. I put this type of analysis in my secondary tools that give me additional confidence for market direction and aggressiveness in my trading

VictoriaThis indicator visualises different oscillators processed through Inverse Fisher Transform
What is included:
Inverse Fisher Transform on different oscillators
You can combine multiple oscillators into one
The combination of sources can be calculated in different ways
Set different buy and sell signal thresholds
View selected thresholds in the chart
Use TradingView Technicals Buy and Sell signals to dynamically change threshold values
Convert signal to alerts
Multiple filters to allow or block signals
Backtest compatible
Alerts compatible
Two different chart modes:
You can view multiple oscillators in the same chart
You can view trade signals/alerts on the chart from the thresholds you have selected
Description:
With this indicator you're able to visually review the signal strength of one or multiple oscillators processed with Inverse Fisher Transform (IFT), combine them and choose the method of calculation when they are combined. This produces a signal which strongly fluctuates between -1 and +1 instead of the more common 0-100 most oscillators uses. The intention is to make the decision making clearer and easier when you decide when to enter or exit a trade. This aims to help you remove the feelings from your trading.
Inverse Fisher Transform was first presented by John Ehlers in Stocks & Commodities V. 22:5 where he proposes to process RSI with the formula for hyperbolic tangent, tanh(x). This transforms the oscillator into a smoother and more compressed version with quicker oscillations.
Within a bull or bear period of the traded asset the signal have different strengths. To harness this to our advantage we use the combined strength of the TradingView Technical indicator which gives us a Buy, Strong Buy, Sell or a Strong Sell on the selected timeframe and asset. This makes it possible to delay the buy in bearish conditions to only trigger when it is really oversold and also allow the signal be more relaxed and exit the trade sooner. While on the other hand if the condition is bullish the buy signal is relaxed and the sell requires a stronger signal. All of this is possible to change in the indicator to fine tune the settings for the specific asset and timeframe selected. We also have the possibility of blocking the buy signals with different filters.

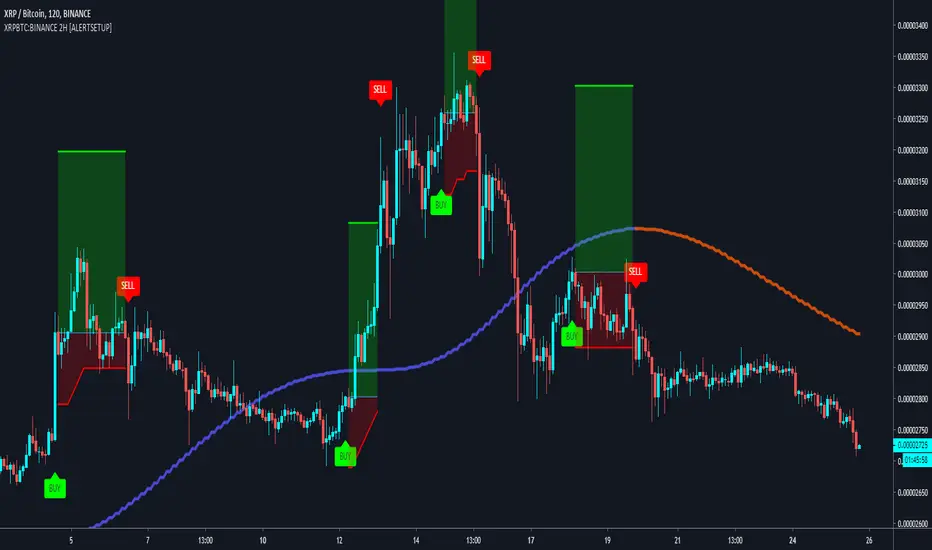
Buy & Sell XRPBTC:BINANCE 2H Trading BotBuy & Sell Alert system for BINANCE:TRXBTC
Goal is to Beat Buy & Hold on the 2H (see backtest below)
Built upon the Supertrend, ADX and Tilson T3 indicators.
A trailing Stop loss in integrated to the script, as well as a Take profit system.
To get the indicator, please use the link below, thanks!
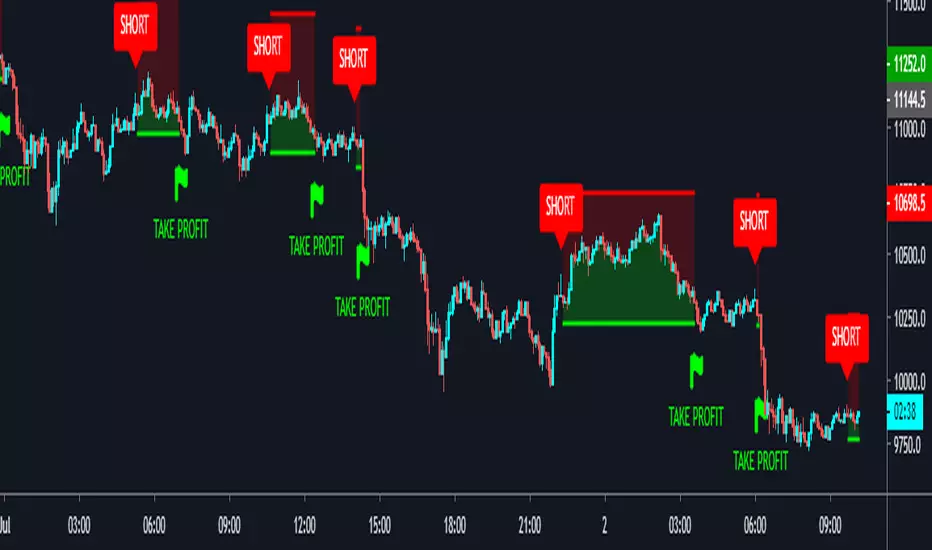
Cyatophilum Shooting Stars 1m [ALERTSETUP]A Scalping Script Setup for the 1m Timeframe, using the cheesy candle pattern "Shooting Stars" plus some Trend Detection, Stop Loss and Take Profit integrated system, allowing these nice backtest results.
Currently in continuous development / real time testing on BitMEX data.

DayTrade - XBTUSD 5m [ALERTSETUP]Plug & Play indicator for BITMEX:XBTUSD in 5 minute timeframe for Manual or Automated Day Trading.
Built upon Cyatophilum Scalping Bot
Backtest below show results over 2 weeks, calculated with a 0.075 % commission fee and using 100% of equity on each trade from 10 000$ inital capital.
> Get access to the Cyatophilum Indicators <
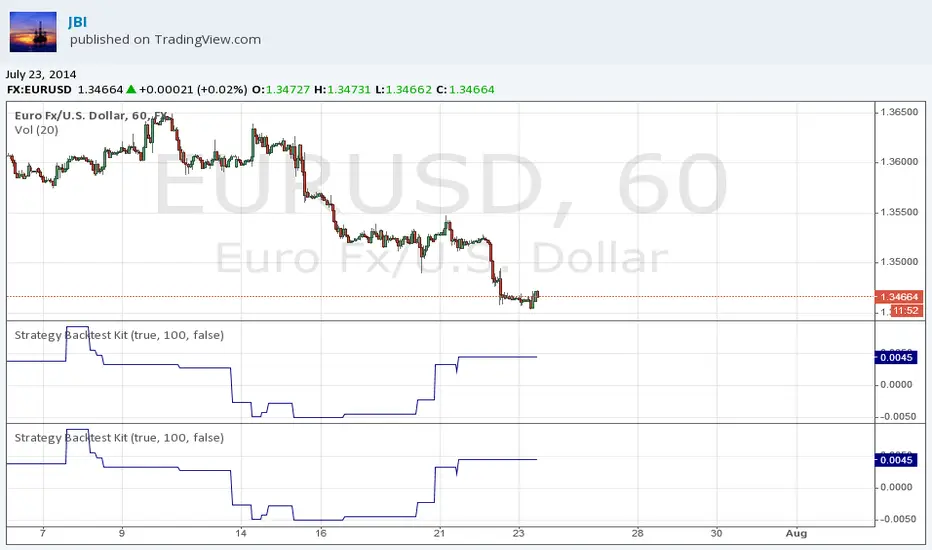
Strategy Backtest KitStrategy Backtest Kit. You have just to define your own entry / exit setups. The strategy I have coded into this is : BUY when MACD > 0 / SELL when MACD < 0. Always in position.
Follow JBI for his daily analyses!
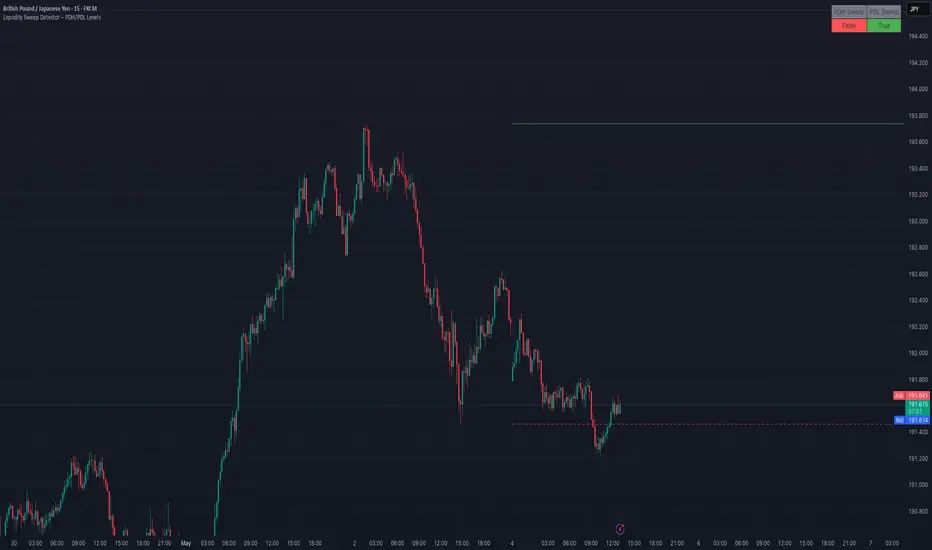
Liquidity Sweep Detector – PDH/PDL LevelsPrevious Day High/Low Liquidity Sweep Detector (Intraday Accurate)
This indicator tracks the previous day's high and low using intraday data, rather than the daily candle, ensuring precise sweep detection across lower timeframes (15m to 4H).
It monitors for liquidity sweeps—moments when price briefly moves above the previous high or below the previous low—and visually marks these events on the chart.
Key Features
Intraday-accurate PDH/PDL tracking
Real-time sweep detection
On-chart labels marking sweep events
Toggleable table showing sweep status
Alert conditions for PDH/PDL sweep triggers
Best For
Traders who use Smart Money Concepts (SMC), liquidity-based strategies, or look for stop hunts and reversal zones tied to key prior-day levels.
Works well across FX, crypto, and indices on 15m, 1H, and 4H charts.
RSI MTF Ob+OsHello Traders,
This indicator use the same concept as my previous indicator "CCI MTF Ob+Os".
It is a simple "Relative Strength Index" ( RSI ) indicator with multi-timeframe (MTF) overbought and oversold level.
It can detect overbought and oversold level up to 5 timeframes, which help traders spot potential reversal point more easily.
There are options to select 1-5 timeframes to detect overbought and oversold.
Aqua Background is "Oversold" , looking for "Long".
Orange Background is "Overbought" , looking for "Short".
Have fun :)

CCI MTF Ob+OsHello Traders,
This is a simple Commodity Channel Index (CCI) indicator with multi-timeframe (MTF) overbought and oversold level.
It can detect overbought and oversold level up to 5 timeframes, which help traders spot potential reversal point more easily.
There are options to select 1-5 timeframes to detect overbought and oversold.
Green Background is "Oversold" , looking for "Long".
Red Background is "Overbought" , looking for "Short".
Have fun :)

MACD Cross [Momentum & Trend Filter]This is MTF MACD crossover and crossunder, with EMA trend filter and MTF RSI overbought/oversold filter.
Guidelines:
- User can set stop loss, take profit target and risk to reward ratio in setting
- ATR Stop and ATR Multiplier are use to set stop loss and take profit levels, setting are varies depend on what you are trading, play around and find appropriate number
- Don't trade if range between stop loss and target profit are too small or if there are too many small range try to increase multiplier
- If MACD Zero Line Filter enable, detect MACD crossover only under zero line for LONG, and detect MACD crossunder only above zero line for SHORT
- If EMA Trend Filter enable, detect MACD crossover which price above EMA for LONG, and detect MACD crossunder which price below EMA for SHORT
- RSI timeframe 1-3 should not lower than chart timeframe to display Overbought and Oversold correctly
- Enable MTF Overbought and Oversold just to display red background for Overbought, and green background for Oversold
There are 3 alert options:
(For those free user which can get only 1 alert, please choose "MACD crossover & crossunder" if you want to get alert for both long and short directions)
Have fun :)

Demand & Supply Zones [eyes20xx]Demand & Supply Zones
This indicator helps to identify large moves driven by institutions.
What qualifies as a zone?
If the price moves (open to close) by more than a certain % in one candle or in a bullish / bearish run of candles, the zone is marked as a Demand or Supply zone .
0.8% is good for Crypto and Forex might be better with 0.4%. Play around with the % to match your requirements.
Active zones
A zone remains active until it is hit by the price. When it becomes inactive, the zone background becomes transparent.
Zone lines
Lines are displayed if the zone is active and within a certain % of the close. 3% is a good setting for Crypto.
A maximum of two lines are displayed for each zone type.

Simple Candle Info This script shows the following simple information about the last candle:
- Candle size
- Body size included %
- Top Wick size
- Bottom Wick size
- Top Wick + Body size
- Bottom Wick + Body size
You can change:
- colors and position for labels
- add information for previous candle too
- change language

ATR ExhaustionThe ATR Exhaustion indicator for Tradingview will overlay the minimum and maximum price limits for a timeframe over your chart. It calculates the price limits be adding and subtracting the ATR level from the high and lows of the period you are interested in.
For example, you can see the daily upper and lower ATR levels whilst on a 15-minute chart. The upper and lower ranges will update as price moves.
Why would this be useful?
It the true price range on average does not move more than x pips/points, then the range boundaries might provide support/resistance levels as price approaches the levels. Additionally, you can use this tool to easily identify how volatile price action has been in comparison to previous periods.
Features
Easily see ATR Exhaustion areas in any timeframe
Period highs and lows are plotted and updated as price action unfolds
Color fills change when price moves beyond the ATR range for easy identification of periods of strong trends or volatility.

Percentage Change FunctionThis is little code snippet can be copied and pasted into your own strategies and indicators to easily calculate some interesting percentage change levels within a given lookback period.
The function will return:
The price change from the start to the end of the period
The price change from the start of the period to the highest point within the period
The price change from the start of the period to the lowest point within the period
It was originally intended to be used in conjunction with other scripts to assist with decision making. However, it doesn't look too bad as an indicator and so plots have been added.
For more information regarding the code, some commentary and free tutorials, you can visit the Bactest-Rookies (.com) website.
Brandon: Fractals MKIICustom Indicator development published for customer verification and acceptance.
Features
Generate buy / sell signals if x number of candles following a fractal are up/down.
Generate an early warning (background color change) if x - 1 candles following a fractal are up/down
Generate alerts for buy/sell signals and early warning.
