Custom Length ATRThis Custom Length ATR Indicator allows traders to calculate the Average True Range (ATR) dynamically based on a selected timeframe and number of days. Unlike traditional ATR indicators that are tied to the chart’s timeframe, this script lets users choose a specific timeframe scale (e.g., Daily, Hourly, etc.), ensuring consistent volatility measurement across different trading views.
Buscar en scripts para "atr"

Trendilo ARTrendilo AR is a custom trading indicator designed to identify market trends using advanced techniques such as the Arnaud Legoux Moving Average (ALMA), volume confirmations, and dynamic volatility bands. This indicator provides a clear visualization of trends, including significant changes and custom alerts.
Review of Indicators Used
1. ALMA
Description:
ALMA is a moving average that applies an advanced filter to smooth price data, reducing noise and focusing on actual trends.
Usage in the Indicator:
Used to calculate the smoothed percentage price change and determine trend direction. Customizable parameters include:
- Length: Defines the number of bars to consider.
- Offset: Adjusts sensitivity toward recent prices.
- Sigma: Controls the degree of smoothing.
Advantages:
- Reduced lag in trend detection.
- Resistance to market noise.
2. ATR
Description:
ATR measures the market’s average volatility by considering the range between high and low prices over a given period.
Usage in the Indicator:
ATR is used to calculate "dynamic smoothing", adjusting the indicator’s sensitivity based on current market volatility.
Advantages:
- Adapts to high or low volatility conditions.
- Helps define dynamic support and resistance levels.
3. SMA
Description:
SMA calculates the average of prices or volume over a specific time period.
Usage in the Indicator:
Used to calculate the volume moving average (Volume SMA) to confirm whether the current volume supports the detected trend.
Advantages:
- Easy to understand and calculate.
- Provides volume-based trend confirmation.
4. RMS Bands
Description:
RMS Bands calculate the standard deviation of percentage price changes, creating upper and lower levels that act as overbought and oversold indicators.
Usage in the Indicator:
- Define the range within which the market is considered neutral.
- Crosses above or below the bands indicate trend changes.
Advantages:
- Visual identification of strong trends.
- Helps filter false signals.
Colors and Visuals Used in the Indicator
1. ALMA Line
Colors:
- Green: Indicates a confirmed uptrend (with sufficient volume).
- Red: Indicates a confirmed downtrend (with sufficient volume).
- Gray: Indicates a neutral phase or insufficient volume to confirm a trend.
2. RMS Bands
- Upper and Lower Lines:
- Purple (with transparency): These lines represent the RMS bands (upper and lower) and
adjust opacity based on trend strength.
- Stronger trends result in less transparency (more solid colors).
3. Highlighted Background (Strong Trends)
- Color:
- Light Green (transparent): Highlights a strong trend when the smoothed percentage change (ALMA) exceeds 1.5 times the RMS.
4. Horizontal Lines
- Baseline (0):
- Dark Gray: Serves as a central reference to identify the directionality of percentage changes.
- Additional Line (0.1):
- Blue: A customizable line to mark user-defined key levels.
5. Bar Colors
- Bar Colors:
- Green: When the price is in a confirmed uptrend.
- Red: When the price is in a confirmed downtrend.
- No color: When there is insufficient volume or no clear trend.
How to Use the Indicator
1. Initial Setup
1. Add the Indicator to Your Chart: Copy the code into the Pine Editor on TradingView and apply it to your chart.
2. Customize Parameters: Adjust values based on your trading strategy:
- Smoothing: Controls the level of smoothing for percentage changes.
- Lookback Length: Defines the observation period for calculations.
- Band Multiplier: Adjusts the width of RMS bands.
2. Signal Interpretation
1. Indicator Colors:
- Green: Confirmed uptrend.
- Red: Confirmed downtrend.
- Gray: No clear trend or insufficient volume.
2. RMS Bands:
- If the ALMA line (smoothed percentage change) crosses above the upper RMS band, it signals a potential uptrend.
- If it crosses below the lower RMS band, it signals a potential downtrend.
3. Volume Confirmation:
- The indicator's color activates only if the current volume exceeds the Volume SMA.
3. Alerts and Decisions
1. Trend Change Alerts:
- The indicator automatically triggers alerts when an uptrend or downtrend is detected.
- Configure these alerts to receive real-time notifications.
2. Strong Trend Signals:
- When the magnitude of the percentage change exceeds 1.5 times the RMS, the chart background highlights the strong trend.
4. Trading Strategies
1. Buy:
- Enter long positions when:
- The indicator turns green.
- Volume confirms the trend.
- Consider placing a stop-loss just below the lower RMS band.
2. Sell:
- Enter short positions when:
- The indicator turns red.
- Volume confirms the trend.
- Consider placing a stop-loss just above the upper RMS band.
3. Neutral:
- Avoid trading when the indicator is gray, as no clear trend or insufficient volume is present.
Disclaimer: As this is my first published indicator, please use it with caution. Feedback is highly appreciated to improve its performance.
Happy Trading!

Multi-LTF ATR Trailing Stop - AYNETSimple Explanation of the Code
This Pine Script code implements a multi-timeframe ATR-based trailing stop indicator. It calculates and plots the trailing stop lines for up to six configurable timeframes. Users can enable or disable specific timeframes, and each trailing stop line is color-coded and labeled with the corresponding timeframe (e.g., "15m", "1H").
Key Features of the Code
Multi-Timeframe Support:
The script calculates trailing stops for six different timeframes, such as 15 minutes, 1 hour, 1 day, etc.
User Configurations:
The user can:
Select timeframes for each trailing stop (e.g., "15m", "1H").
Enable or disable each timeframe using checkboxes.
Adjust the ATR period and multiplier to customize the trailing stop calculation.
Color-Coded Lines:
Each timeframe's trailing stop is plotted with a unique color for easy distinction.
Labels for Timeframes:
Labels at the end of the lines indicate the timeframe of each trailing stop (e.g., "15m", "1H").
Summary
This code is a multi-timeframe ATR trailing stop tool that helps traders visualize and analyze trailing stops across multiple timeframes. It is customizable, dynamic, and visually intuitive, making it ideal for both trend-following and stop-loss management.
Market Volatility Key: CHOP, ATR, VIX & 10Y BondThis script builds upon existing market analysis tools by providing a comprehensive dashboard that combines the Choppiness Index (CHOP), Average True Range (ATR) with a user-selectable timeframe, VIX (Volatility Index), and the 10-year US Treasury bond price in a compact tile format. The color-coded key provides quick visual cues for market conditions—highlighting whether the market is trending or consolidating—allowing traders to make informed decisions quickly.
For example, when trading the Nasdaq (NQ), you might use this indicator to help manage your scalping trades. If you trade on a 10-minute chart but set the ATR timeframe to 1 minute, it helps identify whether there is enough price movement to justify entering a trade. If the ATR is less than 10, it suggests there's not enough range for scalping opportunities, and you may choose to stay out of the trade.
This expanded indicator integrates and enhances existing concepts to deliver a well-rounded view of volatility, trend strength, and market conditions all in one glance, making it an essential tool for both trend-following and scalping strategies.

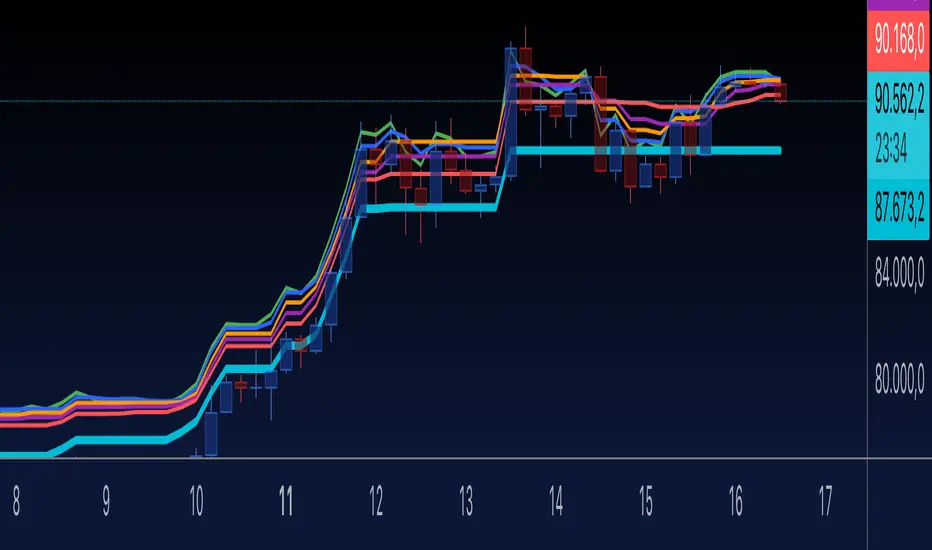
Adaptive VWAP [QuantAlgo]Introducing the Adaptive VWAP by QuantAlgo 📈🧬
Enhance your trading and investing strategies with the Adaptive VWAP , a versatile tool designed to provide dynamic insights into market trends and price behavior. This indicator offers a flexible approach to VWAP calculations by allowing users to adapt it based on lookback periods or fixed timeframes, making it suitable for a wide range of market conditions.
🌟 Key Features:
🛠 Customizable VWAP Settings: Choose between an adaptive VWAP that adjusts based on a rolling lookback period, or switch to a fixed timeframe (e.g., daily, weekly, monthly) for a more structured approach. Adjust the VWAP to suit your trading or investing style.
💫 Dynamic Bands and ATR Filter: Configurable deviation bands with multipliers allow you to visualize price movement around VWAP, while an ATR-based noise filter helps reduce false signals during periods of market fluctuation.
🎨 Trend Visualization: Color-coded trend identification helps you easily spot uptrends and downtrends based on VWAP positioning. The indicator fills the areas between the bands for clearer visual representation of price volatility and trend strength.
🔔 Custom Alerts: Set up alerts for when price crosses above or below the VWAP, signaling potential uptrend or downtrend opportunities. Stay informed without needing to monitor the charts constantly.
✍️ How to Use:
✅ Add the Indicator: Add the Adaptive VWAP to your favourites and apply to your chart. Choose between adaptive or timeframe-based VWAP calculation, adjust the lookback period, and configure the deviation bands to your preferred settings.
👀 Monitor Bands and Trends: Watch for price interaction with the VWAP and its deviation bands. The color-coded signals and band fills help identify potential trend shifts or price extremes.
🔔 Set Alerts: Configure alerts for uptrend and downtrend signals based on price crossing the VWAP, so you’re always informed of significant market movements.
⚙️ How It Works:
The Adaptive VWAP adjusts its calculation based on the user’s chosen configuration, allowing for a flexible approach to market analysis. The adaptive setting uses a rolling lookback period to continuously adjust the VWAP, while the fixed timeframe option anchors VWAP to key timeframes like daily, weekly, or monthly periods. This flexibility enables traders and investors to use the tool in various market environments.
Deviation bands, calculated with customizable multipliers, provide a clear visual of how far the price has moved from the VWAP, helping you gauge potential overbought or oversold conditions. To reduce false signals, an ATR-based filter can be applied, ensuring that only significant price movements trigger trend confirmations.
The tool also includes a fast exponential smoothing function for the VWAP, helping smooth out price fluctuations without sacrificing responsiveness. Trend confirmation is reinforced by the number of bars that price stays above or below the VWAP, ensuring a more consistent trend identification process.
Disclaimer:
The Adaptive VWAP is designed to enhance your market analysis but should not be relied upon as the sole basis for trading or investing decisions. Always combine it with other analytical tools and practices. No statements or signals from this indicator constitute financial advice. Past performance is not indicative of future results.

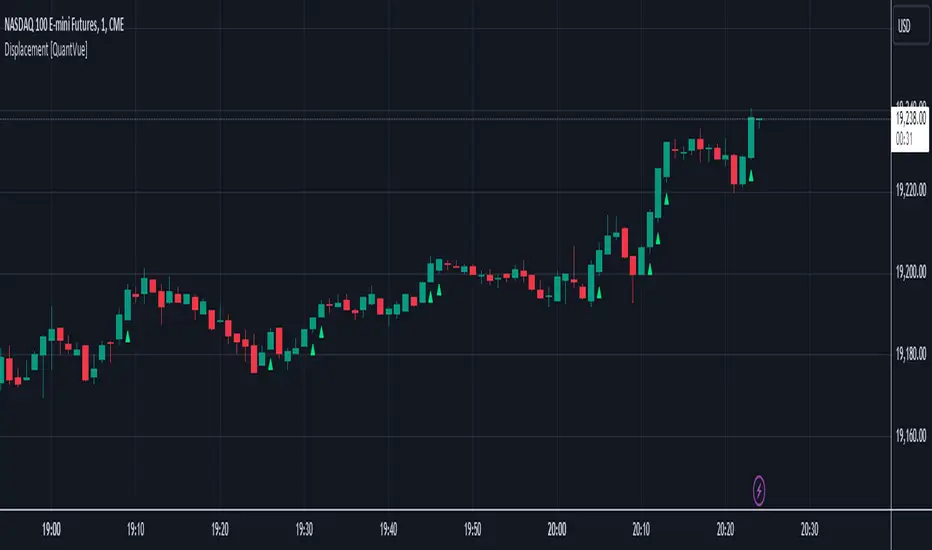
Displacement [QuantVue]Displacement refers to a significant and forceful price movement that indicates a potential shift in market sentiment or trend. Displacement is characterized by a strong push in price action, often seen after a period of consolidation or within a trending market. It is a key concept used to identify the strength of a move and to confirm the direction of the market.
The "Displacement" indicator does this by focusing on identifying strong, directional price movements by combining candlestick analysis with volatility (ATR).
Displacement often appears as a group of candles that are all positioned in the same direction, these candles typically have large bodies and short wicks.
How the indicator works:
Body Size Requirement: Ensures that only candles with a significant body size (relative to their total range) are considered, helping to identify strong market moves.
Consecutive Candle Analysis: Identifies shifts in market sentiment by requiring a series of consecutive bullish or bearish candles to confirm a potential change in trend.
ATR-Based Analysis: Uses the Average True Range (ATR) to gauge market volatility and filter out minor price fluctuations, focusing on substantial movements.
Once all of the requirements are met a triangle is plotted above or below the bar.
Wedge Pop & Drop [QuantVue]A "Wedge Pop" is a trading pattern popularized by Oliver Kell, a notable trader who won the 2020 US Investing Championship with a remarkable return of 941%. This pattern, often referred to as "The Money Pattern" in his trading strategy, serves as a critical signal indicating the beginning of a new uptrend in a stock.
A Wedge Pop occurs when a stock first trades up through the moving averages after reaching a downside extension. Conversely, a Wedge Drop refers to the first time a stock trades down through the moving averages after reaching an upside extension.
How the Indicator Works:
The indicator uses the Average True Range (ATR) and the 10-period Exponential Moving Average (10 EMA) to identify upside and downside extensions. An upside extension occurs when the low of the current bar is greater than 1.5 (default) times the ATR above the moving average. A downside extension occurs when the high of the current bar is less than 1.5 times the ATR below the moving average.
Once an extension has been reached, the first time the security trades back through the moving averages, it triggers a Wedge Pop/Drop.
Give this indicator a BOOST and COMMENT your thoughts below!
We hope you enjoy.
Cheers!

Trend Strength | Flux Charts💎 GENERAL OVERVIEW
Introducing the new Trend Strength indicator! Latest trends and their strengths play an important role for traders. This indicator aims to make trend and strength detection much easier by coloring candlesticks based on the current strength of trend. More info about the process in the "How Does It Work" section.
Features of the new Trend Strength Indicator :
3 Trend Detection Algorithms Combined (RSI, Supertrend & EMA Cross)
Fully Customizable Algorithm
Strength Labels
Customizable Colors For Bullish, Neutral & Bearish Trends
📌 HOW DOES IT WORK ?
This indicator uses three different methods of trend detection and combines them all into one value. First, the RSI is calculated. The RSI outputs a value between 0 & 100, which this indicator maps into -100 <-> 100. Let this value be named RSI. Then, the Supertrend is calculated. Let SPR be -1 if the calculated Supertrend is bearish, and 1 if it's bullish. After that, latest EMA Cross is calculated. This is done by checking the distance between the two EMA's adjusted by the user. Let EMADiff = EMA1 - EMA2. Then EMADiff is mapped from -ATR * 2 <-> ATR * 2 to -100 <-> 100.
Then a Total Strength (TS) is calculated by given formula : RSI * 0.5 + SPR * 0.2 + EMADiff * 0.3
The TS value is between -100 <-> 100, -100 being fully bearish, 0 being true neutral and 100 being fully bullish.
Then the Total Strength is converted into a color adjusted by the user. The candlesticks in the chart will be presented with the calculated color.
If the Labels setting is enabled, each time the trend changes direction a label will appear indicating the new direction. The latest candlestick will always show the current trend with a label.
EMA = Exponential Moving Average
RSI = Relative Strength Index
ATR = Average True Range
🚩 UNIQUENESS
The main point that differentiates this indicator from others is it's simplicity and customization options. The indicator interprets trend and strength detection in it's own way, combining 3 different well-known trend detection methods: RSI, Supertrend & EMA Cross into one simple method. The algorithm is fully customizable and all styling options are adjustable for the user's liking.
⚙️ SETTINGS
1. General Configuration
Detection Length -> This setting determines the amount of candlesticks the indicator will look for trend detection. Higher settings may help the indicator find longer trends, while lower settings will help with finding smaller trends.
Smoothing -> Higher settings will result in longer periods of time required for trend to change direction from bullish to bearish and vice versa.
EMA Lengths -> You can enter two EMA Lengths here, the second one must be longer than the first one. When the shorter one crosses under the longer one, this will be a bearish sign, and if it crosses above it will be a bullish sign for the indicator.
Labels -> Enables / Disables trend strength labels.

Market Structure Break Targets [UAlgo]The "Market Structure Break Targets " indicator is designed to identify and visualize key market structure points such as Market Structure Breaks (MSBs) and Break of Structures (BoS). These points are crucial for understanding market trends and potential reversal zones. By plotting these structures on the chart, traders can easily spot significant support and resistance levels, as well as potential entry and exit points.
This indicator uses a combination of swing highs and lows to determine market structures and calculates targets based on user-defined percentages or Average True Range (ATR) multipliers. It provides visual cues in the form of lines, labels, and boxes to help traders quickly interpret market conditions.
🔶 Key Features
Customizable Swing Length: Users can set the swing length to identify the pivot highs and lows, which are crucial for determining market structure.
Target Duration Bars: Defines the maximum duration (in bars) for which the targets will be considered valid.
Target Calculation Methods: The target levels are crucial for setting potential price objectives. The calculation can be based on a percentage move from the identified pivot or using the ATR to factor in market volatility. These targets help in setting realistic profit-taking levels or identifying stop-loss placements.
Bullish and Bearish Market Structure Break (MSB): Detects and highlights bullish and bearish market structure breaks with customizable colors and target percentages.
Bullish MSB
When the price closes above a significant pivot high, a bullish MSB is identified. The indicator will draw a line at this level and calculate a target based on the chosen method (percentage or ATR). The target is visualized with a dotted line, and a label "MSB" is displayed. Additionally, an order block is created at the level of the bullish MSB. This order block is highlighted with a semi-transparent box, representing a potential area where price might find support in the future.
Bearish MSB
Conversely, when the price closes below a significant pivot low, a bearish MSB is marked. Similar to bullish MSBs, targets are calculated and displayed on the chart. An order block is also generated at the level of the bearish MSB, visualized with a semi-transparent box. This box highlights a potential resistance area where price might face selling pressure.
Bullish and Bearish Break of Structure (BoS): Identifies break of structures for both bullish and bearish scenarios, providing additional target levels.
Bullish BoS
If the price continues to rise and breaks another significant level, a bullish BoS is detected. This break is also marked with lines and labels, providing additional target levels for traders. An order block is created at the BoS level, serving as a potential support zone.
Bearish BoS
If the price falls further after a bearish MSB, a bearish BoS is identified and visualized similarly. The indicator creates an order block at the BoS level, which acts as a potential resistance zone.
🔶 Disclaimer:
Use with Caution: This indicator is provided for educational and informational purposes only and should not be considered as financial advice. Users should exercise caution and perform their own analysis before making trading decisions based on the indicator's signals.
Not Financial Advice: The information provided by this indicator does not constitute financial advice, and the creator (UAlgo) shall not be held responsible for any trading losses incurred as a result of using this indicator.
Backtesting Recommended: Traders are encouraged to backtest the indicator thoroughly on historical data before using it in live trading to assess its performance and suitability for their trading strategies.
Risk Management: Trading involves inherent risks, and users should implement proper risk management strategies, including but not limited to stop-loss orders and position sizing, to mitigate potential losses.
No Guarantees: The accuracy and reliability of the indicator's signals cannot be guaranteed, as they are based on historical price data and past performance may not be indicative of future results.

Filtered MACD with Backtest [UAlgo]The "Filtered MACD with Backtest " indicator is an advanced trading tool designed for the TradingView platform. It combines the Moving Average Convergence Divergence (MACD) with additional filters such as Moving Average (MA) and Average Directional Index (ADX) to enhance trading signals. This indicator aims to provide more reliable entry and exit points by filtering out noise and confirming trends. Additionally, it includes a comprehensive backtesting module to simulate trading strategies and assess their performance based on historical data. The visual backtest module allows traders to see potential trades directly on the chart, making it easier to evaluate the effectiveness of the strategy.
🔶 Customizable Parameters :
Price Source Selection: Users can choose their preferred price source for calculations, providing flexibility in analysis.
Filter Parameters:
MA Filter: Option to use a Moving Average filter with types such as EMA, SMA, WMA, RMA, and VWMA, and a customizable length.
ADX Filter: Option to use an ADX filter with adjustable length and threshold to determine trend strength.
MACD Parameters: Customizable fast length, slow length, and signal smoothing for the MACD indicator.
Backtest Module:
Entry Type: Supports "Buy and Sell", "Buy", and "Sell" strategies.
Stop Loss Types: Choose from ATR-based, fixed point, or X bar high/low stop loss methods.
Reward to Risk Ratio: Set the desired take profit level relative to the stop loss.
Backtest Visuals: Display entry, stop loss, and take profit levels directly on the chart with
colored backgrounds.
Alerts: Configurable alerts for buy and sell signals.
🔶 Filtered MACD : Understanding How Filters Work with ADX and MA
ADX Filter:
The Average Directional Index (ADX) measures the strength of a trend. The script calculates ADX using the user-defined length and applies a threshold value.
Trading Signals with ADX Filter:
Buy Signal: A regular MACD buy signal (crossover of MACD line above the signal line) is only considered valid if the ADX is above the set threshold. This suggests a stronger uptrend to potentially capitalize on.
Sell Signal: Conversely, a regular MACD sell signal (crossunder of MACD line below the signal line) is only considered valid if the ADX is above the threshold, indicating a stronger downtrend for potential shorting opportunities.
Benefits: The ADX filter helps avoid whipsaws or false signals that might occur during choppy market conditions with weak trends.
MA Filter:
You can choose from various Moving Average (MA) types (EMA, SMA, WMA, RMA, VWMA) for the filter. The script calculates the chosen MA based on the user-defined length.
Trading Signals with MA Filter:
Buy Signal: A regular MACD buy signal is only considered valid if the closing price is above the MA value. This suggests a potential uptrend confirmed by the price action staying above the moving average.
Sell Signal: Conversely, a regular MACD sell signal is only considered valid if the closing price is below the MA value. This suggests a potential downtrend confirmed by the price action staying below the moving average.
Benefits: The MA filter helps identify potential trend continuation opportunities by ensuring the price aligns with the chosen moving average direction.
Combining Filters:
You can choose to use either the ADX filter, the MA filter, or both depending on your strategy preference. Using both filters adds an extra layer of confirmation for your signals.
🔶 Backtesting Module
The backtesting module in this script allows you to visually assess how the filtered MACD strategy would have performed on historical data. Here's a deeper dive into its features:
Backtesting Type: You can choose to backtest for buy signals only, sell signals only, or both. This allows you to analyze the strategy's effectiveness in different market conditions.
Stop-Loss Types: You can define how stop-loss orders are placed:
ATR (Average True Range): This uses a volatility measure (ATR) multiplied by a user-defined factor to set the stop-loss level.
Fixed Point: This allows you to specify a fixed dollar amount or percentage value as the stop-loss.
X bar High/Low: This sets the stop-loss at a certain number of bars (defined by the user) above/below the bar's high (for long positions) or low (for short positions).
Reward-to-Risk Ratio: Define the desired ratio between your potential profit and potential loss on each trade. The backtesting module will calculate take-profit levels based on this ratio and the stop-loss placement.
🔶 Disclaimer:
Use with Caution: This indicator is provided for educational and informational purposes only and should not be considered as financial advice. Users should exercise caution and perform their own analysis before making trading decisions based on the indicator's signals.
Not Financial Advice: The information provided by this indicator does not constitute financial advice, and the creator (UAlgo) shall not be held responsible for any trading losses incurred as a result of using this indicator.
Backtesting Recommended: Traders are encouraged to backtest the indicator thoroughly on historical data before using it in live trading to assess its performance and suitability for their trading strategies.
Risk Management: Trading involves inherent risks, and users should implement proper risk management strategies, including but not limited to stop-loss orders and position sizing, to mitigate potential losses.
No Guarantees: The accuracy and reliability of the indicator's signals cannot be guaranteed, as they are based on historical price data and past performance may not be indicative of future results.

Fractal Breakout Trend Following StrategyOverview
The Fractal Breakout Trend Following Strategy is a trend-following system which utilizes the Willams Fractals and Alligator to execute the long trades on the fractal's breakouts which have a high probability to be the new uptrend phase beginning. This system also uses the normalized Average True Range indicator to filter trades after a large moves, because it's more likely to see the trend continuation after a consolidation period. Strategy can execute only long trades.
Unique Features
Trend and volatility filtering system: Strategy uses Williams Alligator to filter the counter-trend fractals breakouts and normalized Average True Range to avoid the trades after large moves, when volatility is high
Configurable Trading Periods: Users can tailor the strategy to specific market windows, adapting to different market conditions.
Flexible Risk Management: Users can choose the stop-loss percent (by default = 3%) for trades, but strategy also has the dynamic stop-loss level using down fractals.
Methodology
The strategy places stop order at the last valid fractal breakout level. Validity of this fractal is defined by the Williams Alligator indicator. If at the moment of time when price breaking the last fractal price is higher than Alligator's teeth line (8 period SMA shifted 5 bars in the future) this is a valid breakout. Moreover strategy has the additional volatility filtering system using normalized ATR. It calculates the average normalized ATR for last user-defined number of bars and if this value lower than the user-defined threshold value the long trade is executed.
When trade is opened, script places the stop loss at the price higher of two levels: user defined stop-loss from the position entry price or down fractal validation level. The down fractal is valid with the rule, opposite as the up fractal validation. Price shall break to the downside the last down fractal below the Willians Alligator's teeth line.
Strategy has no fixed take profit. Exit level changes with the down fractal validation level. If price is in strong uptrend trade is going to be active until last down fractal is not valid. Strategy closes trade when price hits the down fractal validation level.
Risk Management
The strategy employs a combined approach to risk management:
It allows positions to ride the trend as long as the price continues to move favorably, aiming to capture significant price movements. It features a user-defined stop-loss parameter to mitigate risks based on individual risk tolerance. By default, this stop-loss is set to a 3% drop from the entry point, but it can be adjusted according to the trader's preferences.
Justification of Methodology
This strategy leverages Williams Fractals to open long trade when price has broken the key resistance level to the upside. This resistance level is the last up fractal and is shall be broken above the Williams Alligator's teeth line to be qualified as the valid breakout according to this strategy. The Alligator filtering increases the probability to avoid the false breakouts against the current trend.
Moreover strategy has an additional filter using Average True Range(ATR) indicator. If average value of ATR for the last user-defined number of bars is lower than user-defined threshold strategy can open the long trade according to open trade condition above. The logic here is following: we want to open trades after period of price consolidation inside the range because before and after a big move price is more likely to be in sideways, but we need a trend move to have a profit.
Another one important feature is how the exit condition is defined. On the one hand, strategy has the user-defined stop-loss (3% below the entry price by default). It's made to give users the opportunity to restrict their losses according to their risk-tolerance. On the other hand, strategy utilizes the dynamic exit level which is defined by down fractal activation. If we assume the breaking up fractal is the beginning of the uptrend, breaking down fractal can be the start of downtrend phase. We don't want to be in long trade if there is a high probability of reversal to the downside. This approach helps to not keep open trade if trend is not developing and hold it if price continues going up.
Backtest Results
Operating window: Date range of backtests is 2023.01.01 - 2024.05.01. It is chosen to let the strategy to close all opened positions.
Commission and Slippage: Includes a standard Binance commission of 0.1% and accounts for possible slippage over 5 ticks.
Initial capital: 10000 USDT
Percent of capital used in every trade: 30%
Maximum Single Position Loss: -3.19%
Maximum Single Profit: +24.97%
Net Profit: +3036.90 USDT (+30.37%)
Total Trades: 83 (28.92% win rate)
Profit Factor: 1.953
Maximum Accumulated Loss: 963.98 USDT (-8.29%)
Average Profit per Trade: 36.59 USDT (+1.12%)
Average Trade Duration: 72 hours
These results are obtained with realistic parameters representing trading conditions observed at major exchanges such as Binance and with realistic trading portfolio usage parameters.
How to Use
Add the script to favorites for easy access.
Apply to the desired timeframe and chart (optimal performance observed on 4h and higher time frames and the BTC/USDT).
Configure settings using the dropdown choice list in the built-in menu.
Set up alerts to automate strategy positions through web hook with the text: {{strategy.order.alert_message}}
Disclaimer:
Educational and informational tool reflecting Skyrex commitment to informed trading. Past performance does not guarantee future results. Test strategies in a simulated environment before live implementation

Trade Exit Calculator [MarketSignalsPro]█ OVERVIEW
This Pine Script calculates a Stop Loss and Take Profit order suggestion based on the Average True Range (ATR). This provides a market generated visual reference for the user to better gauge risk and profit potential for their trades. This is not a trade signal system, it is a tool best used in conjunction with an existing system.
█ FEATURES
Inputs:
stopLossMultiplier and takeProfitMultiplier : These are input parameters that allow the user to adjust the multiplier for calculating stop loss and take profit levels.
longIndicator : This input parameter determines whether the script is calculating levels for a long setup (buy) or a short setup (sell).
Variable Initialization:
Various variables are initialized to manage labels, lines, and calculated stop loss and take profit levels.
ATR (Average True Range) is calculated using a period of 14.
Calculation of Stop Loss and Take Profit:
Depending on the value of longIndicator stop loss and take profit levels are not calculated the same way.
For long setups, stop loss is calculated below the closing price and take profit above, while for short setups, it's the opposite.
The calculation involves multiplying the ATR value by the user-defined multipliers and adding or subtracting from the closing price accordingly.
Plotting Lines:
Lines representing the calculated stop loss, take profit, and entry price are plotted on the chart.
Displaying Labels:
Labels displaying the calculated stop loss, take profit, and entry price are shown on the chart alongside the respective lines.
Updating and Deleting Objects:
Existing lines and labels are updated or deleted to ensure only the most recent levels are displayed on the chart.
Final Output:
The script outputs visual representations of stop loss, take profit, and entry price levels on the chart, providing traders with guidance for risk management and profit-taking strategies based on the volatility of the market.
█ CONCLUSION
In summary, this Pine Script enhances trading strategies by calculating and illustrating stop loss and take profit levels based on the Average True Range indicator, offering traders a structured way to manage risk and profit potential.
█ THANKS
Special thanks to Cryptosnagger for taking the time to build this Pine Script and share it freely with the community.

Average True Range (ATR) % KTSLSome traders calculate using percentages when trading. The original ATR indicator calculates using price movements, so it differs for each stock. To avoid this, I changed the ATR indicator to show price movement as a percentage. The red line is the percentage value of the volatility of the original ATR indicator. The white line is 1.6 times the original indicator. The green line is 2.5 times the white line. These values can be adjusted. I wish you good luck.

EMA Buy/Sell Alerts with ATR-based TP/SLI wanted to fill a void in the Tradingview FREE indicators. I have searched far and wide on a moving average alert with ATR based take profits and stop loss. I have attempted a rudimentary version of what I hope to improve upon in the future. Will try and add different moving average options such as simple, hull, RMA, JMA, SSL, WMA, etc. For now, a basic EMA with 3 TP and a SL based on the current ATR should suffice.
I grow tired of the ATR take profits being hidden behind a paywall. Please use the script and add to your favorite indicators as you please.
Please leave feedback for future development.

Multi-Band Breakout IndicatorThe Multi-Band Breakout Indicator was created to help identify potential breakout opportunities in the market. It combines multiple bands (ATR-Based and Donchian) and moving averages to provide valuable insights into the underlying trend and potential breakouts. By understanding the calculations, interpretation, parameter adjustments, potential applications, and limitations of the indicator, traders can effectively incorporate it into their trading strategy.
Calculation:
The indicator utilizes several calculations to plot the bands and moving averages. The length parameter determines the period used for the Average True Range (ATR), which measures volatility. A higher length captures a longer-term view of price movement, while a lower length focuses on shorter-term volatility. The multiplier parameter adjusts the distance of the upper and lower bands from the ATR. A higher multiplier expands the bands, accommodating greater price volatility, while a lower multiplier tightens the bands, reflecting lower volatility. The MA Length parameter determines the period for the moving averages used to calculate the trend and trend moving average. A higher MA Length creates a smoother trend line, filtering out shorter-term fluctuations, while a lower MA Length provides a more sensitive trend line.
The Donchian calculations in the Multi-Band Breakout Indicator play a significant role in identifying potential breakout opportunities and providing additional confirmation for trading signals. In this indicator, the Donchian calculations are applied to the trend line, which represents the average of the upper and lower bands. To calculate the Donchian levels, the indicator uses the Donchian Length parameter, which determines the period over which the highest high and lowest low are calculated. A longer Donchian Length captures a broader price range, while a shorter length focuses on more recent price action. By incorporating the Donchian calculations into the Multi-Band Breakout Indicator, traders gain an additional layer of confirmation for breakout signals.
Interpretation:
The Multi-Band Breakout Indicator offers valuable interpretation for traders. The upper and lower bands represent dynamic levels of resistance and support, respectively. These bands reflect the potential price range within which the asset is expected to trade. The trend line is the average of these bands and provides a central reference point for the overall trend. When the price moves above the upper band, it suggests a potential overbought condition and a higher probability of a pullback. Conversely, when the price falls below the lower band, it indicates a potential oversold condition and an increased likelihood of a bounce. The trend moving average further smooths the trend line, making it easier to identify the prevailing direction.
The crossover of the trend line (representing the average of the upper and lower bands) and the trend moving average holds a significant benefit for traders. This crossover serves as a powerful signal for potential trend changes and breakout opportunities in the market. When the trend line crosses above the trend moving average, it suggests a shift in momentum towards the upside, indicating a potential bullish trend. This provides traders with an early indication of a possible upward movement in prices. Conversely, when the trend line crosses below the trend moving average, it indicates a shift in momentum towards the downside, signaling a potential bearish trend. This crossover acts as an early warning for potential downward price movement. By identifying these crossovers, traders can capture the initial stages of a new trend, enabling them to enter trades at favorable entry points and potentially maximize their profit potential.
Breakout Signals:
For bullish breakouts, the indicator looks for a bullish crossover between the trend line and the trend moving average. This crossover suggests a shift in momentum towards the upside. Additionally, it checks if the current price has broken above the upper band and the previous Donchian high. This confirms that the price is surpassing a previous resistance level, indicating further upward movement.
For bearish breakouts, the indicator looks for a bearish crossunder between the trend line and the trend moving average. This crossunder indicates a shift in momentum towards the downside. It also checks if the current price has broken below the lower band and the previous Donchian low. This confirms that the price is breaking through a previous support level, signaling potential downward movement.
When a bullish or bearish breakout is detected, it suggests a potential trading opportunity. Traders may consider initiating positions in the direction of the breakout, anticipating further price movement in that direction. However, it's important to remember that breakouts alone do not guarantee a successful trade. Other factors, such as market conditions, volume, and confirmation from additional indicators, should be taken into account. Risk management techniques should also be implemented to manage potential losses.
Coloration:
The coloration in the Multi-Band Breakout Indicator is used to visually represent different aspects of the indicator and provide valuable insights to traders. Let's break down the coloration components:
-- Trend/Basis Color : The tColor variable determines the color of the bars based on the relationship between the trend line (trend) and the closing price (close), as well as the relationship between the trend line and the trend moving average (trendMA). If the trend line is above the closing price and the trend moving average is also above the closing price, the bars are colored fuchsia, indicating a potential bullish trend. If the trend line is below the closing price and the trend moving average is also below the closing price, the bars are colored lime, indicating a potential bearish trend. If neither of these conditions is met, the bars are colored yellow, representing a neutral or indecisive market condition.
-- Moving Average Color : The maColor variable determines the color of the filled area between the trend line and the trend moving average. If the trend line is above the trend moving average, the area is filled with a lime color with 70% opacity, indicating a potential bullish trend. Conversely, if the trend line is below the trend moving average, the area is filled with a fuchsia color with 70% opacity, indicating a potential bearish trend. This coloration helps traders visually identify the relationship between the trend line and the trend moving average.
-- highColor and lowColor : The highColor and lowColor variables determine the colors of the high Donchian band (hhigh) and the low Donchian band (llow), respectively. These bands represent dynamic levels of resistance and support. If the highest point in the previous Donchian period (hhigh) is above the upper band, the highColor is set to olive with 90% opacity, indicating a potential resistance level. On the other hand, if the lowest point in the previous Donchian period (llow) is below the lower band, the lowColor is set to red with 90% opacity, suggesting a potential support level. These colorations help traders quickly identify important price levels and assess their significance in relation to the bands.
By incorporating coloration, the Multi-Band Breakout Indicator provides visual cues to traders, making it easier to interpret the relationships between various components and assisting in identifying potential trend changes and breakout opportunities. Traders can use these color cues to quickly assess the prevailing market conditions and make informed trading decisions.
Adjusting Parameters:
The Multi-Band Breakout Indicator offers flexibility through parameter adjustments. Traders can customize the indicator based on their preferences and trading style. The length parameter controls the sensitivity to price changes, with higher values capturing longer-term trends, while lower values focus on shorter-term price movements. By adjusting the parameters, such as the ATR length, multiplier, Donchian length, and MA length, traders can customize the indicator to suit different timeframes and trading strategies. For shorter timeframes, smaller values for these parameters may be more suitable, while longer timeframes may require larger values.
Potential Applications:
The Multi-Band Breakout Indicator can be applied in various trading strategies. It helps identify potential breakout opportunities, allowing traders to enter trades in the direction of the breakout. Traders can use the indicator to initiate trades when the price moves above the upper band or below the lower band, confirming a potential breakout and providing a signal to enter a trade. Additionally, the indicator can be combined with other technical analysis tools, such as support and resistance levels, candlestick patterns, or trend indicators, to increase the probability of successful trades. By incorporating the Multi-Band Breakout Indicator into their trading approach, traders can gain a better understanding of market trends and capture potential profit opportunities.
Limitations:
While the Multi-Band Breakout Indicator is a useful tool, it has some limitations that traders should consider. The indicator performs best in trending markets where price movements are relatively strong and sustained. During ranging or choppy market conditions, the indicator may generate false signals, leading to potential losses. It is crucial to use the indicator in conjunction with other analysis techniques and risk management strategies to enhance its effectiveness. Additionally, traders should consider external factors such as market news, economic events, and overall market sentiment when interpreting the signals generated by the indicator.
By combining multiple bands and moving averages, this indicator offers valuable insights into the underlying trend and helps traders make informed trading decisions. With customization options and careful interpretation, this indicator can be a valuable addition to any trader's toolkit, assisting in identifying potential breakouts, capturing profitable trades, and enhancing overall trading performance.

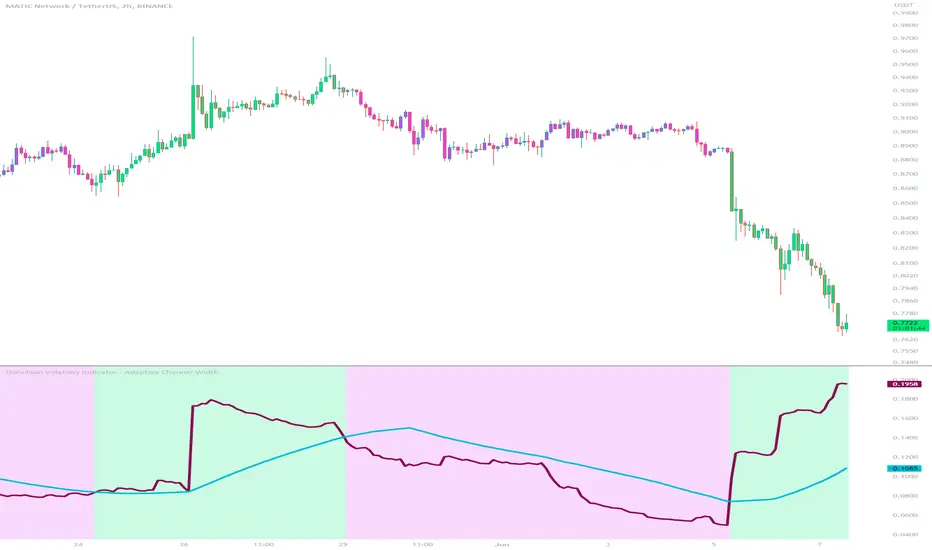
Donchian Volatility Indicator - Adaptive Channel WidthThis indicator is designed to help traders assess and analyze market volatility. By calculating the width of the Donchian channels, it provides valuable insights into the range of price movements over a specified period. This indicator helps traders identify periods of high and low volatility, enabling them to make more informed trading decisions.
The indicator is based on the concept of Donchian channels, which consist of the highest high and lowest low over a specified lookback period. The channel width is calculated as the difference between the upper and lower channels. A wider channel indicates higher volatility, suggesting potentially larger price movements and increased trading opportunities. On the other hand, a narrower channel suggests lower volatility, indicating a relatively calmer market environment with potentially fewer trading opportunities.
The adaptive aspect of the indicator refers to its ability to adjust the width of the channels dynamically based on market conditions. The indicator calculates the width of the channels using the Average True Range (ATR) indicator, which measures the average range of price movements over a specified period. By multiplying the ATR value with the user-defined ATR multiplier, the indicator adapts the width of the channels to reflect the current level of volatility. During periods of higher volatility, the channels expand to accommodate larger price movements, providing a broader range for assessing volatility. Conversely, during periods of lower volatility, the channels contract, reflecting the narrower price ranges and signaling a decrease in volatility. This adaptive nature allows traders to have a flexible and responsive measure of volatility, ensuring that the indicator reflects the current market conditions accurately.
To provide further insights, the indicator includes a signal line. The signal line is derived from the channel width and is calculated as a simple moving average over a specified signal period. This signal line acts as a reference level, allowing traders to compare the current channel width with the average width over a given time frame. By assessing whether the current channel width is above or below the signal line, traders can gain additional context on the volatility level in the market.
The colors used in the Donchian Volatility Indicator - Adaptive Channel Width play a vital role in visualizing the volatility levels:
-- Lime Color : When the channel width is above the signal line, it is colored lime. This color signifies that volatility has entered the market, indicating potentially higher price movements and increased trading opportunities. Traders can pay closer attention to the lime-colored channel width as it may suggest favorable conditions for trend-following or breakout trading strategies.
-- Fuchsia Color : When the channel width is below the signal line, it is colored fuchsia. This color represents relatively low volatility, suggesting a calmer market environment with potentially fewer trading opportunities. Traders may consider adjusting their strategies during periods of low volatility, such as employing range-bound or mean-reversion strategies.
-- Aqua Color : The signal line is represented by the aqua color. This color allows traders to easily identify the signal line amidst the channel width. The aqua color provides a visual reference for the average channel width and helps traders assess whether the current width is above or below this average.
The Donchian Volatility Indicator - Adaptive Channel Width has several practical applications for traders:
-- Volatility Assessment : Traders can use this indicator to assess the level of volatility in the market. By observing the width of the Donchian channels and comparing it to the signal line, they can determine whether the current volatility is relatively high or low. This information helps traders set appropriate expectations and adjust their trading strategies accordingly.
-- Breakout Trading : Wide channel widths may indicate an increased likelihood of price breakouts. Traders can use the Donchian Volatility Indicator - Adaptive Channel Width to identify potential breakout opportunities. When the channel width exceeds the signal line, it suggests a higher probability of significant price movements, potentially signaling a breakout. Traders may consider entering trades in the direction of the breakout.
-- Risk Management : The indicator can assist in setting appropriate stop-loss levels based on the current volatility. During periods of high volatility (lime-colored channel width), wider stop-loss orders may be warranted to account for larger price swings. Conversely, during periods of low volatility (fuchsia-colored channel width), narrower stop-loss orders may be appropriate to limit risk in a more range-bound market.
While the Donchian Volatility Indicator - Adaptive Channel Width is a valuable tool, it is important to consider its limitations:
-- Lagging Indicator : The indicator relies on historical price data, making it a lagging indicator. It provides insights based on past price movements and may not capture sudden changes or shifts in volatility. Traders should be aware that the indicator may not generate real-time signals and should be used in conjunction with other indicators and analysis tools.
-- False Signals : Like any technical indicator, the Donchian Volatility Indicator - Adaptive Channel Width is not immune to generating false signals. Traders should exercise caution and use additional analysis to confirm the signals generated by the indicator. Considering the broader market context and employing risk management techniques can help mitigate the impact of false signals.
-- Market Conditions : Market conditions can vary, and volatility levels can differ across different assets and timeframes. Traders should adapt their strategies and consider other market factors when interpreting the signals provided by the indicator. It is crucial to avoid relying solely on the indicator and to incorporate a comprehensive analysis of the market environment.
In conclusion, this indicator is a powerful tool for assessing market volatility. By examining the width of the Donchian channels and comparing it to the signal line, traders can gain insights into the level of volatility and adjust their trading strategies accordingly. The color-coded representation of the channel width and signal line allows for easy visualization and interpretation of the volatility dynamics. Traders should utilize this indicator as part of a broader trading approach, incorporating other technical analysis tools and considering market conditions for a comprehensive assessment of market volatility.
Take profit and Stop Loss ATR HL [Tcs] | ALGOThis indicator helps traders set stop loss and take profit levels based on either ATR or High-Low range.
The indicator calculates stop loss and take profit levels for both long and short positions, based on the user's input of ATR length, ATR smoothing method, and multiplier levels for each level. It’s possible to set 3 levels of take profit, for both long and short trades.
The indicator also includes the option to show or hide levels, bands, and labels for the calculated stop loss and take profit levels.
Additionally, the indicator has a function to calculate the user's risk based on their account balance, risk percentage, and broker fees.
Overall, this indicator can be helpful for traders who use stop loss and take profit levels in their trading strategies and want a visual representation of those levels on their charts.
Please note that this indicator is for educational purposes only and should not be used for trading without further testing and analysis.

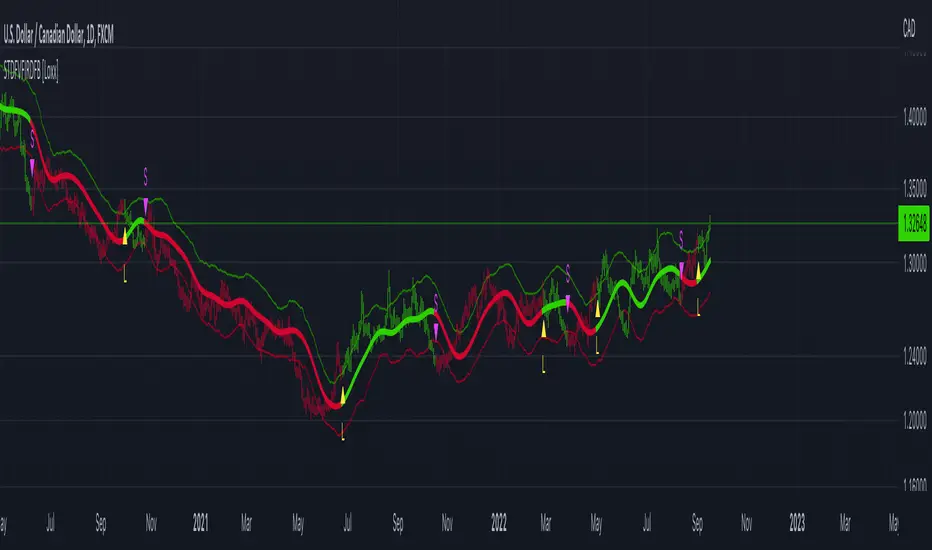
Chandelier Exit ZLSMA StrategyIntroducing a Powerful Trading Indicator: Chandelier Exit with ZLSMA
If you're a trader, you know the importance of having the right tools and indicators to make informed decisions. That's why we're excited to introduce a powerful new trading indicator that combines the Chandelier Exit and ZLSMA: two widely-used and effective indicators for technical analysis.
The Chandelier Exit (CE) is a popular trailing stop-loss indicator developed by Chuck LeBeau. It's designed to follow the price trend of a security and provide an exit signal when the price crosses below the CE line. The CE line is based on the Average True Range (ATR), which is a measure of volatility. This means that the CE line adjusts to the volatility of the security, making it a reliable indicator for trailing stop-losses.
The ZLEMA (Zero Lag Exponential Moving Average) is a type of exponential moving average that's designed to reduce lag and improve signal accuracy. The ZLSMA takes into account not only the current price but also past prices, using a weighted formula to calculate the moving average. This makes it a smoother indicator than traditional moving averages, and less prone to giving false signals.
When combined, the CE and ZLSMA create a powerful indicator that can help traders identify trend changes and make more informed trading decisions. The CE provides the trailing stop-loss signal, while the ZLSMA provides a smoother trend line to help identify potential entry and exit points.
In our indicator, the CE and ZLSMA are plotted together on the chart, making it easy to see both the trailing stop-loss and the trend line at the same time. The CE line is displayed as a dotted line, while the ZLSMA line is displayed as a solid line.
Using this indicator, traders can set their stop-loss levels based on the CE line, while also using the ZLSMA line to identify potential entry and exit points. The combination of these two indicators can help traders reduce their risk and improve their trading performance.
In conclusion, the Chandelier Exit with ZLSMA is a powerful trading indicator that combines two effective technical analysis tools. By using this indicator, traders can identify trend changes, set stop-loss levels, and make more informed trading decisions. Try it out for yourself and see how it can improve your trading performance.
Warning: The results in the backtest are from a repainting strategy. Don't take them seriously. You need to do a dry live test in order to test it for its useability.
-
Here is a description of each input field in the provided source code:
length: An integer input used as the period for the ATR (Average True Range) calculation. Default value is 1.
mult: A float input used as a multiplier for the ATR value. Default value is 2.
showLabels: A boolean input that determines whether to display buy/sell labels on the chart. Default value is false.
isSignalLabelEnabled: A boolean input that determines whether to display signal labels on the chart. Default value is true.
useClose: A boolean input that determines whether to use the close price for extrema calculations. Default value is true.
zcolorchange: A boolean input that determines whether to enable rising/decreasing highlighting for the ZLSMA (Zero-Lag Exponential Moving Average) line. Default value is false.
zlsmaLength: An integer input used as the length for the ZLSMA calculation. Default value is 50.
offset: An integer input used as an offset for the ZLSMA calculation. Default value is 0.
-
Ty for checking this out and good luck on your trading journey! Likes and comments are appreciated. 👍
--
Credits to:
▪ @everget – Chandelier Exit (CE)
▪ @netweaver2022 – ZLSMA

Interactive SAR Stop-Loss [TANHEF]This indicator is "Interactive" which means some inputs can are manually added through the first click after adding the indicator to the chart (SAR Trailing Stop-loss start point).
Unlike the normal Parabolic SAR, this indicator allows for the modification of the start point of the Parabolic SAR’s first bar calculation. Normally, the Parabolic SAR automatically has a start point after the first bar of an asset’s historical price that will then switch between trailing above and below price respectively. It must be noted that due to how the first position of the Parabolic SAR is calculated, on occasion the Parabolic SAR will immediately flip on the next bar to the opposite side relative to price that it was just located. Modifying the setting “⭐Initial Interactive SAR Position Source”, then selecting either 'Clicked' or 'ATR' level as the vertical start position will prevent this. See images below for more explanation.
Why use a trailing stop-loss?
A trailing stop-loss provides an exit when price moves against you but also enables you to move the exit point further into profit when price is moving in the desired direction of a trade. The Parabolic SAR ( stop and reverse ) which is used to determine price direction as well as when price direction is changing, is very effective at functioning as a trailing stop loss.
Indicator Explanation
Initially when this indicator is added to the chart, you will be prompted to select where to begin the SAR Trailing Stop-loss.
For a long stop-loss, select below price.
For a short stop-loss, select above price.
After this indicator is placed, it can be modified via dragging or from within the settings by modifying the time and the price input. Or simply re-add the indicator to the chart. Another option is to have this Parabolic SAR begin directly on the price that was initially ‘Clicked’ or the ‘ATR’ level, which requires selecting the option in settings labeled “⭐Initial Interactive SAR Position Source”
The SAR Stop Loss plotted. Note that the calculation that occurs on this first bar of the ‘Interactive SAR’ is as if the prior bar was the oldest historical bar of the asset. Due to the SAR’s calculations, if the ‘Normal SAR’ were to also flip sides over to the position that has been manually set for the ‘Interactive SAR’, they won’t necessarily have the same result.
An optional fixed profit target can be added within the settings. This profit target will only actively be plotted when the SAR Trailing Stop-loss has not be hit yet or until the profit target has been hit.
Here shows that the profit target was hit, then later on the SAR Trailing Stop-loss was hit.
Note, trailing stop-loss will continue to be plotted until it has been hit regardless of the profit target being hit or not.
Here is an example of when the Parabolic SAR will immediately flip on the next bar to the opposite side relative to price that it was just first located. This is due to how the Parabolic SAR is calculated and will also occur with the traditional Parabolic SAR that is not interactively (manually) given a start location. To prevent this, either relocate this time in which this SAR beings or consider modifying the SAR’s (start, increment, max) settings specifically.
Here instead of using the SAR’s calculation for an initial bar, the ‘ATR’ was selected as the start point within the setting “⭐Initial Interactive SAR Position Source”.
Alerts
1. 'Check' alerts to use within indicator settings (trailing stop hit and/or profit target hit).
2. Select 'Create Alert'
3. Set the condition to 'Interactive SAR''
4. Select create.

STD-Filtered, Variety FIR Digital Filters w/ ATR Bands [Loxx]STD-Filtered, Variety FIR Digital Filters w/ ATR Bands is a FIR Digital Filter indicator with ATR bands. This indicator contains 12 different digital filters. Some of these have already been covered by indicators that I've recently posted. The difference here is that this indicator has ATR bands, allows for frequency filtering, adds a frequency multiplier, and attempts show causality by lagging price input by 1/2 the period input during final application of weights. Period is restricted to even numbers.
The 3 most important parameters are the frequency cutoff, the filter window type and the "causal" parameter.
Included filter types:
- Hamming
- Hanning
- Blackman
- Blackman Harris
- Blackman Nutall
- Nutall
- Bartlet Zero End Points
- Bartlet Hann
- Hann
- Sine
- Lanczos
- Flat Top
Frequency cutoff can vary between 0 and 0.5. General rule is that the greater the cutoff is the "faster" the filter is, and the smaller the cutoff is the smoother the filter is.
You can read more about discrete-time signal processing and some of the windowing functions in this indicator here:
Window function
Window Functions and Their Applications in Signal Processing
What are FIR Filters?
In discrete-time signal processing, windowing is a preliminary signal shaping technique, usually applied to improve the appearance and usefulness of a subsequent Discrete Fourier Transform. Several window functions can be defined, based on a constant (rectangular window), B-splines, other polynomials, sinusoids, cosine-sums, adjustable, hybrid, and other types. The windowing operation consists of multipying the given sampled signal by the window function. For trading purposes, these FIR filters act as advanced weighted moving averages.
A finite impulse response (FIR) filter is a filter whose impulse response (or response to any finite length input) is of finite duration, because it settles to zero in finite time. This is in contrast to infinite impulse response (IIR) filters, which may have internal feedback and may continue to respond indefinitely (usually decaying).
The impulse response (that is, the output in response to a Kronecker delta input) of an Nth-order discrete-time FIR filter lasts exactly {\displaystyle N+1}N+1 samples (from first nonzero element through last nonzero element) before it then settles to zero.
FIR filters can be discrete-time or continuous-time, and digital or analog.
A FIR filter is (similar to, or) just a weighted moving average filter, where (unlike a typical equally weighted moving average filter) the weights of each delay tap are not constrained to be identical or even of the same sign. By changing various values in the array of weights (the impulse response, or time shifted and sampled version of the same), the frequency response of a FIR filter can be completely changed.
An FIR filter simply CONVOLVES the input time series (price data) with its IMPULSE RESPONSE. The impulse response is just a set of weights (or "coefficients") that multiply each data point. Then you just add up all the products and divide by the sum of the weights and that is it; e.g., for a 10-bar SMA you just add up 10 bars of price data (each multiplied by 1) and divide by 10. For a weighted-MA you add up the product of the price data with triangular-number weights and divide by the total weight.
What is a Standard Deviation Filter?
If price or output or both don't move more than the (standard deviation) * multiplier then the trend stays the previous bar trend. This will appear on the chart as "stepping" of the moving average line. This works similar to Super Trend or Parabolic SAR but is a more naive technique of filtering.
Included
Bar coloring
Loxx's Expanded Source Types
Signals
Alerts
Related indicators
STD/C-Filtered, N-Order Power-of-Cosine FIR Filter
STD/C-Filtered, Power-of-Cosine FIR Filter
STD/C-Filtered, Truncated Taylor Family FIR Filter
STD/Clutter-Filtered, Variety FIR Filters
STD/Clutter-Filtered, Kaiser Window FIR Digital Filter
SSL + Wave Trend StrategyStrategy incorporates the following features:
Risk management:
Configurable X% loss per stop loss
Configurable R:R ratio
Trade entry:
Based on strategy conditions below
Trade exit:
Based on strategy conditions below
Backtesting:
Configurable backtesting range by date
Trade drawings:
Each entry condition indicator can be turned on and off
TP/SL boxes drawn for all trades. Can be turned on and off
Trade exit information labels. Can be turned on and off
NOTE: Trade drawings will only be applicable when using overlay strategies
Alerting:
Alerts on LONG and SHORT trade entries
Debugging:
Includes section with useful debugging techniques
Strategy conditions
Trade entry:
LONG
C1: SSL Hybrid baseline is BLUE
C2: SSL Channel crosses up (green above red)
C3: Wave Trend crosses up (represented by pink candle body)
C4: Entry candle height is not greater than configured threshold
C5: Entry candle is inside Keltner Channel (wicks or body depending on configuration)
C6: Take Profit target does not touch EMA (represents resistance)
SHORT
C1: SSL Hybrid baseline is RED
C2: SSL Channel crosses down (red above green)
C3: Wave Trend crosses down (represented by orange candle body)
C4: Entry candle height is not greater than configured threshold
C5: Entry candle is inside Keltner Channel (wicks or body depending on configuration)
C6: Take Profit target does not touch EMA (represents support)
Trade exit:
Stop Loss: Size configurable with NNFX ATR multiplier
Take Profit: Calculated from Stop Loss using R:R ratio
Credits
Strategy is based on the YouTube video "This Unique Strategy Made 47% Profit in 2.5 Months " by TradeSmart.
It combines the following indicators to determine trade entry/exit conditions:
Wave Trend: Indicator: WaveTrend Oscillator by @LazyBear
SSL Channel: SSL channel by @ErwinBeckers
SSL Hybrid: SSL Hybrid by @Mihkel00
Keltner Channels: Keltner Channels Bands by @ceyhun
Candle Height: Candle Height in Percentage - Columns by @FreeReveller
NNFX ATR: NNFX ATR by @sueun123

TFO + ATR Strategy with Trailing Stop LossThis strategy is an experiment to learn what happens when The Trend Flex Oscillator (by Dr. John Ehlers) is used in conjunction with a volatility indicator like ATR. It was designed with cryptocurrency trading in mind.
The way I coded this experiment makes it unsuitable for bear market conditions.
When applied to a bull market, this trend-following strategy will open long positions when oversold price action appear to be reversing. It will typically close a position within a few days unless it gets caught in a bear market, in which case it holds on for dear life. I have tried to make back-testing very simple, but you should never trust it. It's merely and interesting tool for adjusting the many parameters that I've made editable in the configuration window. Those values include the ATR and TFO parameters, as well as setting a trailing stop loss. When closing a position, the strategy can optionally be told to ignore the trend analysis and only obey the trailing stop loss value. I've made an attempt to allow the user to define the minimum profit necessary to allow the strategy to close all all positions. In my observations, the 2H candlestick charts seem to produce the best results, although the parameters of the strategy could theoretically be adjusted to suit other time periods.
In summary...
This strategy has a bias for HODL (Holds on to Losses) meaning that it provides NO STOP LOSS protection!
Also note that the default behavior is designed for up to 15 open long orders, and executes one order to close them all at once.
Opening a long position is predicated on The Trend Flex Oscillator (TFO) rising after being oversold, and ATR above a certain volatility threshold.
Closing a long is handled either by TFO showing overbought while above a certain ATR level, or the Trailing Stop Loss. Pick one or both.
If the strategy is allowed to sell before a Trailing Stop Loss is triggered, you can set a "must exceed %". Do not mistake this for a stop loss.
Short positions are not supported in this version. Back-testing should NEVER be considered an accurate representation of actual trading results.
// portions © allanster (date window code)
// portions © Dr. John Ehlers (Trend Flex Oscillator)
This code is provided for educational purposes only. The results of this strategy should not be considered investment advice.
The user of this script acknowledges that it can result in serious financial loss when used as a trading tool

Trailing Stop AlertsThis script is designed as an ATR-based trailing stop tool to assist in managing open positions.
Once you're involved in a profitable trade, if you add this script to your chart you'll be prompted to select a bar to begin trailing from.
You can then adjust the candle lookback distance for swing high/lows (7 by default), the ATR multiplier (1.0 by default), and the direction to trail (Long/Short).
You can also adjust the ATR period in the settings menu if you want to (14 period by default).
Once the script is added to your chart, it will begin drawing your trailing stop and you can then set up alerts.
Alert Options:
Any alert() function call : Will trigger an alert for both conditions (trailing stop updated, trailing stop hit)
Alert Conditions : Trailing Stop Update will trigger whenever the stop is updated, Trailing Stop Hit will trigger whenever the stop is hit.
Note: the alerts will only fire once per bar close and the trailing stop will not update on realtime bars.
