4All-Alerts Script for an easier setupThis is the alert script for
People have requested this so they can simply favorite and add it to a chart rather then cut and paste. That plus some of the code got converted to ticker data due to simply being in the description.
Happy Trading :)
Buscar en scripts para "alert"

SMA Dow-Flow MTF (SAXO Logical Alert)This script is an advanced MTF (multi-timeframe) monitor that combines the concepts of Dow Theory and SMA (Single Moving Average) to capture the moment when trends align across multiple timeframes. It is particularly focused on visualizing when lower timeframes synchronize with the direction of higher timeframes, without being distracted by short-term noise. 1. Trend Determination Mechanism (Core Logic): Rather than the usual simple determination of whether a price is above or below a moving average, this is based on updates of "low lows and highs." Pivot Detection: Points where the SMA moves in a "V" or "inverted V" shape are recorded as reversal candidates ($lastH$, $lastL$). Trend Reversal Conditions: Uptrend: When the price clearly breaks above the most recent SMA high ($lastH$). Downtrend: When the price clearly breaks below the most recent SMA low ($lastL$). 2. Indicator Features ① Sync Hierarchy: This script counts the degree to which the direction of each time period matches that of the higher time period, starting from the lower time period. The 5-minute time period forms a trend. The 15-minute time period follows the same direction as the 5-minute time period. The 1-hour time period follows the same direction as the 15-minute time period... (continues up to the daily time period). This ensures that an alert is sent out when the larger trend (daily or 4-hourly) swallows up the smaller trend (5-minute or 15-minute). ② Set Selection: You can switch between the "Yen Set (AUDJPY, EURJPY, etc.)" and the "Dollar Set (EURUSD, GBPUSD, etc.)." This allows you to grasp the strength or weakness of a specific currency (e.g., a weak yen or a strong dollar) at a glance.
This script's alert function does not simply sound when the trends match, but is designed to pinpoint the moment when the number of trend synchronizations increases (i.e., when momentum increases).
Below, we will explain in detail how it works and the meaning of the notifications.
1. Alert Conditions
An alert will only be triggered when all three of the following conditions are met.
Increase in Sync Count: For example, if only two time frames, the 5-minute and 15-minute ones, were aligned (Sync: 2), and the 1-hour one also aligns in the same direction (Sync: 3), the alert will be triggered.
Above the set minimum count (alert_min): The default setting is "3." In this case, a notification will be triggered the moment three, four, or five time frames are synchronized.
Selected Set Only: If the "Yen Set" is displayed, an alert will not be triggered even if a currency pair in the Dollar Set is synchronized.
2. How to Read the Alert Message
When you receive a notification, the following message will be displayed.
USDJPY: 4-Bar Synchronization (Upward)
USDJPY: A Currency Pair Gaining Momentum
4-Bar Synchronization: Indicates that the direction of the four timeframes (5-minute, 15-minute, 1-hour, and 4-hour) is consistent, starting with the lowest timeframe.
Upward/Downward: The direction of the synchronization.
このスクリプトは、「ダウ理論」と「移動平均線(SMA)」の考え方を組み合わせ、複数の時間足でトレンドが揃った瞬間を捉えるための高度なMTF(マルチタイムフレーム)モニターです。特に、短期的なノイズに惑わされず、上位足の方向に下位足が同期したタイミングを視覚化することに特化しています。1. トレンド判断の仕組み(コアロジック)通常の「移動平均線より上か下か」という単純な判定ではなく、「押し安値・戻り高値」の更新をベースにしています。ピボットの検知: SMAが「V字」または「逆V字」に動いた地点を、反転の候補($lastH$, $lastL$)として記録します。トレンド転換の条件:上昇トレンド: 価格が直近のSMA高値($lastH$)を明確に上抜けたとき。下落トレンド: 価格が直近のSMA安値($lastL$)を明確に下抜けたとき。2. インジケーターの特徴① 同期(Sync)の階層構造このスクリプトは、下位足から順に「どれだけ上位足と方向が一致しているか」をカウントします。5分足がトレンドを形成。15分足が5分足と同じ方向。1時間足が15分足と同じ方向……(日足まで続く)これにより、「大きな流れ(日足・4時間足)に、小さな流れ(5分・15分)が飲み込まれた瞬間」を逃さずアラート通知します。② セット選択機能「円セット(AUDJPY, EURJPYなど)」と「ドルセット(EURUSD, GBPUSDなど)」を切り替えて表示できます。これにより、特定の通貨の強弱(円安・ドル高など)を一目で把握できるのが強みです。
このスクリプトのアラート機能は、単に「トレンドが一致した」ときに鳴るのではなく、**「トレンドの同期数が増加した瞬間(=勢いが増した瞬間)」**をピンポイントで通知するように設計されています。
以下に、その仕組みと通知内容の意味を詳しく解説します。
1. アラートが発生する条件
アラートは、以下の3つの条件がすべて揃った時にのみ発信されます。
同期数(Sync Count)の増加: 例えば、それまで「5分足と15分足」の2つしか揃っていなかった(Sync: 2)のが、新しく「1時間足」も同じ方向に揃った(Sync: 3)という変化の瞬間に鳴ります。
設定した最小数以上 (alert_min): 初期設定では「3」になっています。この場合、3つ、4つ、または5つの時間足が同期した瞬間に通知が飛びます。
選択中のセットのみ: 「円セット」を表示している時は、ドルセットの通貨ペアが同期してもアラートは鳴りません。
2. アラートメッセージの読み方
通知が来ると、以下のようなメッセージが表示されます。
USDJPY: 4足同期 (上昇)
USDJPY: 勢いが出た通貨ペア
4足同期: 下位足から順に「5分・15分・1時間・4時間」の4つの時間足で方向が一致したことを示します。
上昇 / 下落: その同期している方向です。

teril Second Candle Cross Alert (Intrabar)teril Second Candle Cross Alert
teril Second Candle Cross Alert teril Second Candle Cross Alert teril Second Candle Cross Alert
teril Second Candle Cross Alert

Teril Second Candle Cross Alert (Intrabar)Teril Second Candle Cross Alert
Teril Second Candle Cross Alert
Teril Second Candle Cross Alert
Teril Second Candle Cross Alert

teril final Second Candle Cross Alert (Intrabar) before closeteril final Second Candle Cross Alert (Intrabar) before close
teril final Second Candle Cross Alert (Intrabar) before close
teril final Second Candle Cross Alert (Intrabar) before close
teril final Second Candle Cross Alert (Intrabar) before close

Terilsss Second Same Color Candle Break AlertSecond Same Color Candle Break Alert
Second Same Color Candle Break AlertSecond Same Color Candle Break Alert
Second Same Color Candle Break Alert
Second Same Color Candle Break Alert
Second Same Color Candle Break Alert

Baby ICT Simple Asia H/L + Sweeps + FVG + Alerts + Do-NothingBaby ICT Simple+ is a lightweight, rules-based TradingView indicator designed to help traders visualize key ICT-style concepts without complexity or signal-chasing. It focuses on Asia session liquidity, after, and fair value gapsto su
This tool is intentionally simple and is meant to be used alongside session timing, price action, and risk management — not as a buy/sell signal generator.
🔍 What This Indicator Displays
But
Automatically tracks and plots the Asia session high and low
Fully customizable line colors and width
These levels often act as liquidity pools before London and New York sessions
Liquidity Sweeps (Post-Asia)
Identifies the first time price takes liquidity above or below the Asia range
Sweep detection can be based on wicks or closes
Optional sweep labels help highlight potential stop-run behavior
Asia Break & Sweep Alerts
Alerts when price breaks the Asia high or low after the Asia session ends
Optional alerts for the first sweep only, helping traders focus on high-quality context
Fair Value Gaps (FVGs)
Detects classic 3-candle price imbalances on the active timeframe
Optional filter to show only FVGs that form after a liquidity sweep
Bullish and bearish FVGs are fully customizable with separate fill and border colors
“Do Nothing” Discipline Labels
Optional warning labels during a user-defined kill zone
Designed to discourage over-trading when:
No liquidity has been taken
Price is stuck mid-range
A sweep occurred but no clean displacement or fresh FVG followed
🧠 Intended Use
This indicator supports a “Baby ICT” approach, emphasizing:
Waiting for liquidity to be taken before looking for entries
Using Fair Value Gaps as entry zones, not signals
Avoiding mid-range and low-probability environments
Trading primarily during active sessions (London / New York)
Best used on:
5-minute charts
Index futures (ES, NQ) or liquid FX pairs
With session-based execution and strict risk control
🚫 What This Indicator Is NOT
❌ Not a buy/sell signal tool
❌ Not an automated trading strategy
❌ Not predictive or guaranteed
All trade decisions remain the responsibility of the trader.
⚠️ Risk Disclaimer
Trading involves risk. This indicator is provided for educational and informational purposes only and does not constitute financial advice. Always manage risk responsibly and test any tool thoroughly before using it in live markets.
✨ Final Notes
If you are looking for a clean, non-hype way to visualize:
Where liquidity is likely taken
Where price may rebalance
When it’s best to stand aside
Baby ICT Simple+ was built for that purpose.

FractalMod for TV with breakout alertsFractalsMod (MT4 → Pine) is a TradingView indicator converted from a custom MT4 (MQL4) fractal indicator.
This script replicates the behavior of the original MT4 version as closely as possible, including:
Confirmation-based fractals using left/right bar logic
Persistent horizontal levels derived from confirmed fractals
MT4-style “buffer-like” behavior using segmented horizontal lines
Key Features
MT4-compatible fractal logic
Uses leftbars and rightbars to confirm fractal highs/lows, equivalent to MT4 custom fractal indicators.
Segmented horizontal lines (MT4 buffer style)
Each confirmed fractal starts a new horizontal line segment from the original pivot bar.
When a new fractal is confirmed, the previous segment is stopped at the new pivot point, closely mimicking MT4 indicator buffers.
Latest fractal tracking
The most recently confirmed Up/Down fractal levels are tracked internally and used for breakout detection.
Breakout alerts (not confirmation alerts)
Alerts are triggered when the current price breaks above the latest Up fractal or below the latest Down fractal.
Breakout detection can be configured to use:
Close price only (confirmation-based), or
High/Low including wicks.
Clean visual control
Single arrow per confirmed fractal (no duplicate markers)
Optional display of fractal markers and horizontal lines
Custom colors and line width for Up/Down fractals
Typical Use Cases
Fractal-based support / resistance visualization
Breakout trading using the most recent confirmed fractal levels
MT4 → TradingView workflow migration while preserving indicator behavior
This script is designed for traders familiar with MT4 fractal indicators who want a faithful and practical TradingView equivalent without repainting on confirmed signals.
FractalsMod (MT4 → Pine) は、
MT4(MQL4)で使用されていた カスタム Fractal インジケーターを TradingView(Pine Script)へ移植したものです。
元の MT4 インジケーターの挙動を可能な限り忠実に再現することを目的としており、以下の特徴を持ちます。
主な特徴
MT4互換のフラクタル判定ロジック
leftbars / rightbars を用いたフラクタル確定方式で、
MT4 のカスタム Fractal インジケーターと同等の確定条件を再現しています。
MT4のバッファ挙動を再現した水平ライン
フラクタルが確定すると、その ピボット位置から水平ラインを開始します。
新しいフラクタルが確定した場合、それまでのラインは新しいピボット位置で停止し、
区間ごとのライン構造で MT4 のバッファ表示に近い見た目を実現しています。
最新フラクタル価格の内部保持
直近で確定した Up / Down フラクタル価格を保持し、
ブレイク判定やアラートに利用します。
ブレイク専用アラート(確定時アラートなし)
フラクタル確定時ではなく、
価格が最新の Up フラクタルを上抜けたとき
価格が最新の Down フラクタルを下抜けたとき
にアラートを出す設計です。
ブレイク判定は
終値ベース(ダマシを減らす)
ヒゲ込み(高値 / 安値)
を設定で切り替えられます。
視認性と制御性を重視した設計
フラクタル矢印は 確定時に1本のみ表示(重複なし)
Up / Down で色分けされたラインと矢印
ライン表示・矢印表示の ON / OFF 切り替え可能
想定される用途
フラクタルを用いた サポート / レジスタンスの可視化
直近フラクタルを基準とした ブレイクアウト戦略
MT4 から TradingView への移行時に、
ロジックと見た目をできるだけ変えずに使いたい場合
本スクリプトは、
MT4のフラクタル系インジケーターに慣れたトレーダーが、
TradingViewでも違和感なく使えることを重視して設計されています。

Hedge Mini Calculator (Avg Long/Short + Alerts) with dca
Hedge Mini Calculator is a position-management indicator for traders who use long & short hedging.
It plots:
Long average price
Short average price
Optional hedge close level (+% above hedge average)
The indicator also provides alerts when price reaches the long or short average, helping you manage hedge exits and directional bias with precision.
Designed for risk control, not signals.
🔹 How to Use (Simple & Clear)
1. Enter Your Positions
In the indicator settings:
Add the dollar amount and entry price for each long leg
Add the dollar amount and entry price for each short leg
Set your leverage (default x4)
The indicator does not connect to your exchange.
All values are entered manually.
2. Read the Lines
Avg Long line → average entry of all long positions
Avg Short line → average entry of all short positions
Hedge Close line (optional) → price level where you may close shorts and stay long
3. Use Alerts
You can create alerts for:
Price reaching Avg Long
Price reaching Avg Short
Alerts trigger when the candle touches the average price (high–low range).
4. Manage the Hedge
Typical workflow:
Keep both long & short active while price is inside the range
When price moves favorably and reaches your target level:
Close the hedge leg (usually shorts)
Keep the directional position (longs)
5. PnL Awareness
The info table shows:
Estimated Long PnL
Estimated Short PnL
Net PnL (based on margin & leverage)
These values are approximations for decision support.
⚠️ Disclaimer
This indicator is not a trading signal.
It is a position management tool for hedging, scaling, and risk control.

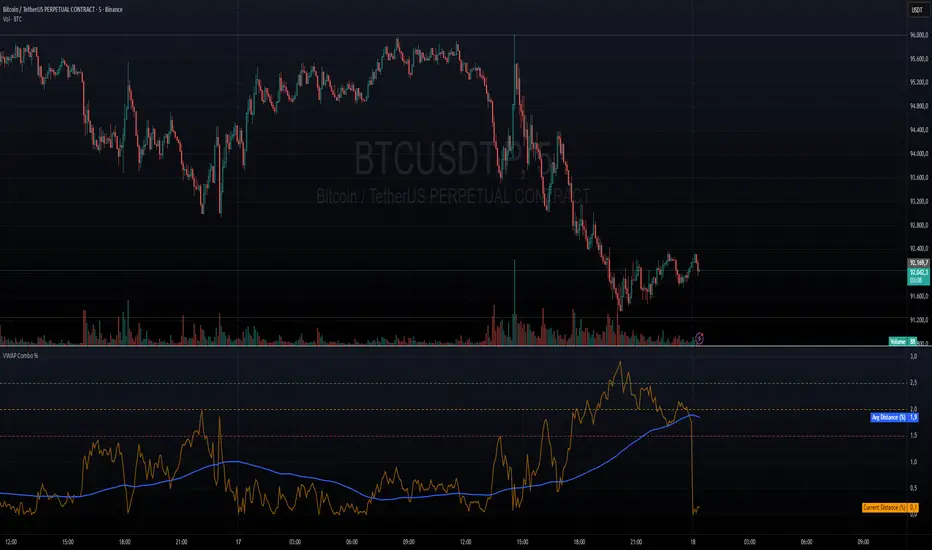
CVD Flow Dashboard [AMT Edition] + Unified AlertsCVD Flow Dashboard – Live Bar Alerts
1️⃣ Purpose of the Tool
The CVD Flow Dashboard is a reaction-based tool. It does not predict the market; it reacts to real-time order flow imbalances:
Detects strong buying/selling pressure (Delta)
Confirms trend alignment (CVD)
Detects absorption and continuation signals
It is designed to show micro (bar-level) and macro (trend) context simultaneously, allowing you to enter trades after a real market reaction occurs, rather than preempting it.
2️⃣ When to Use It
Use this dashboard in real-time trading for reaction trades:
After an attempted market move is absorbed
Market tests a level (high or low of prior bar) but fails — this is absorption.
Example: buyers push price down but sellers absorb → bullish absorption.
Minimum alignment required:
Delta: strong buy/sell delta
CVD: confirms trend direction
Acceptance: continuation candle breaks prior high/low in alignment with delta/CVD
Optional: Sequence (SEQ) — if the next bar continues the acceptance pattern, confidence rises.
Key point: only act after absorption and alignment, never before.
Recommended Integrations for Best Quality Use:
Auction Session Ranges (AMT Edition) – provides session extremes for context and levels.
CVD Flow Labels for Session Ranges – shows delta alignment across session levels.
All-in-One CVD: Failed Auction + Trap + Flow Classifications – adds absorption, trap, and flow classification confluence.
Using these together provides full micro + macro context, improving trade quality and confidence.
3️⃣ Step-by-Step Usage
Step 1: Monitor the Dashboard
Watch Delta, CVD, Acceptance, and Sequence.
Absorption often occurs without immediate alignment — this is the setup stage.
Step 2: Wait for Absorption
Bullish absorption: strong buy delta, failed auction low, price starting upward reaction
Bearish absorption: strong sell delta, failed auction high, price starting downward reaction
Step 3: Confirm the 3 Minimum Boxes
Delta → strong and aligned with absorption
CVD → trend confirmation
Acceptance → bar closes beyond prior high/low
Proceed only if all three align
Step 4: Check for Sequence (Optional)
Next bar continues pattern → higher-confidence setup
Not required, but reinforces trade quality
4️⃣ Entering Trades
Reaction trade: enter immediately once 3 minimum boxes align after absorption / absorption area re-test.
LONG = Bull absorption + CVD bullish + Acceptance
SHORT = Bear absorption + CVD bearish + Acceptance
Sequence bonus: can add to position or widen stop for confidence
5️⃣ Risk Management / Protecting Positions
Initial Stop-Loss: just beyond failed auction extreme (low for bullish, high for bearish)
Trailing Stop / Sequence Protection: trail below prior bar lows/highs if sequence occurs
Avoid Over-Exposure: multiple trades can occur, but only if alignment is verified
Time Sensitivity: reaction trades are intraday/high-frequency — avoid holding overnight without macro confirmation
6️⃣ Practical Tips
Do not trade solely on absorption — wait for minimum 3-box alignment
Use Sequence only as reinforcement
Watch volume spikes and strong delta — often precede absorption/continuation
Best used on 15-minute timeframe ✅ ✅ or higher for swing intraday confirmation; lower timeframes (5 min) for live reaction trades
Combine with Auction Session Ranges, CVD Flow Labels, and All-in-One CVD tools for best quality trade context
✅ Live Bar Alerts
Alerts trigger on the current live bar best, not just at close make sure it continues if you choose to use at close of candle, when:
Bull alignment: Delta + CVD + Acceptance align (Sequence optional)
Bear alignment: Delta + CVD + Acceptance align (Sequence optional)
Alerts continue after bar close if conditions persist, allowing both immediate reaction entries or confirmation at bar close.
✅ Summary Workflow (Reaction Trade Flow)
Market attempts a move → Absorption occurs
Check 3 minimum boxes: Delta + CVD + Acceptance
Optional: Sequence confirms continuation
Enter trade immediately
Place stop-loss just beyond absorption extreme
Use Sequence for trailing stop or scaling confidence
“Let the market react first, then follow the confirmed flow” — this is why it’s a reaction tool, not predictive.

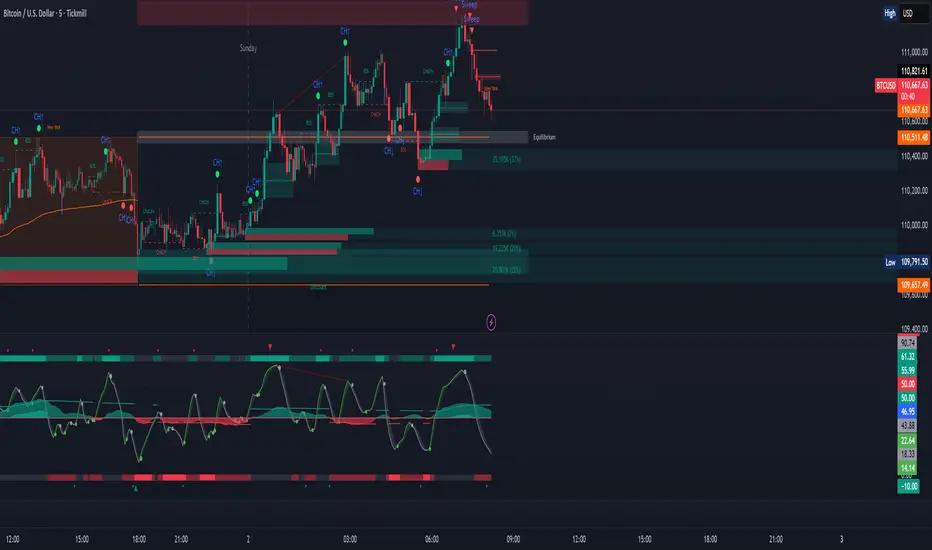
Auction Session Ranges (AMT Edition) [ Alerts] Auction Session Ranges (AMT Edition)
► Overview
The Session Ranges ( AMT Edition) is a session-based market structure and auction analysis tool designed to visually reveal acceptance, rejection, imbalance, and continuation across the Asia, London, and New York CME trading sessions.
Unlike typical indicators, this script is grounded in Auction Market Theory (AMT) and session-based structure, focusing on how price behaves at session extremes rather than relying on lagging calculations, oscillators, or predictive algorithms. Its purpose is to highlight areas where the market has earned the right to be traded, providing traders with a clear, rules-based framework for high-probability directional trades.
Important for backtesting: To properly backtest session extremes, Interaction Lines, and Closest Opposite Extreme Lines, you must use TradingView’s replay mode, as real-time bar-by-bar progression is required to observe how the market interacts with session extremes over time.
► Key Innovations
This is not a conventional session high/low indicator. Its originality comes from several unique design elements:
Differentiates interaction from true acceptance: Price touching an extreme does not automatically indicate directional intent.
Separates directional confirmation from range-bound indecision: Only confirmed crossings beyond the Interaction Line signal actionable bias.
Tracks failed auctions and partial acceptance: No volume profile or order book data required.
Visual, rule-based trade permission: Signals are objective, minimizing subjective interpretation.
Interaction & Closest Opposite Extreme Lines: Together, these lines map how far an auction progresses after an extreme is tested, highlighting continuation, partial acceptance, or failed auctions.
► Core Concepts Explained
1. Session Highs & Lows (Solid Lines)
Plotted continuously for each CME session (Asia, London, New York).
Represent the current auction boundaries for that session.
2. True Interaction Lines (Thick Dotted Lines)
Drawn when price touches or breaks a session extreme:
Touching session high → dotted line at the low of that candle
Touching session low → dotted line at the high of that candle
Auction context:
Touching alone ≠ acceptance
Acceptance occurs only when price moves beyond the Interaction Line and holds
Trading principle:
Price has not crossed → no directional bias → do not trade
Price crosses and holds → directional bias established
3. Acceptance vs Rejection
Accepted direction: Price crosses and holds beyond the Interaction Line
Rejected direction: Price crosses the line but immediately reverses
Neutral / No-Trade: Price trapped between extreme and Interaction Line
Important: Acceptance is conditional and dynamic. Each time price crosses back over the Interaction Line, acceptance is lost.
4. New Extremes = Continuation
Once an Interaction Line is crossed, each new session extreme in that direction reinforces the trend.
Traders should only look for continuation setups along the established directional bias.
AMT interpretation:
Repeated new extremes → directional imbalance
Failure to make new extremes → potential balance or rotation
5. Closest Opposite Extreme Lines (Thin Dotted Lines)
After acceptance, the script tracks price progress toward the opposite session extreme.
Plotted only if price reaches a user-defined percentage of the session range.
Helps identify:
Full acceptance (price reaches opposite extreme)
Partial acceptance (price stalls)
Failed auctions (price cannot progress meaningfully)
Trading guidance once Closest Lines appear:
Partial acceptance: Price stalls near the Closest Line but does not fully reach the opposite extreme → bias remains valid, but the move may be weakening; consider scaling out or tightening stops.
Full acceptance: Price reaches the opposite extreme → directional auction fully confirmed; bias continues, but expect potential rotation or balance afterward.
Failed auction (cannot progress meaningfully): Price reverses before reaching the Closest Line → signals exhaustion; avoid chasing the move and treat as potential trend failure.
Note: Only relevant after Interaction Line is crossed; if price never crosses the Interaction Line, Closest Lines have no trading significance.
► Step-by-Step Usage
Wait for a session extreme
Let price interact with the session high or low.
Observe the Interaction Line
No cross → do not trade
Cross and hold → directional bias established
Trade in the direction of new extremes only
Ignore counter-trend trades unless the Interaction Line is lost
Manage risk using structure
Interaction Line acts as a dynamic invalidation level
Use Closest Lines for context
Partial acceptance → bias valid, watch for weakening
Full acceptance → bias strong, continuation likely
Failed attempt → potential exhaustion, do not chase
Useful for trade management, scaling, and expectation setting
► Price Retests & Pullbacks
Scenario:
Price crosses above the Interaction Line (e.g., from a low interaction).
Over the next 3–4 15-minute bars, price dips back toward the Interaction Line, with wicks touching it but no decisive close below.
Interpretation:
Initial Acceptance Confirmed: Bias remains valid while price holds above/below the line.
Temporary Pullback / Retest: Market is re-evaluating the auction; testing participant agreement.
Wicks Touching the Line: Partial probing or liquidity sweep; market still respects original acceptance.
Trading Implication:
Continuation bias remains intact.
Pullbacks near the Interaction Line offer lower-risk entries.
Decisive close below → acceptance lost, signaling trend failure or invalidation.
Market Psychology:
Healthy auction behavior: extreme tested → acceptance confirmed → boundary retested for liquidity → continuation.
Failure to hold above signals weak acceptance or exhaustion.
✅ Key Takeaways:
Holding above Interaction Line → bias intact, pullback = opportunity
Closing below Interaction Line → acceptance lost, bias invalidated
Wicks touching only → normal retest, still valid
► No-Trade Conditions
Avoid trading when:
Price never crosses the Interaction Line
Price remains trapped between the extreme and the Interaction Line
Market rotates without forming new extremes
These indicate balance, not directional opportunity.
► Alerts
Optional alerts trigger when price crosses an Interaction Line for:
Asia session
London session
New York session
Alerts signal possible acceptance, not automatic trade entries.
► Who This Script Is For
Best suited for traders who:
Trade session structure in futures, indices, or FX
Follow Auction Market Theory principles
Prefer objective, rules-based confirmation
Want fewer but higher-quality trade opportunities
Not intended for:
Indicator stacking
Predictive trading
High-frequency scalping without structure
► Final Notes
This script does not tell you when to buy or sell.
It shows where the market has earned the right to be traded.
Use it as a decision filter, not a prediction engine.

Price Crossing 144 EMA Alert (No Visuals)Price Crossing 144 EMA Alert (No VisuPrice Crossing 144 EMA Alert (No Visuals)Price Crossing 144 EMA Alert (No Visuals)Price Crossing 144 EMA Alert (No Visuals)Price Crossing 144 EMA Alert (No Visuals)als)

Kinetic RSI [Vel + Accel] + AlertsThe Problem with Standard RSI
Most traders use the Relative Strength Index (RSI) to see if a market is "Overbought" (above 70) or "Oversold" (below 30). The problem? A strong trend can stay overbought for days, burning short sellers, or an asset can stay oversold while price continues to crash. Standard RSI tells you where the price is, but it doesn't tell you how hard it is moving.
The Solution: Kinetic RSI
This script reimagines RSI by applying basic physics concepts: Velocity and Acceleration.
Instead of asking "Is RSI below 30?", this indicator asks: "Is RSI below 35 AND did it just make a violent, high-speed turn upwards?"
It filters out lazy, drifting price action and only signals when momentum is accelerating in a new direction.
How It Works (The Math)
Velocity: We calculate the speed of the RSI change (Current RSI - Previous RSI).
Acceleration: We calculate if that speed is increasing (Current Velocity - Previous Velocity).
The Trigger: A signal is only generated if the RSI is in an extreme zone (<35 or >65) AND it has high Velocity AND positive Acceleration.
How to Trade It
1. The "Kick" Signals (Background Highlights)
🟢 Green Background (Bullish Kick): The RSI was low, but buyers stepped in aggressively. The momentum is not just positive; it is accelerating upward. This is often a "V-Bottom" catch.
🔴 Red Background (Bearish Kick): The RSI was high, but sellers slammed the price down. Momentum is accelerating downward.
2. The Line Color
Lime Line: Velocity is positive (Momentum is rising).
Fuchsia Line: Velocity is negative (Momentum is falling).
Usage: If the background flashes Green (Buy Signal), but the line turns back to Fuchsia (Red) a few bars later, the move has failed—exit the trade.
Settings & Alerts
RSI Length: Standard 14 (Adjustable).
Velocity Threshold: Controls sensitivity.
Lower (e.g., 2-3): More signals, catches smaller reversals.
Higher (e.g., 5+): Fewer signals, catches only massive "shocks" to the price.
Alerts Included: You can set alerts for "Bullish Kick," "Bearish Kick," or "Any Kick" to get notified of volatility spikes.
Best Practices
Wait for the Close: This indicator measures the closing velocity. Always wait for the bar to close to confirm the background color signal.
Trend Filtering: This works best as a "Reversal" indicator. If the market is in a super-strong uptrend, ignore the Bearish (Red) signals and only take the Bullish (Green) dips.

teril 1H EMA50 Harami Reversal Alerts BB Touch teril Harami Reversal Alerts BB Touch (Wick Filter Added + 1H EMA50)
teril Harami Reversal Alerts BB Touch (Wick Filter Added + 1H EMA50)
teril Harami Reversal Alerts BB Touch (Wick Filter Added + 1H EMA50)
teril Harami Reversal Alerts BB Touch (Wick Filter Added + 1H EMA50)

teril Harami Reversal Alerts BB Touch (Wick Filter Added) teril Harami Reversal Alerts BB Touch (Wick Filter Added)
teril Harami Reversal Alerts BB Touch (Wick Filter Added) teril Harami Reversal Alerts BB Touch (Wick Filter Added) teril Harami Reversal Alerts BB Touch (Wick Filter Added)
teril Harami Reversal Alerts BB Touch (Wick Filter Added)

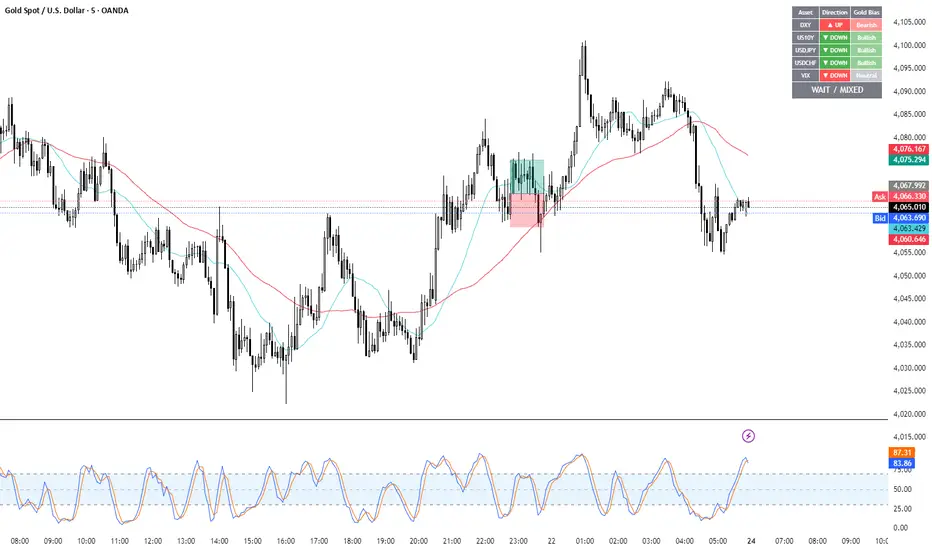
Gold Correlation Dashboard + Alerts [XAUUSD Helper]這是一個專為黃金 (XAUUSD) 交易者設計的 **跨市分析儀表板 (Intermarket Correlation Dashboard)**。
這個指標的核心邏輯基於基本面與資金流向,協助交易者在 10 秒內快速判斷黃金的當前趨勢。它自動監控與黃金高度負相關的資產(美元、美債、日圓),並在圖表上直接顯示多空傾向。
### 📊 監控資產與邏輯
本腳本即時抓取以下關鍵市場數據,並分析其對黃金的影響:
1. **DXY (美元指數)**:黃金最大競爭對手。
- DXY 跌 📉 → 黃金偏多
- DXY 漲 📈 → 黃金偏空
2. **US10Y (10年期美債殖利率)**:黃金的持有成本指標。
- 殖利率跌 📉 → 黃金偏多
- 殖利率漲 📈 → 黃金偏空
3. **USDJPY (美日)** & **USDCHF (美瑞)**:避險資金流向參考。
- 匯率跌 (日圓/瑞郎強) 📉 → 黃金偏多
4. **VIX (恐慌指數)**:市場情緒指標。
- VIX 飆升 📈 → 黃金通常受惠 (避險屬性)
### 🚀 主要功能
1. **即時儀表板**:無需切換視窗,直接在黃金圖表角落查看所有關鍵資產的漲跌狀態。
2. **智能信號總結**:
- 系統會自動計算 **DXY + US10Y + USDJPY** 的綜合方向。
- 當這三大核心指標方向一致時,系統會顯示 **★ STRONG BUY (強力做多)** 或 **★ STRONG SELL (強力做空)**。
- 根據歷史經驗,當這三者同步時,趨勢準確度極高。
3. **警報系統 (Alerts)**:
- 內建警報功能,當出現「強力做多」或「強力做空」信號時,可設定推播通知,不錯過進場機會。
### ⚙️ 如何使用
- 將此指標加載到 XAUUSD (黃金) 的圖表上。
- 建議搭配 H1, H4 或 Daily 時框使用。
- **綠色背景** = 利多黃金 (Bullish)
- **紅色背景** = 利空黃金 (Bearish)
---
*免責聲明:此腳本僅供輔助分析與教育用途,不構成任何投資建議。交易請做好風險控管。*
**Gold (XAUUSD) Intermarket Correlation Dashboard & Alerts**
This indicator is designed for Gold traders who want to combine Technical Analysis with **Fundamental Intermarket Analysis**. It provides a real-time dashboard overlay that monitors key assets highly correlated with XAUUSD.
According to market logic, Gold is heavily influenced by the US Dollar (DXY), US Treasury Yields (US10Y), and global risk sentiment (USDJPY/VIX). This script helps you spot the trend in seconds.
### 📊 Monitored Assets & Logic
The dashboard tracks the real-time direction of the following assets and calculates their impact on Gold:
1. **DXY (US Dollar Index)**: Inverse correlation.
* DXY ↓ = Bullish for Gold
* DXY ↑ = Bearish for Gold
2. **US10Y (US 10-Year Treasury Yield)**: Inverse correlation (Cost of Holding).
* Yields ↓ = Bullish for Gold
* Yields ↑ = Bearish for Gold
3. **USDJPY & USDCHF**: Risk sentiment and currency flow.
* Pair ↓ (Strong JPY/CHF) = Bullish for Gold
4. **VIX (Volatility Index)**: Fear gauge.
* VIX ↑ = Generally Bullish for Gold (Safe Haven demand)
### 🚀 Key Features
**1. Real-Time Dashboard**
View the status of all 5 key assets directly on your XAUUSD chart without switching tabs. The dashboard indicates the "Gold Bias" (Bullish/Bearish) for each asset based on the current timeframe.
**2. Smart Bias Signal ("The 3-Storyline Confirmation")**
The script automatically analyzes the three most critical indicators: **DXY, US10Y, and USDJPY**.
* **★ STRONG BUY ★**: When DXY, US10Y, and USDJPY are **ALL Falling** simultaneously. (High probability setup).
* **★ STRONG SELL ★**: When DXY, US10Y, and USDJPY are **ALL Rising** simultaneously.
**3. Integrated Alerts**
Never miss a setup. You can set alerts to notify you immediately when the "Strong Buy" or "Strong Sell" conditions are met.
### ⚙️ How to Use
1. Add this script to your XAUUSD chart.
2. Works best on H1, H4, or Daily timeframes.
3. Look for the **Summary Row** at the bottom of the dashboard:
* **Green (Strong Buy)**: Look for Long entries.
* **Red (Strong Sell)**: Look for Short entries.
---
*Disclaimer: This script is for educational and informational purposes only. It does not constitute financial advice. Always manage your risk.*
VWAP + VWAP Distance Avg + Alert Lines (%)VWAP Distance & Average Distance Indicator – Detailed Description
The VWAP + VWAP Distance Avg + Alert Lines (%) indicator is designed to measure the distance of the current price from the VWAP (Volume Weighted Average Price), as well as the average distance over a specified period. This tool is particularly useful for traders who use the VWAP as a magnet for price, helping to identify potential trend changes and areas where price may revert toward the VWAP.
Key Features
Current Distance (%)
Calculates the absolute percentage difference between the current price and the VWAP
This line shows how far the price has moved away from the VWAP at any given moment.
Average Distance (%)
Calculates a simple moving average (SMA) of the distance over a specified lookback period.
This provides a reference for typical price deviations from the VWAP, helping traders assess whether the current distance is unusually high or low.
Alert Lines (%)
Allows up to three customizable horizontal alert lines, which can be turned on or off individually.
Each line can be configured with:
Value in percent.
Color.
Line thickness.
These lines serve as visual thresholds, helping traders detect extreme deviations from the VWAP that may precede trend reversals.
Use Case – Detecting Potential Trend Changes
Traders often treat the VWAP as a price magnet, where price tends to revert after significant deviations.
When the current distance exceeds typical average levels or crosses an alert line, it can signal that the price may revert toward the VWAP, potentially indicating a shift in trend or a high-probability mean-reversion scenario.
Disclaimer
This indicator is provided for educational and analytical purposes only. It does not constitute financial advice, and trading decisions are always the sole responsibility of the individual trader. Users should carefully evaluate market conditions and their own risk tolerance before taking any trade.
Better used with VWAP on chart , and be careful around the end of session, for now this works just for session...
still improving on this....
ICT Sweep + CHoCH + FVG Alerts
### 🔥 ICT Sweep + CHoCH + FVG Alerts
Script designed to automate ICT entry confirmations using:
• Liquidity Sweep (Buy/Sell Stops taken)
• Change of Character (CHoCH)
• Fair Value Gap (FVG) confirmation
### ✅ Conditions
**Long signal when:**
1. Bearish liquidity sweep
2. Bullish CHoCH
3. Bullish FVG forms and gets respected
**Short signal when:**
1. Bullish liquidity sweep
2. Bearish CHoCH
3. Bearish FVG forms and gets respected
### 🎯 Purpose
This script helps traders detect smart-money setup entries based on ICT logic and receive alerts in real time.
### 📡 Alerts
Supports webhook automation for bots, signal servers, or trading platforms.
*This script does not place trades automatically, alerts only.*
### ⚠️ Disclaimer
This tool is for educational purposes.
Always backtest and use proper risk management.
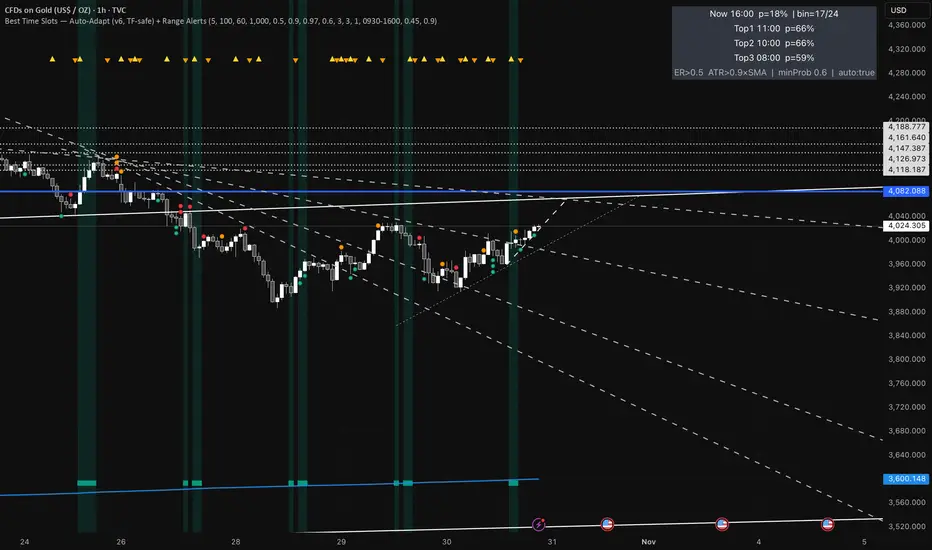
Best Time Slots — Auto-Adapt (v6, TF-safe) + Range AlertsTime & binning
Auto-adapt to timeframe
Makes all time windows scale to your chart’s bar size (so it “just works” on 1m, 15m, 4H, Daily).
• On = recommended. • Off = fixed default lengths.
Minimum Bin (minutes)
The size of each daily time slot we track (e.g., 5-min bins). The script uses the larger of this and your bar size.
• Higher = fewer, broader slots; smoother stats. • Lower = more, narrower slots; needs more history.
• Try: 5–15 on intraday, 60–240 on higher TFs.
Lookback windows (used when Auto-adapt = ON)
Target ER Window (minutes)
How far back we look to judge Efficiency Ratio (how “straight” the move was).
• Higher = stricter/smoother; fewer bars qualify as “movement”. • Lower = more sensitive.
• Try: 60–120 min intraday; 240–600 min for higher TFs.
Target ATR Window (minutes)
How far back we compute ATR (typical range).
• Higher = steadier ATR baseline. • Lower = reacts faster.
• Try: 30–120 min intraday; 240–600 min higher TFs.
Target Normalization Window (minutes)
How far back for the average ATR (the baseline we compare to).
• Higher = stricter “above average range” check. • Lower = easier to pass.
• Try: ~500–1500 min.
What counts as “movement”
ER Threshold (0–1)
Minimum efficiency a bar must have to count as movement.
• Higher = only very “clean, one-direction” bars count. • Lower = more bars count.
• Try: 0.55–0.65. (0.60 = balanced.)
ATR Floor vs SMA(ATR)
Requires range to be at least this many × average ATR.
• Higher (e.g., 1.2) = demand bigger-than-usual ranges. • Lower (e.g., 0.9) = allow smaller ranges.
• Try: 1.0 (above average).
How history is averaged
Recent Days Weight (per-day decay)
Gives more weight to recent days. Example: 0.97 ≈ each day old counts ~3% less.
• Higher (0.99) = slower fade (older days matter more). • Lower (0.95) = faster fade.
• Try: 0.97–0.99.
Laplace Prior Seen / Laplace Prior Hit
“Starter counts” so early stats aren’t crazy when you have little data.
• Higher priors = probabilities start closer to average; need more real data to move.
• Try: Seen=3, Hit=1 (defaults).
Min Samples (effective)
Don’t highlight a slot unless it has at least this many effective samples (after decay + priors).
• Higher = safer, but fewer highlights early.
• Try: 3–10.
When to highlight on the chart
Min Probability to Highlight
We shade/mark bars only if their slot’s historical movement probability is ≥ this.
• Higher = pickier, fewer highlights. • Lower = more highlights.
• Try: 0.45–0.60.
Show Markers on Good Bins
Draws a small square on bars that fall in a “good” slot (in addition to the soft background).
Limit to market hours (optional)
Restrict to Session + Session
Only learn/score inside this time window (e.g., “0930-1600”). Uses the chart/exchange timezone.
• Turn on if you only care about RTH.
Range (chop) alerts
Range START if ER ≤
Triggers range when efficiency drops below this level (price starts zig-zagging).
• Higher = easier to call “range”. • Lower = stricter.
Range START if ATR ≤ this × SMA(ATR)
Also triggers range when ATR shrinks below this fraction of its average (volatility contraction).
• Higher (e.g., 1.0) = stricter (must be at/under average). • Lower (e.g., 0.9) = easier to call range.
Alerts on bar close
If ON, alerts fire once per bar close (cleaner). If OFF, they can trigger intrabar (faster, noisier).
Quick “what happens if I change X?”
Want more highlighted times? ↓ Min Probability, ↓ ER Threshold, or ↓ ATR Floor (e.g., 0.9).
Want stricter highlights? ↑ Min Probability, ↑ ER Threshold, or ↑ ATR Floor (e.g., 1.2).
Want recent days to matter more? ↑ Recent Days Weight toward 0.99.
On 4H/Daily, widen Minimum Bin (e.g., 60–240) and maybe lower Min Probability a bit.
HA Color Change Alerts (fixed v3)📌 Heikin Ashi Color Change Alerts
This indicator notifies you whenever a Heikin Ashi candle changes color (from red → green or green → red).
🔎 Features
Automatic Heikin Ashi calculation
Uses TradingView’s built-in Heikin Ashi source, so you don’t need to switch your chart to HA candles.
Signals on chart
Plots ▲ (green triangle) when HA changes from red → green and ▼ (red triangle) when HA changes from green → red.
Customizable alerts
You can set TradingView alerts for:
“Heikin Ashi Turned GREEN”
“Heikin Ashi Turned RED”
Options
Show/Hide the Heikin Ashi candles on top of your normal chart.
Choose whether alerts trigger only after bar close, or intrabar as soon as the color flips.
Show or hide the signal markers.
🔔 Use cases
Trend following: enter when HA flips to green, exit when it flips back to red.
Early reversal spotting: get notified when the candle momentum shifts.
Works on any symbol and timeframe.

Pro Market Toolkit (TH) v2.4 — S/R + Zones + ATR Bands + Alertsรายละเอียด (ภาษาไทย):
อินดิเคเตอร์ชุดเครื่องมือครบวงจรสำหรับนักเทรด
คำนวณ แนวรับ–แนวต้าน (Support / Resistance) อัตโนมัติจากสวิง (Pivot High/Low)
สร้าง Supply/Demand Zones จาก ATR เพื่อหาพื้นที่กลับตัวสำคัญ
วาดเส้น Moving Average และ ATR Bands เพื่อประเมินแนวโน้มและความผันผวน
แสดงสัญญาณ Breakout และ Bounce/Reject อย่างชัดเจนบนกราฟ
รองรับ Alerts สำหรับ 4 เงื่อนไขสำคัญ: Breakout ขึ้น/ลง, Demand Bounce, Supply Reject
มีตารางแสดง Trend และค่า ATR ปัจจุบัน
เหมาะสำหรับผู้ที่ต้องการดูแนวโน้ม, หาจุดเข้า/ออก และรับการแจ้งเตือนอัตโนมัติ โดยไม่ต้องเฝ้ากราฟตลอดเวลา
Description (English):
A comprehensive trading toolkit indicator for professional traders.
Automatically detects Support/Resistance levels using swing pivots
Generates Supply/Demand Zones based on ATR to highlight potential reversal areas
Plots Moving Average and ATR Bands for trend and volatility analysis
Displays clear signal markers for Breakouts and Zone Bounces/Rejects
Provides Alerts for 4 key conditions: Breakout Up/Down, Demand Bounce, Supply Reject
Includes an on-chart table showing the current Trend and ATR value
Ideal for traders who want automatic key levels, zones, and signal alerts without the need to monitor the chart constantly.

💎 ENJOYBLUE ⏰ Open Price AlertThis Pine Script (version 6) is designed for TradingView to monitor the closing of a user-selected Timeframe (TF) — for example, M30, H1, H4, or D1 — and trigger an alert immediately when that TF’s candle closes. Along with the alert, it displays the current open prices from four higher-level timeframes:
Open MN: Open price of the current monthly candle
Open W1: Open price of the current weekly candle
Open D1: Open price of the current daily candle
Open H4: Open price of the current 4-hour candle
The alert message is formatted into a single compact line to ensure it is fully visible on mobile devices!
~ENJOYBLUE 💎

Smart RSI Divergence PRO | Auto Lines + Alerts📌 Purpose
This indicator automatically detects Regular and Hidden RSI Divergences between price action and the RSI oscillator.
It plots divergence lines directly on the chart, labels signals, and includes alerts for automated monitoring.
🧠 How It Works
1. RSI Calculation
RSI is calculated using the selected Source (default: Close) and RSI Length (default: 14).
2. Divergence Detection via Fractals
Swing points on both price and RSI are detected using fractal logic (5-bar patterns).
Regular Divergence:
Bearish: Price forms a higher high, RSI forms a lower high.
Bullish: Price forms a lower low, RSI forms a higher low.
Hidden Divergence:
Bearish: Price forms a lower high, RSI forms a higher high.
Bullish: Price forms a higher low, RSI forms a lower low.
3. Auto Drawing Lines
Lines are drawn automatically between divergence points:
Red = Regular Bearish
Green = Regular Bullish
Orange = Hidden Bearish
Blue = Hidden Bullish
Line width and transparency are adjustable.
4. Labels and Alerts
Labels mark divergence points with up/down arrows.
Alerts trigger for each divergence type.
📈 How to Use
Use Regular Divergences to anticipate trend reversals.
Use Hidden Divergences to confirm trend continuation.
Combine with support/resistance, trendlines, or volume for higher probability setups.
Recommended Timeframes: Works on all timeframes; more reliable on 1h, 4h, and Daily.
Markets: Forex, Crypto, Stocks.
⚙️ Inputs
Source (Close, HL2, etc.)
RSI Length
Toggle Regular / Hidden Divergence visibility
Toggle Lines / Labels
Line Width & Line Transparency
⚠️ Disclaimer
This script is for educational purposes only. It does not constitute financial advice.
Always test thoroughly before using in live trading.
