TrendMaster Pro 2.3 with Alerts
Hello friends,
A member of the community approached me and asked me how to write an indicator that would achieve a particular set of goals involving comprehensive trend analysis, risk management, and session-based trading controls. Here is one example method of how to create such a system:
Core Strategy Components
Multi-Moving Average System - Uses configurable MA types (EMA, SMA, SMMA) with short-term (9) and long-term (21) periods for primary signal generation through crossovers
Higher Timeframe Trend Filter - Optional trend confirmation using a separate MA (default 50-period) to ensure trades align with broader market direction
Band Power Indicator - Dynamic high/low bands calculated using different MA types to identify price channels and volatility zones
Advanced Signal Filtering
Bollinger Bands Volatility Filter - Prevents trading during low-volatility ranging markets by requiring sufficient band width
RSI Momentum Filter - Uses customizable thresholds (55 for longs, 45 for shorts) to confirm momentum direction
MACD Trend Confirmation - Ensures MACD line position relative to signal line aligns with trade direction
Stochastic Oscillator - Adds momentum confirmation with overbought/oversold levels
ADX Strength Filter - Only allows trades when trend strength exceeds 25 threshold
Session-Based Trading Management
Four Trading Sessions - Asia (18:00-00:00), London (00:00-08:00), NY AM (08:00-13:00), NY PM (13:00-18:00)
Individual Session Limits - Separate maximum trade counts for each session (default 5 per session)
Automatic Session Closure - All positions close at specified market close time
Risk Management Features
Multiple Stop Loss Options - Percentage-based, MA cross, or band-based SL methods
Risk/Reward Ratio - Configurable TP levels based on SL distance (default 1:2)
Auto-Risk Calculation - Dynamic position sizing based on dollar risk limits ($150-$250 range)
Daily Limits - Stop trading after reaching specified TP or SL counts per day
Support & Resistance System
Multiple Pivot Types - Traditional, Fibonacci, Woodie, Classic, DM, and Camarilla calculations
Flexible Timeframes - Auto-adjusting or manual timeframe selection for S/R levels
Historical Levels - Configurable number of past S/R levels to display
Visual Customization - Individual color and display settings for each S/R level
Additional Features
Alert System - Customizable buy/sell alert messages with once-per-bar frequency
Visual Trade Management - Color-coded entry, SL, and TP levels with fill areas
Session Highlighting - Optional background colors for different trading sessions
Comprehensive Filtering - All signals must pass through multiple confirmation layers before execution
This approach demonstrates how to build a professional-grade trading system that combines multiple technical analysis methods with robust risk management and session-based controls, suitable for algorithmic trading across different market sessions.
Good luck and stay safe!
Buscar en scripts para "alert"

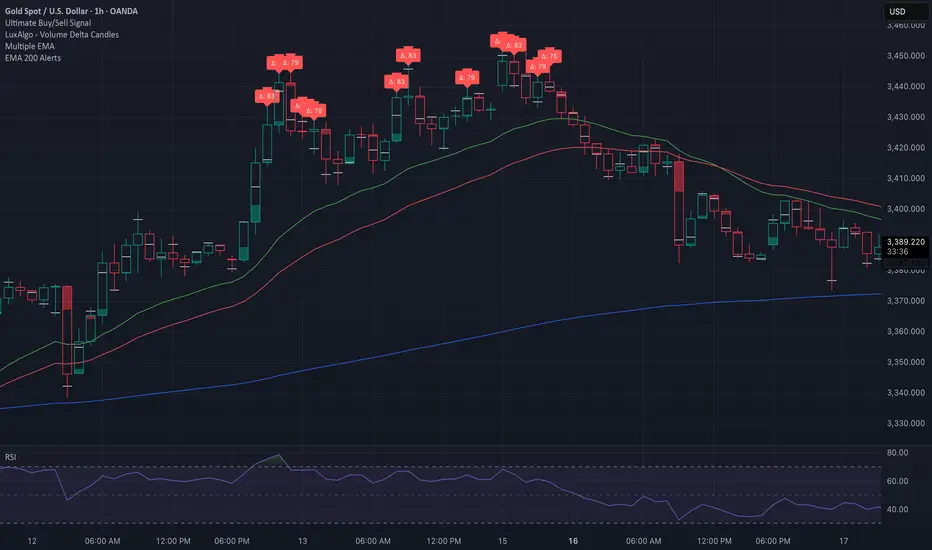
EMA 200 Price Deviation Alerts (1H Only)This script monitors the price deviation from the 200-period Exponential Moving Average (EMA) exclusively on the 1-hour chart. It generates alerts when the absolute difference between the current price and the EMA 200 exceeds a user-defined threshold (default: 65).
Features:
Works only on 1-hour (60-minute) charts to avoid false signals on other timeframes.
Customizable deviation threshold via script input.
Visual display of the 200 EMA on the chart.
Alert system to notify when price deviates significantly above or below the EMA.
Buy/Sell arrows shown when conditions are met:
Sell arrow appears when price is above the EMA and deviation exceeds threshold.
Buy arrow appears when price is below the EMA and deviation exceeds threshold.
Use this tool to identify potential overextended price moves relative to long-term trend support or resistance on the 1H timeframe.
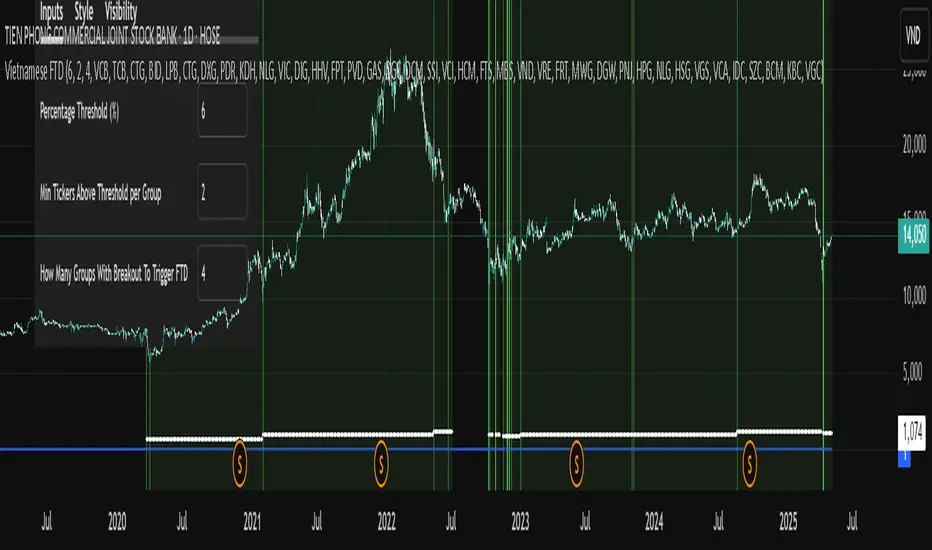
Vietnamese Stock Market FTD (Follow Through Day) AlertA Pine Script implementing William O'Neil’s Follow Through Day (FTD) strategy for the Vietnamese stock market. It scans 7 predefined sector groups (Banks, Real Estate, Retail, etc.) to detect momentum breakouts.
Key Features :
Triggers an FTD signal when ≥X groups (default: 3) have ≥Y stocks (default: 2) rising above a Z% threshold (default: 5%) daily.
Highlights qualifying stocks by group in a dynamic label during alerts.
Visualizes strength via histograms and background shading.
Open-source under Mozilla Public License 2.0 .
Purpose : Identify institutional buying and potential market reversals.
Engulfing Candle Indicator with Single AlertEngulfing Candle Indicator with Alerts
This custom Pine Script indicator identifies Bullish and Bearish Engulfing Candles on the price chart, which are key reversal patterns. A Bullish Engulfing occurs when a smaller bearish candle is completely engulfed by a subsequent bullish candle, signaling a potential upward trend. Conversely, a Bearish Engulfing happens when a bullish candle is engulfed by a following bearish candle, indicating a possible downward trend.
The indicator highlights these patterns on the chart with green arrows for Bullish Engulfing and red arrows for Bearish Engulfing. It also includes an alert system that notifies the user whenever either of these patterns occurs.
The script uses an Average True Range (ATR) filter to ensure that the engulfing candles have sufficient size relative to market volatility. Additionally, users can adjust the minimum engulfing size to fine-tune the signal.

3SMA +30 Stan Weinstein +200WMA +alert-crossingIndicator Description: Stan Weinstein Strategy + Key Moving Averages
🔹 Introduction
This indicator combines the Classic Stan Weinstein Strategy with a modern update based on the author’s latest recommendations. It includes key moving averages that help identify trends and potential entry or exit points in the market.
📊 Included Moving Averages (Fully Customizable)
All moving averages in this indicator have modifiable parameters, allowing users to adjust values in the input settings.
1️⃣ 30-Week SMA (Stan Weinstein): A long-term trend indicator defining the asset’s main trend.
2️⃣ 40-Week SMA (Weinstein Update): An adjusted version recommended by the author in his recent updates.
3️⃣ 10-Day SMA: Displays short-term price action and helps confirm trend changes.
4️⃣ 100-Day SMA: A medium-term trend measure used by traders to assess trend strength.
5️⃣ 200-Day WMA (Weighted Moving Average): A very long-term indicator that filters market noise and confirms solid trends.
🔍 How to Interpret It
✔️ 30/40-Week SMA in an uptrend → Confirms an accumulation phase or an upward price trend.
✔️ Price above the 200-WMA → Indicates a strong and healthy long-term trend.
✔️ 10-SMA crossing other moving averages → Can signal an early entry or exit opportunity.
✔️ 100-SMA vs. 200-WMA → A breakout of the 100-SMA above the 200-WMA may signal a new bullish phase.
🚨 Built-in Alerts (Key Crossovers)
The indicator includes automatic alerts to notify traders when key moving averages cross, allowing timely reactions:
🔔 10-SMA crossing the 40-SMA → Possible medium-term trend shift.
🔔 10-SMA crossing the 200-WMA → Confirmation of a stronger trend.
🔔 40-SMA crossing the 200-WMA → Long-term trend reversal signal.
💡 Customization: All moving average periods can be adjusted in the input settings, making the indicator flexible for different trading strategies.

EMA 200 Price Deviation AlertsThis script is written in Pine Script v5 and is designed to monitor the difference between the current price and its 200-period Exponential Moving Average (EMA). Here’s a quick summary:
200 EMA Calculation: It calculates the 200-period EMA of the closing prices.
Threshold Input: Users can set a threshold (default is 65) that determines when an alert should be triggered.
Price Difference Calculation: The script computes the absolute difference between the current price and the 200 EMA.
Alert Condition: If the price deviates from the 200 EMA by more than the specified threshold, an alert condition is activated.
Visual Aids: The 200 EMA is plotted on the chart for reference, and directional arrows are drawn:
A sell arrow appears above the bar when the price is above the EMA.
A buy arrow appears below the bar when the price is below the EMA.
This setup helps traders visually and programmatically identify significant price movements relative to a key moving average.

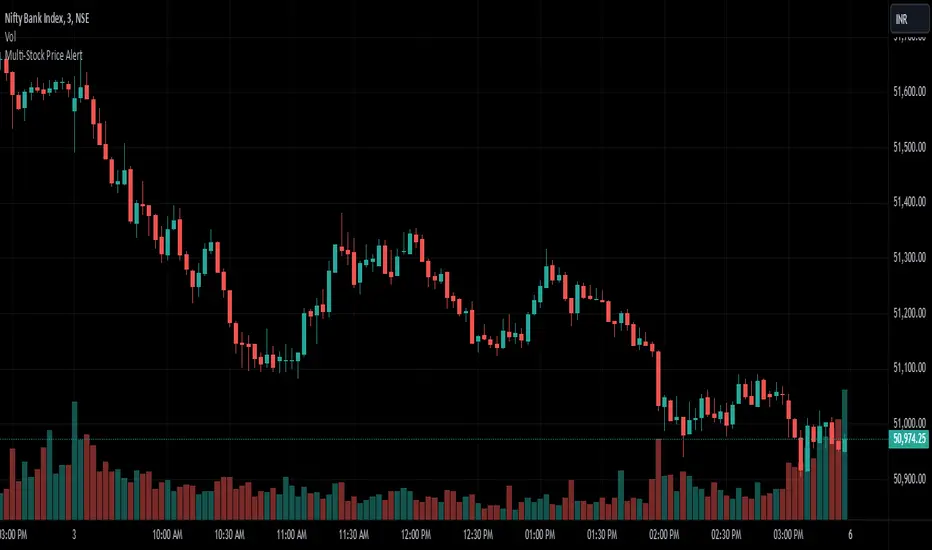
Multi-Stock Price AlertThis indicator is designed to track up to 25 stock tickers and trigger price alerts whenever their respective price targets are reached. The indicator allows users to input ticker symbols and corresponding price targets for multiple stocks. It continuously monitors the stock prices and generates alerts when the current price crosses or equals the specified target.
Buy and Sell Alerts using VWAPThis is my first script, which I hope you'll enjoy.
The script generates alerts for buy and sell trades using VWAP and volume threshold that you select.
Indicators and Moving Averages :
This script allows you to choose which moving averages like VWAP, 9EMA, 10, 20, 50, 100, 200, and 325 SMAs you want to see on your chart.
Volume Threshold :
You can set a volume threshold, which is the minimum required volume required for buy and sell signals to be considered valid. (For example, I like 60,000 on SPY, 5 minute chart.)
Buy and Sell Signals :
The script checks if the stock prices crosses above or below the VWAP and if the trading volume is above the threshold you set.
If the price crosses above the VWAP and the volume is sufficient, a "Buy" signal is generated.
If the price crosses below the VWAP and the volume is sufficient, a "Sell" signal is generated.
This hopefully user-friendly indicator will alert you when certain conditions trading conditions are met, helping to make it a little easier to make informed trading decisions.

KillZones Hunt + Sessions [TradingFinder] Alert & Volume Ranges🟣 Introduction
🔵 Session
Financial markets are divided into various time segments, each with its own characteristics and activity levels. These segments are called sessions, and they are active at different times of the day.
The most important active sessions in financial markets are :
1. Asian Session
2. European Session
3. New York Session
The timing of these major sessions based on the UTC time zone is as follows :
1. Asian Session: 23:00 to 06:00
2. European Session: 07:00 to 16:30
3. New York Session: 13:00 to 22:00
Note
To avoid overlap between sessions and interference in kill zones, we have adjusted the session timings as follows :
• Asian Session: 23:00 to 06:00
• European Session: 07:00 to 14:25
• New York Session: 14:30 to 22:55
🔵 Kill Zones
Kill zones are parts of a session where trader activity is higher than usual. During these periods, trading volume increases and price fluctuations are more intense.
The timing of the major kill zones based on the UTC time zone is as follows :
• Asian Kill Zone: 23:00 to 03:55
• European Kill Zone: 07:00 to 09:55
• New York Morning Kill Zone: 14:30 to 16:55
• New York Evening Kill Zone: 19:30 to 20:55
This indicator focuses on tracking the kill zone and its range. For example, once a kill zone ends, the high and low formed during it remain unchanged.
If the price reaches the high or low of the kill zone while the session is still active, the corresponding line is not drawn any further. Based on this information, various strategies can be developed, and the most important ones are discussed below.
🟣 How to Use
There are three main ways to trade based on the kill zone :
• Kill Zone Hunt
• Breakout and Pullback to Kill Zone
• Trading in the Trend of the Kill Zone
🔵 Kill Zone Hunt
According to this strategy, once the kill zone ends and its high and low lines no longer change, if the price reaches one of these lines within the same session and is strongly rejected, a trade can be entered.
🔵 Breakout and Pullback to Kill Zone
According to this strategy, once the kill zone ends and its high and low lines no longer change, if the price breaks one of these lines strongly within the same session, a trade can be entered on the pullback to that level.
Trading in the Trend of the Kill Zone
We know that kill zones are areas where high-volume trading occurs and powerful trends form. Therefore, trades can be made in the direction of the trend. For example, when an upward trend dominates this area, you can enter a buy trade when the price reaches a demand order block.
🟣 Features
🔵 Alerts
You can set alerts to be notified when the price hits the high or low lines of the kill zone.
🔵 More Information
By enabling this feature, you can view information such as the time and trading volume within the kill zone. This allows you to compare the trading volume with the same period on the previous day or other kill zones.
🟣 Settings
Through the settings, you have access to the following options :
• Show or hide additional information
• Enable or disable alerts
• Show or hide sessions
• Show or hide kill zones
• Set preferred colors for displaying sessions
• Customize the time range of sessions
• Customize the time range of kill zones

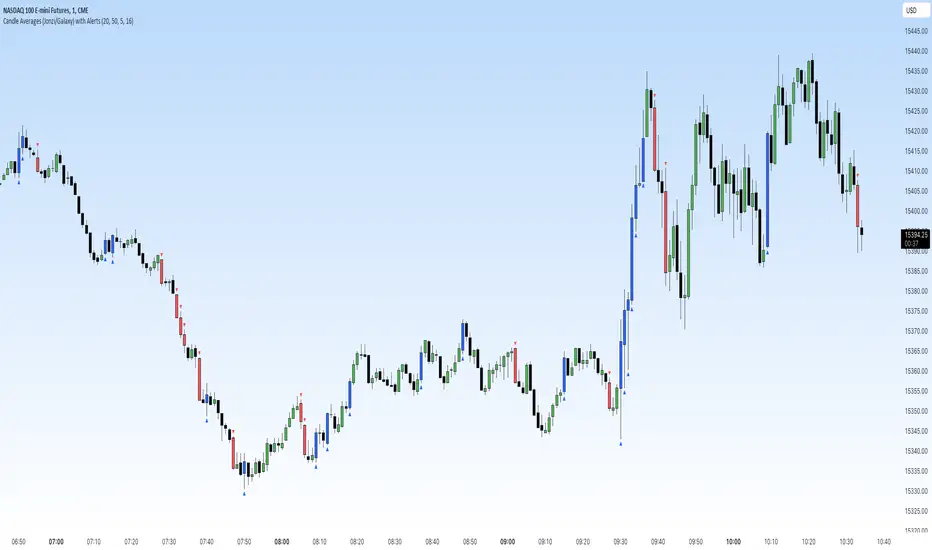
Candle Averages (Jonzi/Galaxy) with AlertsThis indicator is used to highlight outlying candles.
Our script takes the average of the trailing candles and then highlights and/or places a symbol at the candles outside the average.
Example: Your settings use the previous 20 candles and combine the range of each candle.
Divide by 20 and get the average. Let's assume the average is $10
Now if you have your settings at highlighting candles 50% larger than the average, once a candle gets to $15, the indicator would trigger the candle to be highlighted and/or place a symbol of your choice.
In case you don't want to pay attention to the consolidation, you can use the alerts feature. Just go on the timeframe you'd like to be notified on, set an alert for either a down close or up close trigger.
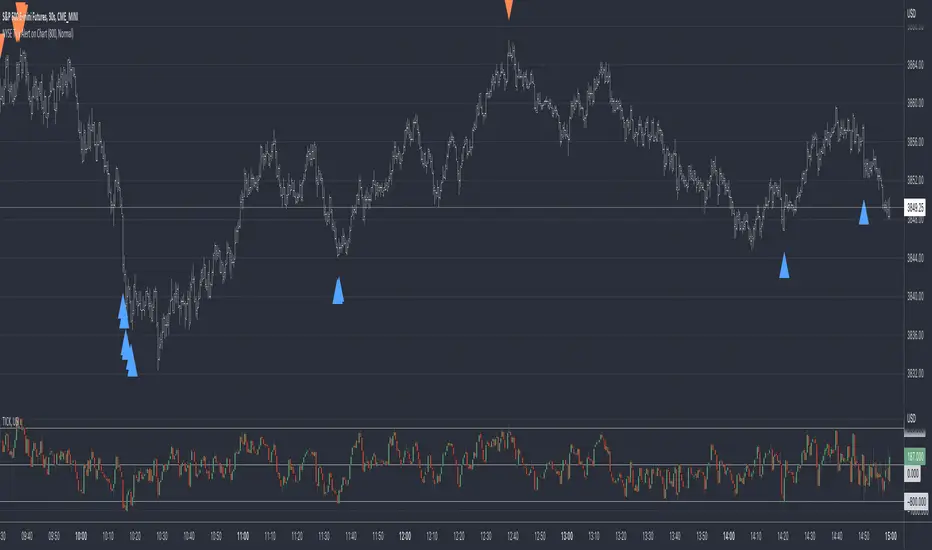
Range Based Signals and AlertsThis script produces a compiled version of rule based signals that is meant to be used mainly on 5 Min timeframe based on daily(as default) Highs and Lows on average and the main purpose is to give user settings to change and adapt based on their needs and make it as adjustable as possible. This entry strategy idea does not belong to me but for TV's in-house rule reasons i can't disclose whose idea it is but i think people that will use this indicator will know who the original idea belongs to.
Rules used for signal production:
- Daily(As default) High-Low points
- Moving Average for detecting reversing of price
- MTF MACD (Daily as default) for detecting overall trend
Signals produced based on extensions of price out of daily zones and when they drop or rise back into moving average. A conditional checker is used for reducing repeated unnecessary signals and alerts.
Happy trading.

Color Changing MACDJapanese below / 日本語説明は下記
This indicator shows MACD with its colors changing based on trend strength.
The purpose of this indicator is to visually understand phases of trends, which are beginning, advancing and ending, measuring the range between MACD line and signal line.
Since MACD is originated from moving average, the range between MACD line and signal line gradually expands as trends progress while the range gets narrowed as trends come closer to the end. The indicator visualizes this characteristics.
The colors change as follows:
Green: In bullish trend, the range between MACD and signal gets expanded from previous candle, which indicates up trends continue
Purple: The range between MACD and signal gets narrowed from previous candle, which indicates trends gradually come to end.
Red: In bearish trend, the range between MACD and signal gets expanded from previous candle, which indicates down trends continue
See the chart below.
Features
Coloring
MACD line and signal line's colors change according to the logic above.
You can also fill the gap between MACD line and signal line with the same color changing logic as lines.
Signals
Golden cross and death cross signals can be displayed.
Alert
Alerts can be set when golden and death crosses occur.
---------------------
トレンドの強弱で色が変わるMACDのインジケーターです。トレンドが初期、進展期、終了期と移り変わる様子を視覚的に判断できることを目的に開発しています。
トレンドの強弱はMACDラインとシグナルラインの幅で判断します。
MACDは移動平均線を元にしたインジケーターであるため、トレンドが進展するにつれMACDラインとシグナルラインの幅は徐々に広がります。一方で、トレンドが終盤に差し掛かかるにつれ上記の幅は狭まります。インジケーターはこのMACDの特徴を色で可視化します。
色は以下の通り変化します。
緑:上昇トレンドにおいて、MACDラインとシグナルラインの幅が前のローソク足のそれよりも拡大している場合
=>トレンドの勢いが強まっていることを示唆
紫:MACDラインとシグナルラインの幅が前のローソク足のそれよりも縮小している場合
=>トレンドの勢いが弱まっていることを示唆
赤:下降トレンドにおいて、MACDラインとシグナルラインの幅が前のローソク足のそれよりも拡大している場合
=>トレンドの勢いが強まっていることを示唆
サンプルチャート
機能
色変更
上記のロジックでMACDとシグナルラインの色を変更します。また両ラインの間をラインと同じロジックで塗りつぶすことも可能です。
シグナル
ゴールデンクロスとデッドクロスでシグナルを表示
アラート
ゴールデンクロスとデッドクロスでアラートを設定可能

Bollinger Band Alert with RSI Filter IndicatorThis code is for a technical analysis indicator called Bollinger Band Alert with RSI Filter. It uses two tools: Bollinger Bands and Relative Strength Index (RSI) to identify potential trading signals in the market.
Bollinger Bands are lines plotted two standard deviations away from a simple moving average of the price of a stock or asset. They help traders determine whether prices are high or low on a relative basis.
The RSI is a momentum indicator that measures the strength of recent price changes to evaluate whether an asset is overbought or oversold.
The code has some input parameters that a user can change, such as length and multiplier, which are used to calculate the Bollinger Bands, and upper and lower RSI levels to define the overbought and oversold zones.
The code then uses if statements to generate alerts if certain conditions are met. The alert condition is triggered if the close price of an asset crosses above or below the upper or lower Bollinger Bands, and if the RSI is either above or below the overbought or oversold threshold levels.
Finally, the code generates plots to visualize the Bollinger Bands and displays triangles above or below the bars indicating when to enter a long or short position based on the strategy's criteria.

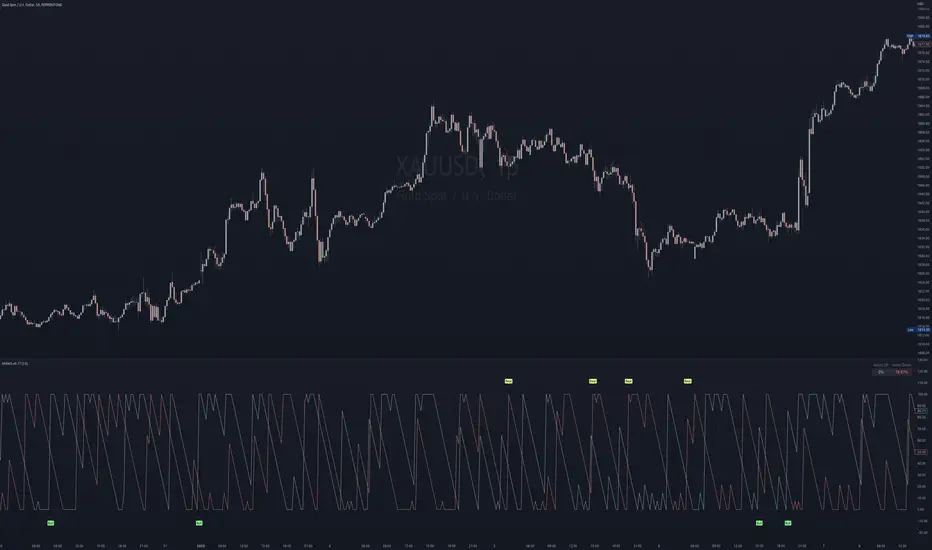
Arron Meter With Alerts [Skiploss]Arron Meter With Alerts is an indicator to identify the trend, and a meter shows the percentage of AroonUP and AroonDown.
Alert Settings
It will be part of a display of bullish and bearish signals by using the condition of the upper line cross lower line and HMA 200 cross under/over EMA 12, and also upper/lower line must be higher than 70%
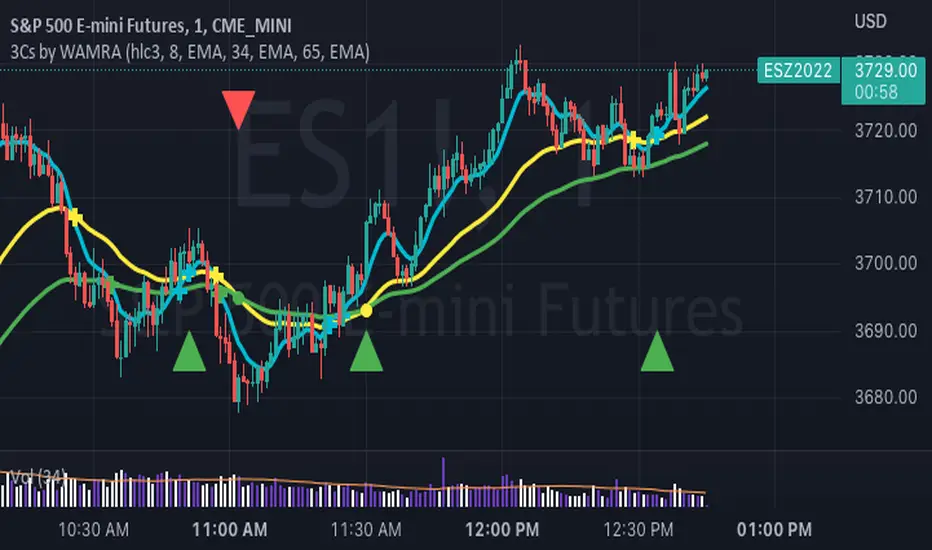
3 Series Cross Indicator with Alerts - by WAMRAThis Indicator allows users to add any 3 combinations of moving averages (SMA, EMA, RMA, RSI, Stochastic RSI, WMA, VWAP ) with granular alert conditions.
Users can alert when all series are in climbing or declining mode.
Williams Fractals with alerts ABCAll the original Williams Fractals algorithm but with a useful way to set up alerts.

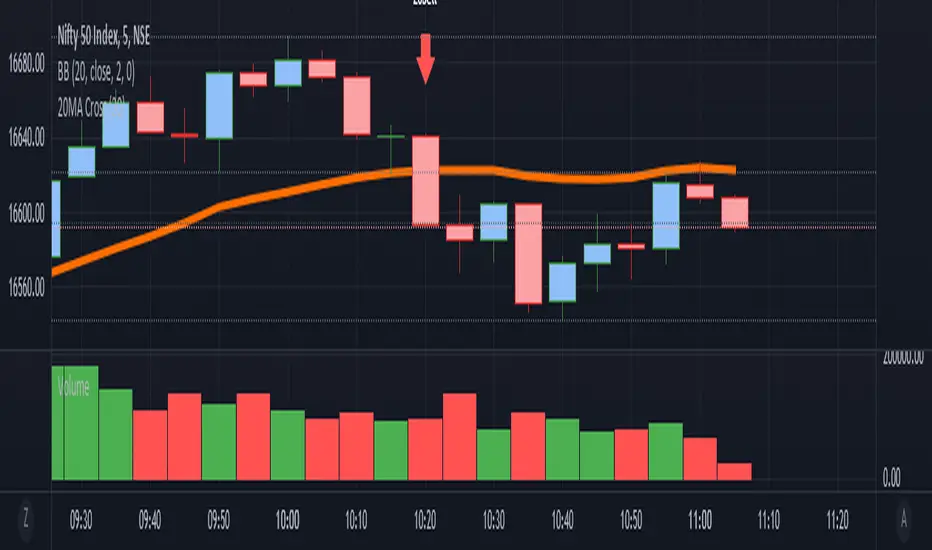
it is a simple Ma cross alert. We can set any ma period.Simple alert for 20MA cross. We can set any ma period.
it plots the crossing candle. This script is purely testing purpose.
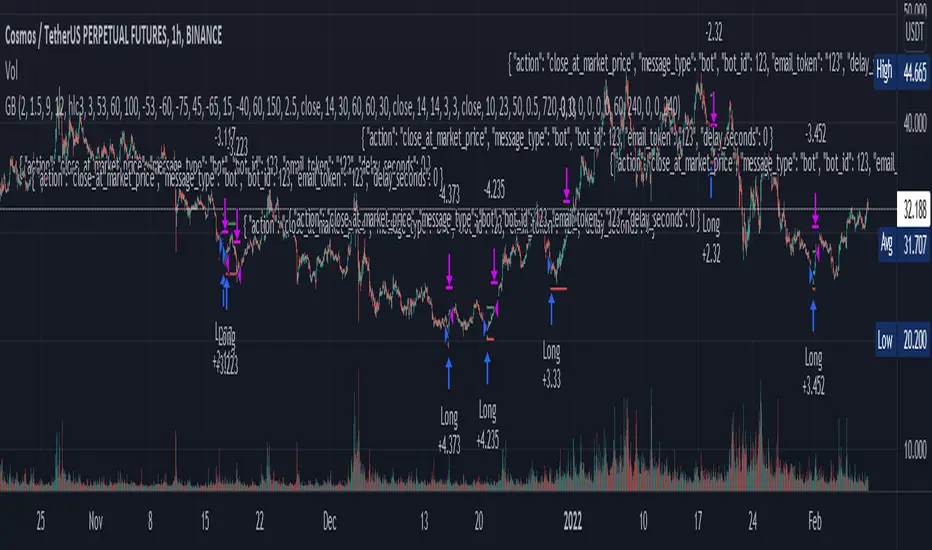
"Golden buy" for cryptofutures (alerts for 3 commas/finandy)This script is a blend of open source cipher B indicator by VuManChu and Hammers & Stars strategy made by ZenAndTheArtOfTrading.
"Golden buy" is based on divergencies and was considered as one of the top strategies for cryptotrading. So I used it for entrance point in this script.
You can turn on opening short positions which are based on divergencies as well.
SL/TP, based on ATR 14, can be tuned, so does Risk/reward ratio.
VuManChu's parameters can be tuned too, but honestly, I don't know how it can help you.
And, finally, you can fully automate your trading with alerts templates presented in the script. (strategy.entry (...//comments= ) - for 3commas and 'alert' function under if conditions for finandy)
Thank you for your attention.
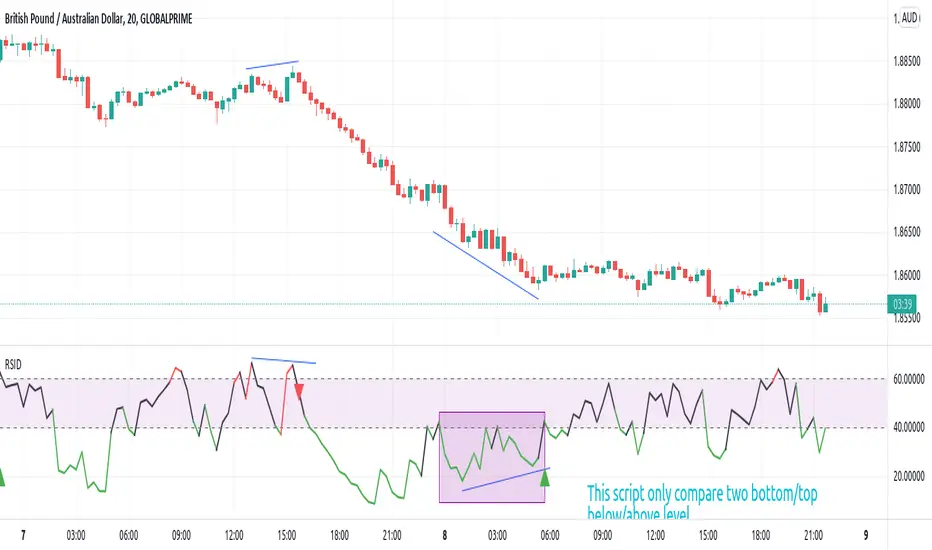
[JL] Relative Strength Index - Divergence AlertThis script displays rsi divergence alert.
Only compare two bottom/top.
Top: RSI decrease and high increase
Bottom: RSI increase and low decrease.
Warning: Please don't only use this signal to trade. Divergences are always early signals need to be confirmed.
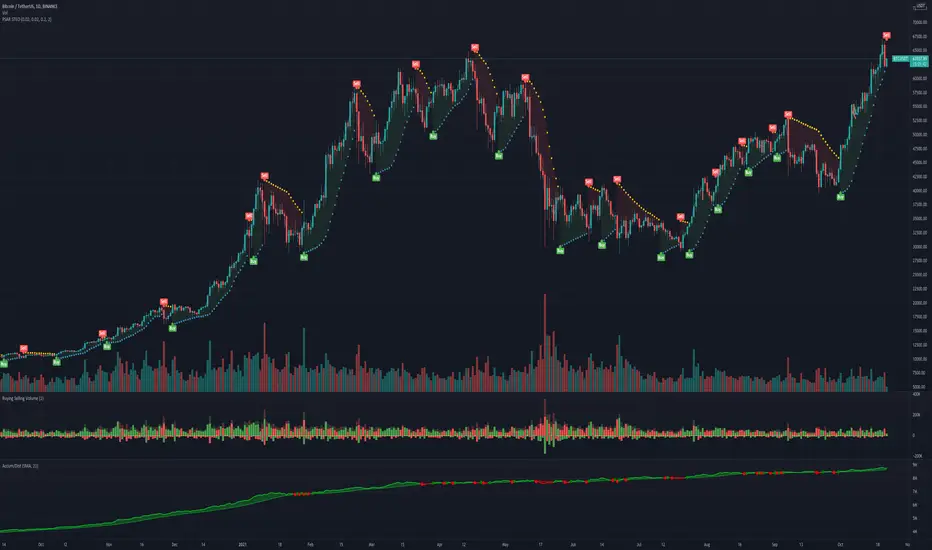
Gann High Low Activator AlertsA Gann High Low Activator within a fixed range meant for alerts. A value of 1 means we're in an uptrend, a value of -1 a downtrend, and a value of 0 is neutral.
Thank you and happy trading

SteO: PSAR with AlertSteO: PSAR with Alert, based on the existing PSAR but with constant long alerts for trading bots
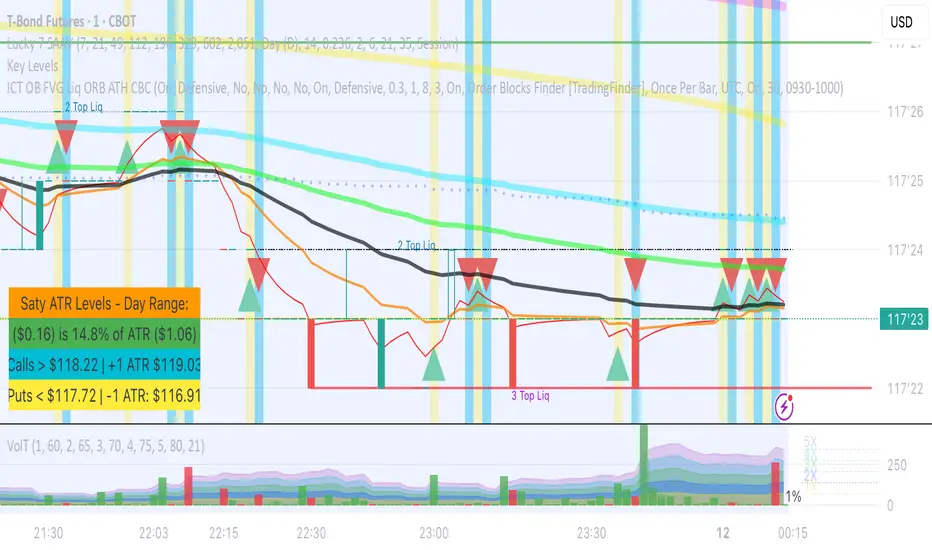
VolT by empowerTVolT is conceived to expose and alert volume volatility.
Using 21-candle moving average volume values compared to the current candle volume, you can graphically see the volume as it comes in - as a percentage of the historic 1X volume moving average.
Getting close to 2X or 5X of the 21-candle SMA? Just glance at the transparent plots behind the volume bars - or the actual percentage value in yellow.
Never wonder again how much volume that bar is compared to previous volume - now you know. Set alerts based on the volume crossing your chosen volume SMA. You'll never be surprised that the hedgies loaded up and left you behind, because you'll be right there loading up with them. (Let me know if you need help setting the alerts...)
As always, your feedback and criticisms are appreciated.