AI - Williams Alligator Strategy (ATR Stop-Loss) AlertsAI - Williams Alligator Strategy (ATR Stop-Loss) with AlertsEstrategia Pine Script®por pjvf9z2myw92
AI Volume StrategyAI Volume Strategy detects significant volume spikes and combines them with trend direction and candlestick color to generate buy and sell signals. The strategy uses an Exponential Moving Average (EMA) of volume to identify abnormal volume spikes that may indicate strong market activity. Additionally, it uses a 50-period EMA of price to filter the trend and decide on entry direction. Key Features: Volume Spike Detection: The strategy detects when the current volume exceeds the EMA of volume by a user-defined multiplier, signaling abnormal increases in market activity. Trend Direction Filter: The strategy uses a 50-period EMA of price to determine the market trend. Buy signals are generated when the price is above the EMA (uptrend), and sell signals are generated when the price is below the EMA (downtrend). Candle Color Filter: The strategy generates a buy signal only when the current candle is bullish (green) and a sell signal only when the current candle is bearish (red). Exit after X Bars: The strategy automatically closes the position after a specified number of bars (default is 5 bars), but the exit condition can be adjusted based on user preference, timeframe, and backtesting results. The default exit is after 5 bars, but users can set it to 1 bar or any other number depending on their preferences and strategy. Signals: Buy Signal: Generated when a volume spike occurs, the trend is upward, and the current candle is bullish. Sell Signal: Generated when a volume spike occurs, the trend is downward, and the current candle is bearish. Alerts: Buy Alert: Alerts the user when a buy signal is triggered. Sell Alert: Alerts the user when a sell signal is triggered. Visualization: Buy Signal: A green label appears below the bar when the buy conditions are met. Sell Signal: A red label appears above the bar when the sell conditions are met. Volume EMA: Optionally, the Volume EMA line can be plotted on the chart to visualize volume trends. This strategy helps traders identify potential entry points based on increased volume activity while considering trend direction and candlestick patterns. With the ability to adjust the exit condition, users can fine-tune the strategy to their specific needs and backtest results.Estrategia Pine Script®por szymonsobkowiak22125
AI Academy: Volume k-NN [PhenLabs]📊 AI Academy: Volume k-NN Version: PineScript™ v6 ━━━━━━━━━━━━━━━━━━━━━━━━━━━━━━━━━━ ━━━━━━━━━━━━━━━━━━━━━━━━━━━━━━━━━━ 📌 Description AI Academy: Volume k-NN (Theory Edition) is an educational indicator designed to demystify how artificial intelligence pattern recognition works directly on your TradingView charts. Rather than being a black-box signal generator, this tool visualizes the entire k-Nearest Neighbors algorithm process in real-time, showing you exactly how AI identifies similar historical patterns and generates predictions. The indicator scans up to 2,000 historical bars to find patterns that match your current price action, then uses an ensemble of the closest matches to project potential future movement. What sets this apart is the integrated “AI Grimoire”—an interactive educational book overlay that teaches core machine learning concepts through four illuminating chapters. Whether you’re a trader curious about AI methodology or a developer learning algorithmic concepts, this indicator transforms abstract machine learning theory into tangible, visual understanding. ━━━━━━━━━━━━━━━━━━━━━━━━━━━━━━━━━━ ━━━━━━━━━━━━━━━━━━━━━━━━━━━━━━━━━━ 🚀 Points of Innovation • First TradingView indicator to visualize k-NN algorithm execution in real-time with full transparency • Interactive “AI Grimoire” educational overlay teaches machine learning concepts while you trade • Dual-mode pattern matching combines price action with optional volume confirmation • Confidence-based opacity system visually communicates prediction reliability • Historical match visualization shows exactly which past patterns informed the prediction • Ghost bar projections display averaged ensemble predictions with adjustable forecast horizons ━━━━━━━━━━━━━━━━━━━━━━━━━━━━━━━━━━ 🔧 Core Components • Pattern Capture Engine: Converts recent price action into logarithmic returns for normalized comparison across different price levels • k-NN Search Algorithm: Calculates Euclidean distance between current pattern and historical patterns to find closest matches • Volume Weighting System: Optional feature that incorporates volume patterns into distance calculations with adjustable influence • Ensemble Predictor: Averages future returns from k-nearest historical matches to generate consensus forecast • Confidence Calculator: Measures average distance of top matches to determine prediction reliability on 0-100% scale • AI Grimoire Display: Table-based educational overlay rendering book-style content with chapter navigation ━━━━━━━━━━━━━━━━━━━━━━━━━━━━━━━━━━ 🔥 Key Features • Adjustable Pattern Length: Define how many bars constitute the current pattern for matching (5-100 bars) • Configurable Search Depth: Control how far back the algorithm searches for historical matches (500-4,900 bars) • Flexible k-Neighbors: Select how many closest matches inform the prediction (1-20 neighbors) • Volume Toggle: Enable or disable volume pattern matching for different market conditions • Volume Influence Slider: Fine-tune the weight given to volume vs. price patterns (0-100%) • Ghost Bar Count: Adjust how many future bars the indicator projects (3-15 bars) • Minimum Confidence Filter: Set threshold to hide low-confidence predictions • Historical Match Display: Toggle visibility of colored boxes marking source patterns ━━━━━━━━━━━━━━━━━━━━━━━━━━━━━━━━━━ 🎨 Visualization • Blue Scanner Box: Highlights current pattern being analyzed labeled “AI INPUT (The Prompt)” • Green Historical Boxes: Mark past patterns where price subsequently moved bullish • Red Historical Boxes: Mark past patterns where price subsequently moved bearish • Ghost Bars: Semi-transparent candles projecting into the future showing predicted price path • Confidence Label: Displays prediction confidence percentage and number of matches used • AI Grimoire Book: Leather-bound book overlay in top-right corner with navigable chapters ━━━━━━━━━━━━━━━━━━━━━━━━━━━━━━━━━━ 📖 Usage Guidelines Algorithm Settings • Pattern Length — Default: 20 | Range: 5-100 | Controls how many recent bars define the pattern. Shorter values find more matches but less specific. Longer values find fewer but more precise matches. • Search Depth — Default: 2000 | Range: 500-4900 | Determines how many historical bars to scan. Higher values find more potential matches but increase computation time. • k-Neighbors — Default: 5 | Range: 1-20 | Number of closest matches to use for prediction. Higher values smooth predictions but may dilute strong signals. • Ghost Bar Count — Default: 5 | Range: 3-15 | How many future bars to project. Shorter horizons are typically more reliable. • Use Volume Matching — Default: Off | When enabled, patterns must match on both price AND volume characteristics. • Volume Influence — Default: 30% | Range: 0-100% | Weight given to volume pattern when volume matching is enabled. Visualization Settings • Bullish/Bearish Match Colors — Customize colors for historical match boxes based on outcome direction. • Min Confidence % — Default: 60 | Predictions below this threshold will not display. • Show Historical Matches — Default: On | Toggle visibility of source pattern boxes on chart. Education Settings • Select Chapter — Navigate through AI Grimoire chapters or keep book closed for clean chart view. ━━━━━━━━━━━━━━━━━━━━━━━━━━━━━━━━━━ ✅ Best Use Cases • Learning how k-Nearest Neighbors algorithm functions in a trading context • Understanding the relationship between historical patterns and forward predictions • Identifying when current market conditions resemble past scenarios • Supplementing discretionary analysis with pattern-based confluence • Teaching others machine learning concepts through visual demonstration • Validating whether volume confirms price pattern formations • Building intuition for what AI “sees” when analyzing charts ━━━━━━━━━━━━━━━━━━━━━━━━━━━━━━━━━━ ⚠️ Limitations • Past pattern similarity does not guarantee future outcome similarity • Requires sufficient historical data (minimum 500+ bars) to function properly • Computation-intensive on lower timeframes with maximum search depth • Cannot predict truly novel “black swan” events not represented in historical data • Volume matching less effective on assets with inconsistent volume reporting • Predictions become less reliable as forecast horizon extends further out • Educational overlay may obstruct chart view on smaller screens ━━━━━━━━━━━━━━━━━━━━━━━━━━━━━━━━━━ 💡 What Makes This Unique • Full Transparency: Unlike black-box AI tools, every step of the algorithm is visualized on your chart • Integrated Education: The AI Grimoire teaches machine learning concepts without leaving TradingView • Theory Meets Practice: See exactly which historical patterns inform each prediction • Honest Uncertainty: Confidence scoring and opacity fading acknowledge when the AI “doesn’t know” • Dual-Mode Analysis: Optional volume weighting adds institutional-quality analysis dimension ━━━━━━━━━━━━━━━━━━━━━━━━━━━━━━━━━━ 🔬 How It Works 1. Pattern Capture: On each bar, the indicator captures the most recent price changes as logarithmic returns, creating a normalized “fingerprint” of current market behavior. If volume matching is enabled, volume changes are captured similarly. 2. Historical Search: The algorithm iterates through up to 2,000 historical bars, calculating the Euclidean distance between the current pattern fingerprint and each historical pattern. Distance combines price similarity and optional volume similarity based on weight settings. 3. Neighbor Selection: All historical patterns are ranked by similarity (lowest distance = most similar). The k-closest matches are selected as the “ensemble council” that will inform the prediction. 4. Confidence Calculation: Average distance of top-k matches determines confidence. Tighter clustering of similar patterns yields higher confidence scores, while scattered or distant matches produce lower confidence. 5. Prediction Generation: Future returns from each historical match (what happened AFTER those patterns) are averaged together. This ensemble average is applied to current price to generate ghost bar projections. 6. Visualization: Historical match locations are marked with colored boxes (green for bullish outcomes, red for bearish). Ghost bars render with opacity tied to confidence level—higher confidence means more solid bars. ━━━━━━━━━━━━━━━━━━━━━━━━━━━━━━━━━━ 💡 Note: This indicator is designed primarily for educational purposes —to help traders understand how AI pattern recognition algorithms function. While the predictions can supplement your analysis, they should never be used as the sole basis for trading decisions. The AI Grimoire chapters explain key concepts including why AI “hallucinates” during unprecedented market events. Always combine with proper risk management and additional confirmation. ━━━━━━━━━━━━━━━━━━━━━━━━━━━━━━━━━━ Indicador Pine Script®por PhenLabs47
AI SuperTrend x Pivot Percentile - Strategy [PresentTrading]█ Introduction and How it is Different The AI SuperTrend x Pivot Percentile strategy is a sophisticated trading approach that integrates AI-driven analysis with traditional technical indicators. Combining the AI SuperTrend with the Pivot Percentile strategy highlights several key advantages: 1. Enhanced Accuracy in Trend Prediction: The AI SuperTrend utilizes K-Nearest Neighbors (KNN) algorithm for trend prediction, improving accuracy by considering historical data patterns. This is complemented by the Pivot Percentile analysis which provides additional context on trend strength. 2. Comprehensive Market Analysis: The integration offers a multi-faceted approach to market analysis, combining AI insights with traditional technical indicators. This dual approach captures a broader range of market dynamics. BTC 6H L/S Performance Local █ Strategy: How it Works - Detailed Explanation 🔶 AI-Enhanced SuperTrend Indicators 1. SuperTrend Calculation: - The SuperTrend indicator is calculated using a moving average and the Average True Range (ATR). The basic formula is: - Upper Band = Moving Average + (Multiplier × ATR) - Lower Band = Moving Average - (Multiplier × ATR) - The moving average type (SMA, EMA, WMA, RMA, VWMA) and the length of the moving average and ATR are adjustable parameters. - The direction of the trend is determined based on the position of the closing price in relation to these bands. 2. AI Integration with K-Nearest Neighbors (KNN): - The KNN algorithm is applied to predict trend direction. It uses historical price data and SuperTrend values to classify the current trend as bullish or bearish. - The algorithm calculates the 'distance' between the current data point and historical points. The 'k' nearest data points (neighbors) are identified based on this distance. - A weighted average of these neighbors' trends (bullish or bearish) is calculated to predict the current trend. For more please check: Multi-TF AI SuperTrend with ADX - Strategy 🔶 Pivot Percentile Analysis 1. Percentile Calculation: - This involves calculating the percentile ranks for high and low prices over a set of predefined lengths. - The percentile function is typically defined as: - Percentile = Value at (P/100) × (N + 1)th position - Where P is the desired percentile, and N is the number of data points. 2. Trend Strength Evaluation: - The calculated percentiles for highs and lows are used to determine the strength of bullish and bearish trends. - For instance, a high percentile rank in the high prices may indicate a strong bullish trend, and vice versa for bearish trends. For more please check: Pivot Percentile Trend - Strategy 🔶 Strategy Integration 1. Combining SuperTrend and Pivot Percentile: - The strategy synthesizes the insights from both AI-enhanced SuperTrend and Pivot Percentile analysis. - It compares the trend direction indicated by the SuperTrend with the strength of the trend as suggested by the Pivot Percentile analysis. 2. Signal Generation: - A trading signal is generated when both the AI-enhanced SuperTrend and the Pivot Percentile analysis agree on the trend direction. - For instance, a bullish signal is generated when both the SuperTrend is bullish, and the Pivot Percentile analysis shows strength in bullish trends. 🔶 Risk Management and Filters - ADX and DMI Filter: The strategy uses the Average Directional Index (ADX) and the Directional Movement Index (DMI) as filters to assess the trend's strength and direction. - Dynamic Trailing Stop Loss: Based on the SuperTrend indicator, the strategy dynamically adjusts stop-loss levels to manage risk effectively. This strategy stands out for its ability to combine real-time AI analysis with established technical indicators, offering traders a nuanced and responsive tool for navigating complex market conditions. The equations and algorithms involved are pivotal in accurately identifying market trends and potential trade opportunities. █ Usage To effectively use this strategy, traders should: 1. Understand the AI and Pivot Percentile Indicators: A clear grasp of how these indicators work will enable traders to make informed decisions. 2. Interpret the Signals Accurately: The strategy provides bullish, bearish, and neutral signals. Traders should align these signals with their market analysis and trading goals. 3. Monitor Market Conditions: Given that this strategy is sensitive to market dynamics, continuous monitoring is crucial for timely decision-making. 4. Adjust Settings as Needed: Traders should feel free to tweak the input parameters to suit their trading preferences and to respond to changing market conditions. █Default Settings and Their Impact on Performance 1. Trading Direction (Default: "Both") Effect: Determines whether the strategy will take long positions, short positions, or both. Adjusting this setting can align the strategy with the trader's market outlook or risk preference. 2. AI Settings (Neighbors: 3, Data Points: 24) Neighbors: The number of nearest neighbors in the KNN algorithm. A higher number might smooth out noise but could miss subtle, recent changes. A lower number makes the model more sensitive to recent data but may increase noise. Data Points: Defines the amount of historical data considered. More data points provide a broader context but may dilute recent trends' impact. 3. SuperTrend Settings (Length: 10, Factor: 3.0, MA Source: "WMA") Length: Affects the sensitivity of the SuperTrend indicator. A longer length results in a smoother, less sensitive indicator, ideal for long-term trends. Factor: Determines the bandwidth of the SuperTrend. A higher factor creates wider bands, capturing larger price movements but potentially missing short-term signals. MA Source: The type of moving average used (e.g., WMA - Weighted Moving Average). Different MA types can affect the trend indicator's responsiveness and smoothness. 4. AI Trend Prediction Settings (Price Trend: 10, Prediction Trend: 80) Price Trend and Prediction Trend Lengths: These settings define the lengths of weighted moving averages for price and SuperTrend, impacting the responsiveness and smoothness of the AI's trend predictions. 5. Pivot Percentile Settings (Length: 10) Length: Influences the calculation of pivot percentiles. A shorter length makes the percentile more responsive to recent price changes, while a longer length offers a broader view of price trends. 6. ADX and DMI Settings (ADX Length: 14, Time Frame: 'D') ADX Length: Defines the period for the Average Directional Index calculation. A longer period results in a smoother ADX line. Time Frame: Sets the time frame for the ADX and DMI calculations, affecting the sensitivity to market changes. 7. Commission, Slippage, and Initial Capital These settings relate to transaction costs and initial investment, directly impacting net profitability and strategy feasibility.Estrategia Pine Script®por PresentTrading1717 4.4 K
AI's Opinion Trading System V21. Complete Summary of the Indicator Script AI’s Opinion Trading System V2 is an advanced, multi-factor trading tool designed for the TradingView platform. It combines several technical indicators (moving averages, RSI, MACD, ADX, ATR, and volume analysis) to generate buy, sell, and hold signals. The script features a customizable AI “consensus” engine that weighs multiple indicator signals, applies user-defined filters, and outputs actionable trade instructions with clear stop loss and take profit levels. The indicator also tracks sentiment, volume delta, and allows for advanced features like pyramiding (adding to positions), custom stop loss/take profit prices, and flexible signal confirmation logic. All key data and signals are displayed in a dynamic, color-coded table on the chart for easy review. 2. Full Explanation of the Table The table is a real-time dashboard summarizing the indicator’s logic and recommendations for the most recent bars. It is color-coded for clarity and designed to help traders quickly understand market conditions and AI-driven trade signals. Columns (from left to right): Column Name What it Shows Bar The time context: “Now” for the current bar, then “Bar -1”, “Bar -2”, etc. for previous bars. Raw Consensus The raw AI consensus for each bar: “Buy”, “Sell”, or “-” (neutral). Up Vol The amount of volume on up (rising) bars. Down Vol The amount of volume on down (falling) bars. Delta The difference between up and down volume. Green if positive, red if negative, gray if neutral. Close The closing price for each bar, color-coded by price change. Sentiment Diff The difference between the close and average sentiment price (a custom sentiment calculation). Lookback The number of bars used for sentiment calculation (if enabled). ADX The ADX value (trend strength). ATR The ATR value (volatility measure). Vol>Avg “Yes” (green) if volume is above average, “No” (red) otherwise. Confirm Whether the AI signal is confirmed over the required bars. Logic Output The AI’s interpreted signal after applying user-selected logic: “Buy”, “Sell”, or “-”. Final Action The final signal after all filters: “Buy”, “Sell”, or “-”. Trade Instruction A plain-English instruction: Buy/Sell/Add/Hold/No Action, with price, stop loss, and take profit. Color Coding: Green: Positive/bullish values or signals Red: Negative/bearish values or signals Gray: Neutral or inactive Blue background: For all table cells, for visual clarity White text: Default, except for color-coded cells 3. Full User Instructions for Every Input/Style Option Below are plain-language instructions for every user-adjustable option in the indicator’s input and style pages: Inputs Table Location What it does: Sets where the summary table appears on your chart. How to use: Choose from 9 positions (Top Left, Top Center, Top Right, etc.) to avoid overlapping with other chart elements. Decimal Places What it does: Controls how many decimal places prices and values are displayed with. How to use: Increase for assets with very small prices (e.g., SHIB), decrease for stocks or forex. Show Sentiment Lookback? What it does: Shows or hides the “Lookback” column in the table, which displays how many bars are used in the sentiment calculation. How to use: Turn off if you want a simpler table. AI View Mode What it does: Selects the logic for how the AI combines signals from different indicators. Majority: Follows the most common signal among all indicators. Weighted: Uses custom weights for each type of signal. Custom: Lets you define your own logic (see below). How to use: Pick the logic style that matches your trading philosophy. AI Consensus Weight / Vol Delta Weight / Sentiment Weight What they do: When using “Weighted” AI View Mode, these let you set how much influence each factor (indicator consensus, volume delta, sentiment) has on the final signal. How to use: Increase a weight to make that factor more important in the AI’s decision. Custom AI View Logic What it does: Lets advanced users write their own logic for when the AI should signal a trade (e.g., “ai==1 and delta>0 and sentiment>0”). How to use: Only use if you understand basic boolean logic. Use Custom Stop Loss/Take Profit Prices? What it does: If enabled, you can enter your own fixed stop loss and take profit prices for buys and sells. How to use: Turn on to override the auto-calculated SL/TP and enter your desired prices below. Custom Buy/Sell Stop Loss/Take Profit Price What they do: If custom SL/TP is enabled, these fields let you set exact prices for stop loss and take profit on both buy and sell trades. How to use: Enter your preferred price, or leave at 0 for auto-calculation. Sentiment Lookback What it does: Sets how many bars the sentiment calculation should look back. How to use: Increase to smooth out sentiment, decrease for faster reaction. Max Pyramid Adds What it does: Limits how many times you can add to an existing position (pyramiding). How to use: Set to 1 for no adds, higher for more aggressive scaling in trends. Signal Preset What it does: Quick-sets a group of signal parameters (see below) for “Robust”, “Standard”, “Freedom”, or “Custom”. How to use: Pick a preset, or select “Custom” to adjust everything manually. Min Bars for Signal Confirmation What it does: Sets how many bars a signal must persist before it’s considered valid. How to use: Increase for more robust, less frequent signals; decrease for faster, but possibly less reliable, signals. ADX Length What it does: Sets the period for the ADX (trend strength) calculation. How to use: Longer = smoother, shorter = more sensitive. ADX Trend Threshold What it does: Sets the minimum ADX value to consider a trend “strong.” How to use: Raise for stricter trend confirmation, lower for more trades. ATR Length What it does: Sets the period for the ATR (volatility) calculation. How to use: Longer = smoother volatility, shorter = more reactive. Volume Confirmation Lookback What it does: Sets how many bars are used to calculate the average volume. How to use: Longer = more stable volume baseline, shorter = more sensitive. Volume Confirmation Multiplier What it does: Sets how much current volume must exceed average volume to be considered “high.” How to use: Increase for stricter volume filter. RSI Flat Min / RSI Flat Max What they do: Define the RSI range considered “flat” (i.e., not trending). How to use: Widen to be stricter about requiring a trend, narrow for more trades. Style Page Most style settings (such as plot colors, label sizes, and shapes) are preset in the script for visual clarity. You can adjust plot visibility and colors (for signals, stop loss, take profit) in the TradingView “Style” tab as with any indicator. Buy Signal: Shows as a green triangle below the bar when a buy is triggered. Sell Signal: Shows as a red triangle above the bar when a sell is triggered. Stop Loss/Take Profit Lines: Red and green lines for SL/TP, visible when a trade is active. SL/TP Labels: Small colored markers at the SL/TP levels for each trade. How to use: Toggle visibility or change colors in the Style tab if you wish to match your chart theme or preferences. In Summary This indicator is highly customizable—you can tune every aspect of the AI logic, risk management, signal filtering, and table display to suit your trading style. The table gives you a real-time, comprehensive view of all relevant signals, filters, and trade instructions. All inputs are designed to be intuitive—hover over them in TradingView for tooltips, or refer to the explanations above for details.Indicador Pine Script®por ChalkBoardAnalyticsActualizado 68
AI Moving Average (Expo)█ Overview The AI Moving Average indicator is a trading tool that uses an AI-based K-nearest neighbors (KNN) algorithm to analyze and interpret patterns in price data. It combines the logic of a traditional moving average with artificial intelligence, creating an adaptive and robust indicator that can identify strong trends and key market levels. █ How It Works The algorithm collects data points and applies a KNN-weighted approach to classify price movement as either bullish or bearish. For each data point, the algorithm checks if the price is above or below the calculated moving average. If the price is above the moving average, it's labeled as bullish (1), and if it's below, it's labeled as bearish (0). The K-Nearest Neighbors (KNN) is an instance-based learning algorithm used in classification and regression tasks. It works on a principle of voting, where a new data point is classified based on the majority label of its 'k' nearest neighbors. The algorithm's use of a KNN-weighted approach adds a layer of intelligence to the traditional moving average analysis. By considering not just the price relative to a moving average but also taking into account the relationships and similarities between different data points, it offers a nuanced and robust classification of price movements. This combination of data collection, labeling, and KNN-weighted classification turns the AI Moving Average (Expo) Indicator into a dynamic tool that can adapt to changing market conditions, making it suitable for various trading strategies and market environments. █ How to Use Dynamic Trend Recognition The color-coded moving average line helps traders quickly identify market trends. Green represents bullish, red for bearish, and blue for neutrality. Trend Strength By adjusting certain settings within the AI Moving Average (Expo) Indicator, such as using a higher 'k' value and increasing the number of data points, traders can gain real-time insights into strong trends. A higher 'k' value makes the prediction model more resilient to noise, emphasizing pronounced trends, while more data points provide a comprehensive view of the market direction. Together, these adjustments enable the indicator to display only robust trends on the chart, allowing traders to focus exclusively on significant market movements and strong trends. Key SR Levels Traders can utilize the indicator to identify key support and resistance levels that are derived from the prevailing trend movement. The derived support and resistance levels are not just based on historical data but are dynamically adjusted with the current trend, making them highly responsive to market changes. █ Settings k (Neighbors): Number of neighbors in the KNN algorithm. Increasing 'k' makes predictions more resilient to noise but may decrease sensitivity to local variations. n (DataPoints): Number of data points considered in AI analysis. This affects how the AI interprets patterns in the price data. maType (Select MA): Type of moving average applied. Options allow for different smoothing techniques to emphasize or dampen aspects of price movement. length: Length of the moving average. A greater length creates a smoother curve but might lag recent price changes. dataToClassify: Source data for classifying price as bullish or bearish. It can be adjusted to consider different aspects of price information dataForMovingAverage: Source data for calculating the moving average. Different selections may emphasize different aspects of price movement. ----------------- Disclaimer The information contained in my Scripts/Indicators/Ideas/Algos/Systems does not constitute financial advice or a solicitation to buy or sell any securities of any type. I will not accept liability for any loss or damage, including without limitation any loss of profit, which may arise directly or indirectly from the use of or reliance on such information. All investments involve risk, and the past performance of a security, industry, sector, market, financial product, trading strategy, backtest, or individual's trading does not guarantee future results or returns. Investors are fully responsible for any investment decisions they make. Such decisions should be based solely on an evaluation of their financial circumstances, investment objectives, risk tolerance, and liquidity needs. My Scripts/Indicators/Ideas/Algos/Systems are only for educational purposes! Indicador Pine Script®por ZeiiermanActualizado 1616 4 K
AI Market Assistant [FundedLab]AI Market Assistant – Your Institutional-Grade Co-Pilot Do you know exactly where you stand in the market cycle? Most retail traders fail because they trade against the dominant trend. I created the AI Market Assistant to solve this problem. It is a comprehensive dashboard that processes multi-timeframe data and Macroeconomics to provide a clear, objective market bias. ⚙️ Customizable Trend Logic: The system adapts to your specific trading personality: Fully Adjustable Timeframes: You are not limited to the default settings. You can freely select your preferred Lower Timeframe (LTF) and Higher Timeframe (HTF) in the settings to match your scalping or swing trading strategy. Select "VWAP" for Intraday Precision : Ideal for catching moves that align with today’s institutional volume. Select "EMA 200" for Swing Structure : Ideal for holding positions and riding the broader market wave. 🚀 Advanced Capabilities: Macro Analysis Panel: Automatically analyzes the Dollar Index (DXY) and US10Y Yields to determine if the macro environment supports your trade (Bullish vs. Bearish Impact). Multi-Language Support: Fully localized for 🇹🇭 🇬🇧 🇨🇳 🇰🇷. Zero-Lag Decision Engine: Utilizing "Stable Mode" to ensure signals are confirmed on closed bars—eliminating false signals and repainting. 💡 Why You Need This Tool: No More Noise: The AI filters out choppy markets (Sideways) and tells you to "WAIT" instead of forcing a trade. Conflict Detection: It checks if the Short-term trend (LTF) agrees with the Long-term trend (HTF). If they disagree, it saves you from a bad trade. Macro Safety: Real-time warnings based on DXY/Bond movements. Don't buy Gold if the DXY is skyrocketing—this tool warns you first. Level up your trading desk with the same data the pros use.Indicador Pine Script®por FundedLab30
AI Trend Momentum SniperThe AI Trend Momentum Sniper is a powerful technical analysis tool designed for day trading. This strategy combines multiple momentum and trend indicators to identify high-probability entry and exit points. The indicator utilizes a combination of Supertrend, MACD, RSI, ATR (Average True Range), and On-Balance Volume (OBV) to generate real-time signals for buy and sell opportunities. Key Features: Supertrend for detecting market direction (bullish or bearish). MACD for momentum confirmation, highlighting changes in market momentum. RSI to filter out overbought/oversold conditions and ensure high-quality trades. ATR as a volatility filter to adjust for changing market conditions. OBV (On-Balance Volume) to confirm volume strength and trend validity. Dynamic Stop-Loss & Take-Profit based on ATR to manage risk and lock profits. This indicator is tailored for intraday traders looking for quick market moves, especially in volatile and high liquidity assets like Bitcoin (BTC) and Ethereum (ETH). It helps traders capture short-term trends with efficient risk management tools. How to Apply: Set Your Chart: Apply the AI Trend Momentum Sniper to a 5-minute (M5) or 15-minute (M15) chart for optimal performance. Buy Signal: When the indicator generates a green arrow below the bar, it indicates a buy signal based on positive trend and momentum alignment. Sell Signal: A red arrow above the bar signals a sell condition when the trend and momentum shift bearish. Stop-Loss and Take-Profit: The indicator automatically calculates dynamic stop-loss and take-profit levels based on the ATR value for each trade, ensuring proper risk management. Alerts: Set up custom alerts for buy or sell signals, and get notified instantly when opportunities arise. Best Markets for Use: BTC/USDT, ETH/USDT – High liquidity and volatility. Major altcoins with sufficient volume. Avoid using it on low-liquidity assets where price action may become erratic. Timeframes: This indicator is best suited for lower timeframes (5-minute to 15-minute charts) to capture quick price movements in trending markets.Indicador Pine Script®por crypto_zil11143
AI InfinityAI Infinity – Multidimensional Market Analysis Overview The AI Infinity indicator combines multiple analysis tools into a single solution. Alongside dynamic candle coloring based on MACD and Stochastic signals, it features Alligator lines, several RSI lines (including glow effects), and optionally enabled EMAs (20/50, 100, and 200). Every module is individually configurable, allowing traders to tailor the indicator to their personal style and strategy. Important Note (Disclaimer) This indicator is provided for educational and informational purposes only. It does not constitute financial or investment advice and offers no guarantee of profit. Each trader is responsible for their own trading decisions. Past performance does not guarantee future results. Please review the settings thoroughly and adjust them to your personal risk profile; consider supplementary analyses or professional guidance where appropriate. Functionality & Components 1. Candle Coloring (MACD & Stochastic) Objective: Provide an immediate visual snapshot of the market’s condition. Details: MACD Signal: Used to identify bullish and bearish momentum. Stochastic: Detects overbought and oversold zones. Color Modes: Offers both a simple (two-color) mode and a gradient mode. 2. Alligator Lines Objective: Assist with trend analysis and determining the market’s current phase. Details: Dynamic SMMA Lines (Jaw, Teeth, Lips) that adjust based on volatility and market conditions. Multiple Lengths: Each element uses a separate smoothing period (13, 8, 5). Transparency: You can show or hide each line independently. 3. RSI Lines & Glow Effects Objective: Display the RSI values directly on the price chart so critical levels (e.g., 20, 50, 80) remain visible at a glance. Details: RSI Scaling: The RSI is plotted in the chart window, eliminating the need to switch panels. Dynamic Transparency: A pulse effect indicates when the RSI is near critical thresholds. Glow Mode: Choose between “Direct Glow” or “Dynamic Transparency” (based on ATR distance). Custom RSI Length: Freely adjustable (default is 14). 4. Optional EMAs (20/50, 100, 200) Objective: Utilize moving averages for trend assessment and identifying potential support/resistance areas. Details: 20/50 EMA: Select which one to display via a dropdown menu. 100 EMA & 200 EMA: Independently enabled. Color Logic: Automatically green (price > EMA) or red (price < EMA). Each EMA’s up/down color is customizable. Configuration Options Candle Coloring: Choose between Gradient or Simple mode. Adjust the color scheme for bullish/bearish candles. Transparency is dynamically based on candle body size and Stochastic state. Alligator Lines: Toggle each line (Jaw/Teeth/Lips) on or off. Select individual colors for each line. RSI Section: RSI Length can be set as desired. RSI lines (0, 20, 50, 80, 100) with user-defined colors and transparency (pulse effect). Additional lines (e.g., RSI 40/60) are also available. Glow Effects: Switch between “Dynamic Transparency” (ATR-based) and “Direct Glow”. Independently applied to the RSI 100 and RSI 0 lines. EMAs (20/50, 100, 200): Activate each one as needed. Each EMA’s up/down color can be customized. Example Use Cases Trend Identification: Enable Alligator lines to gauge general trend direction through SMMA signals. Timing: Watch the Candle Colors to spot potential overbought or oversold conditions. Fine-Tuning: Utilize the RSI lines to closely monitor important thresholds (50 as a trend barometer, 80/20 as possible reversal zones). Filtering: Enable a 50 EMA to quickly see if the market is trading above (bullish) or below (bearish) it. Indicador Pine Script®por jonathanalbrecht_traderActualizado 22327
AI Oversold Swing - Screener//@version=5 indicator("AI Oversold Swing - Screener", overlay=false) // ───────────────────────── // USER INPUTS // ───────────────────────── maxPrice = input.float(75.0, "Max Price ($)") rsiLen = input.int(14, "RSI Length") rsiOversold = input.float(35.0, "RSI Oversold Level") bbLen = input.int(20, "BB Length") bbMult = input.float(2.0, "BB StdDev") supportLen = input.int(20, "Support Lookback (days)") nearSupportPct = input.float(1.5, "Near Support %") undercutPct = input.float(0.5, "Allowed Undercut %") atrLen = input.int(14, "ATR Length") maxATRfromSup = input.float(1.0, "Max ATR From Support") minDollarVol = input.float(75000000.0, "Min Dollar Volume", step=1000000) requireTrigger = input.bool(false, "Require Reversal Trigger") // ───────────────────────── // DAILY DATA (screener uses indicator outputs) // ───────────────────────── dClose = request.security(syminfo.tickerid, "D", close) dLow = request.security(syminfo.tickerid, "D", low) dVol = request.security(syminfo.tickerid, "D", volume) dPrevC = request.security(syminfo.tickerid, "D", close ) // ───────────────────────── // INDICATORS // ───────────────────────── rsi = ta.rsi(dClose, rsiLen) basis = ta.sma(dClose, bbLen) dev = bbMult * ta.stdev(dClose, bbLen) bbLow = basis - dev atr = request.security(syminfo.tickerid, "D", ta.atr(atrLen)) support = ta.lowest(dLow, supportLen) distPct = support > 0 ? (dClose - support) / support * 100.0 : na distATR = atr > 0 ? (dClose - support) / atr : na dollarVol = dClose * dVol // ───────────────────────── // CONDITIONS // ───────────────────────── priceOK = dClose > 0 and dClose <= maxPrice liqOK = dollarVol >= minDollarVol oversold = (rsi <= rsiOversold) and (dClose <= bbLow) nearSup = support > 0 and dClose <= support * (1 + nearSupportPct / 100.0) and dClose >= support * (1 - undercutPct / 100.0) and distATR <= maxATRfromSup setup = priceOK and liqOK and oversold and nearSup // Optional reversal confirmation rsiReversal = ta.crossover(rsi, rsiOversold) greenCandle = dClose > dPrevC trigger = rsiReversal or greenCandle signal = requireTrigger ? (setup and trigger) : setup // ───────────────────────── // SCREENER OUTPUTS // ───────────────────────── plot(signal ? 1 : 0, title="Signal (1 = YES)") plot(rsi, title="RSI (Daily)") plot(distPct, title="Dist to Support % (Daily)") plot(distATR, title="Dist to Support ATR (Daily)") plot(dollarVol, title="Dollar Volume (Daily)") Indicador Pine Script®por reconranger2279
MNQ 1-Min Scalping NY Sessionai made this nd i have no idea if tis actuallly good or not Estrategia Pine Script®por Professionaltrader4140
AI Reversal Signals Custom [wjdtks255]📊 Indicator Overview: AI Reversal Signals Custom This indicator is a comprehensive trend-following and reversal detection tool. It combines the long-term trend bias of a 200 EMA with highly sensitive RSI-based reversal signals and momentum visualization. It is designed to capture market bottoms and tops by identifying exhaustion points in price action. Key Features 200 EMA (Trend Filter): A gold line representing the long-term institutional trend. It helps traders distinguish between "buying the dip" and "catching a falling knife." Reversal Buy/Sell Labels: Real-time signals that appear when the market recovers from extreme overbought or oversold conditions. Dynamic Background Clouds: Visual indicators of trend strength changes, highlighting potential entry zones. Momentum Histogram: Internal calculations mimic the "Bottom Bars" seen in professional suites to track the velocity of price movement. 📈 Trading Strategy (How to Trade) 1. High-Probability Long Setup (Buy) Trend Confirmation: Price should ideally be trading above the 200 EMA for the highest success rate. Signal: Wait for the "BUY" label to appear below the candle. Momentum: Confirm with the Light Green background or histogram shift indicating recovery. Entry: Enter on the close of the signal candle. 2. High-Probability Short Setup (Sell) Trend Confirmation: Price should ideally be trading below the 200 EMA. Signal: Wait for the "SELL" label to appear above the candle. Momentum: Confirm with the Red background or histogram fading from green to red. Entry: Enter on the close of the signal candle. 3. Risk Management Stop Loss: Place your Stop Loss slightly below the recent swing low for Buy orders, or above the recent swing high for Sell orders. Take Profit: Exit when the price reaches a major support/resistance level or when an opposing signal appears. 💡 Professional Tip For the best results, use this indicator on the 15-minute or 1-hour timeframes. The most powerful "Ultimate Reversal" signals occur when there is a Bullish Divergence (Price making lower lows while the RSI makes higher lows) followed by a confirmed "BUY" label.Indicador Pine Script®por wjdtks255Actualizado 244
AI Kernel Regression StrategyHow to Use This Strategy Paste the Code: Open the Pine Editor, paste the code, and click "Add to chart". Look for Reversals: BUY Signal: The price dipped below the green band (oversold) and snapped back up. The script identifies this as a high-probability bounce. SELL Signal: The price spiked above the red band (overbought) and snapped back down. Adjust the "Lookback Window": In the settings (gear icon), if you change Lookback Window to a higher number (e.g., 15-20), the lines become smoother (better for trends). If you lower it (e.g., 3-5), it becomes very reactive (better for scalping). Important Note on "Repainting" This script uses a technique called Regression. In live trading, it works perfectly (the signal appears when the candle closes). However, be aware that "AI" scripts like this are heavy on calculations. If you refresh your browser, the historical lines might shift slightly to fit the data better. Always wait for the candle to close before taking the trade to ensure the signal is locked in.Indicador Pine Script®por Protrade888lv12
AI Trader Indicator v1.0 By Carlos ToledoThe most accurancy AI indicator ever in the world 100%Indicador Pine Script®por carlostoledo8070
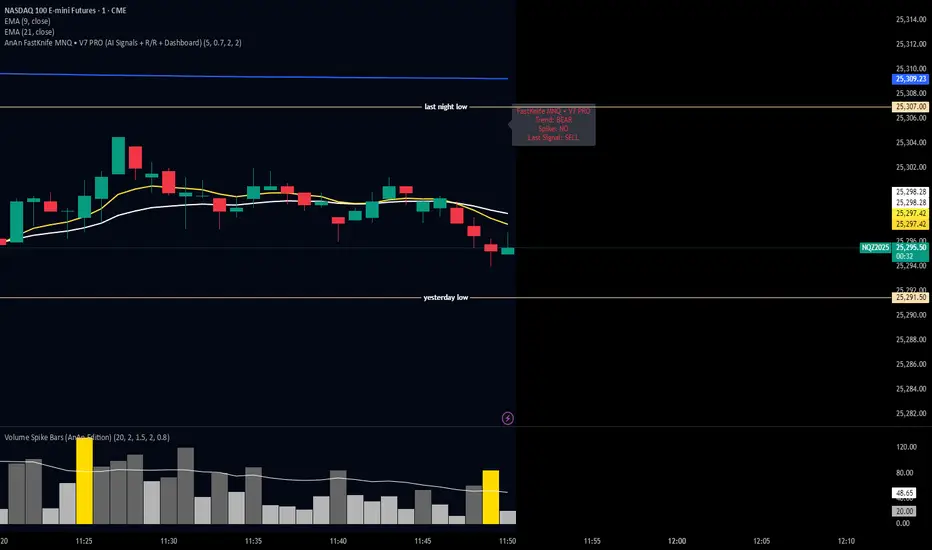
AnAn FastKnife MNQ • V7 PRO (AI Signals + R/R + Dashboard)ai script developed to test the market and the speed and the volatility an the important signalsIndicador Pine Script®por jaxsoulspa21
AI Bot Regime Feed (v6) — stableThis indicator generates real-time, structured JSON alerts for external trading bots or automation systems. It combines multiple technical layers to identify market regimes and high-probability buy/sell events, and sends them to any webhook endpoint (e.g., a FastAPI or Zapier listener).Indicador Pine Script®por ardmir11174
AI Trading Alerts v6 — SL/TP + Confidence + Panel (Fixed)Overview This Pine Script is designed to identify high-probability trading opportunities in Forex, commodities, and crypto markets. It combines EMA trend filters, RSI, and Stochastic RSI, with automatic stop-loss (SL) & take-profit (TP) suggestions, and provides a confidence panel to quickly assess the trade setup strength. It also includes TradingView alert conditions so you can set up notifications for Long/Short setups and EMA crosses. ⚙️ Features EMA Trend Filter Uses EMA 50, 100, 200 for trend confirmation. Bull trend = EMA50 > EMA100 > EMA200 Bear trend = EMA50 < EMA100 < EMA200 RSI Filter Bullish trades require RSI > 50 Bearish trades require RSI < 50 Stochastic RSI Filter Prevents entries during overbought/oversold extremes. Bullish entry only if %K and %D < 80 Bearish entry only if %K and %D > 20 EMA Proximity Check Price must be near EMA50 (within ATR × adjustable multiplier). Signals Continuation Signals: Long if all bullish conditions align. Short if all bearish conditions align. Cross Events: Long Cross when price crosses above EMA50 in bull trend. Short Cross when price crosses below EMA50 in bear trend. Automatic SL/TP Suggestions SL size adjusts depending on asset: Gold/Silver (XAU/XAG): 5 pts Bitcoin/Ethereum: 100 pts FX pairs (default): 20 pts TP = SL × Risk:Reward ratio (default 1:2). Confidence Score (0–4) Based on conditions met (trend, RSI, Stoch, EMA proximity). Labels: Strongest (4/4) Strong (3/4) Medium (2/4) Low (1/4) Visual Panel on Chart Shows ✅/❌ for each condition (trend, RSI, Stoch, EMA proximity, signal now). Confidence row with color-coded strength. Alerts Long Setup Short Setup Long Cross Short Cross 🖥️ How to Use 1. Add the Script Open TradingView → Pine Editor. Paste the full script. Click Add to chart. Save as "AI Trading Alerts v6 — SL/TP + Confidence + Panel". 2. Configure Inputs EMA Lengths: Default 50/100/200 (works well for swing trading). RSI Length: 14 (standard). Stochastic Length/K/D: Default 14/3/3. Risk:Reward Ratio: Default 2.0 (can change to 1.5, 3.0, etc.). EMA Proximity Threshold: Default 0.20 × ATR (adjust to be stricter/looser). 3. Read the Panel Top-right of chart, you’ll see ✅ or ❌ for: Trend → Are EMAs aligned? RSI → Above 50 (bull) or below 50 (bear)? Stoch OK → Not extreme? Near EMA50 → Close enough to EMA50? Above/Below OK → Price position vs. EMA50 matches trend? Signal Now → Entry triggered? Confidence row: 🟢 Green = Strongest 🟩 Light green = Strong 🟧 Orange = Medium 🟨 Yellow = Low ⬜ Gray = None 4. Alerts Setup Go to TradingView Alerts (⏰ icon). Choose the script under “Condition”. Select alert type: Long Setup Short Setup Long Cross Short Cross Set notification method (popup, sound, email, mobile). Click Create. Now TradingView will notify you automatically when signals appear. 5. Example Workflow Wait for Confidence = Strong/Strongest. Check if market session supports volatility (e.g., XAU in London/NY). Review SL/TP suggestions: Long → Entry: current price, SL: close - risk_pts, TP: close + risk_pts × RR. Short → Entry: current price, SL: close + risk_pts, TP: close - risk_pts × RR. Adjust based on your own price action analysis. 📊 Best Practices Use on H1 + D1 combo → align higher timeframe bias with intraday entries. Risk only 1–2% of account per trade (position sizing required). Filter with market sessions (Asia, Europe, US). Strongest signals work best with trending pairs (e.g., XAUUSD, USDJPY, BTCUSD). Indicador Pine Script®por geraldfernandez2017Actualizado 11199
AI-Powered Breakout with Advanced FeaturesDescription This script is designed to detect breakout moments in financial markets using a combination of traditional breakout detection methods and adaptive moving averages. By leveraging elements of artificial intelligence, the script provides a more dynamic and responsive approach to identifying potential entry and exit points in trading. Usefulness This script stands out by integrating a traditional breakout finder with an adaptive moving average component. The adaptive moving average adjusts dynamically based on the differences between fast and slow exponential moving averages (EMAs), offering a more flexible and responsive detection of support and resistance levels. This combination aims to reduce false signals and enhance the reliability of breakout detections, making it a valuable tool for traders seeking to capture market movements more effectively. Features 1. Breakout Detection: Utilizes pivot highs and lows to identify significant breakout points over a user-defined period. This method helps in capturing the essential support and resistance levels that are critical in breakout trading. 2. AI Machine Learning Component - Adaptive Moving Average: Implements an adaptive moving average using two exponential moving averages (EMAs). adaptiveMA is dynamically adjusted based on the difference between a fast average and a slow average. 3. Buy/Sell Signals: The script generates buy and sell signals when bullish and bearish breakouts occur, respectively. These signals are visually represented on the chart, helping traders to quickly identify potential trading opportunities. 4. Visualization: Draws horizontal lines at identified breakout levels and plots shapes (arrows) on the chart to indicate buy/sell signals. This makes it easy for traders to see where significant breakout points are and where to consider entering or exiting trades. Underlying Concepts 1. Breakout Finder Logic: The script uses pivot points (highs and lows) to detect breakout levels. It stores these pivot points in arrays and monitors them for persistence, ensuring that the detected breakouts are significant and reliable. 2. Adaptive Moving Average (AMA): The AMA is a key component that enhances the script's responsiveness. By calculating the differences between fast and slow EMAs, the AMA adapts to changing market conditions, providing a more accurate measure of trends and potential reversals. How to Use • Adjustable Parameters: The script includes several user-adjustable parameters: o Lookback Length: Defines the period over which the script calculates the highest high and lowest low for breakout detection. o Multiplier for Adaptive MA: Adjusts the sensitivity of the adaptive moving average. o Period for Pivots: Sets the period for detecting pivot highs and lows. o Max Breakout Length: Specifies the maximum length for breakout consideration. o Threshold Rate: Determines the threshold rate for breakout validation. o Minimum Number of Tests: Sets the minimum number of tests required to validate a breakout. o Colors and Line Style: Customize the colors and line styles for breakout levels. Interpreting Signals o Green Arrows: Indicate a bullish breakout signal, suggesting a potential buy opportunity. o Red Arrows: Indicate a bearish breakout signal, suggesting a potential sell opportunity. o Horizontal Lines: Show the breakout levels, helping to visualize support and resistance areas. By combining traditional breakout detection with advanced adaptive moving averages, this script aims to provide traders with a robust tool for identifying and capitalizing on market breakouts. Credits Parts of this script were inspired and adapted from the "Breakout Finder" script by LonesomeTheBlue. Significant improvements include the integration of the adaptive moving average component and enhancements to the breakout detection logic. Indicador Pine Script®por danylosam33 1 K
AI SuperTrend - Strategy [presentTrading] █ Introduction and How it is Different The AI Supertrend Strategy is a unique hybrid approach that employs both traditional technical indicators and machine learning techniques. Unlike standard strategies that rely solely on traditional indicators or mathematical models, this strategy integrates the power of k-Nearest Neighbors (KNN), a machine learning algorithm, with the tried-and-true SuperTrend indicator. This blend aims to provide traders with more accurate, responsive, and context-aware trading signals. *The KNN part is mainly referred from @Zeiierman. BTCUSD 8hr performance ETHUSD 8hr performance █ Strategy, How it Works: Detailed Explanation SuperTrend Calculation Volume-Weighted Moving Average (VWMA): A VWMA of the close price is calculated based on the user-defined length (len). This serves as the central line around which the upper and lower bands are calculated. Average True Range (ATR): ATR is calculated over a period defined by len. It measures the market's volatility. Upper and Lower Bands: The upper band is calculated as VWMA + (factor * ATR) and the lower band as VWMA - (factor * ATR). The factor is a user-defined multiplier that decides how wide the bands should be. KNN Algorithm Data Collection: An array (data) is populated with recent n SuperTrend values. Corresponding labels (labels) are determined by whether the weighted moving average price (price) is greater than the weighted moving average of the SuperTrend (sT). Distance Calculation: The absolute distance between each data point and the current SuperTrend value is calculated. Sorting & Weighting: The distances are sorted in ascending order, and the closest k points are selected. Each point is weighted by the inverse of its distance to the current point. Classification: A weighted sum of the labels of the k closest points is calculated. If the sum is closer to 1, the trend is predicted as bullish; if closer to 0, bearish. Signal Generation Start of Trend: A new bullish trend (Start_TrendUp) is considered to have started if the current trend color is bullish and the previous was not bullish. Similarly for bearish trends (Start_TrendDn). Trend Continuation: A bullish trend (TrendUp) is considered to be continuing if the direction is negative and the KNN prediction is 1. Similarly for bearish trends (TrendDn). Trading Logic Long Condition: If Start_TrendUp or TrendUp is true, a long position is entered. Short Condition: If Start_TrendDn or TrendDn is true, a short position is entered. Exit Condition: Dynamic trailing stops are used for exits. If the trend does not continue as indicated by the KNN prediction and SuperTrend direction, an exit signal is generated. The synergy between SuperTrend and KNN aims to filter out noise and produce more reliable trading signals. While SuperTrend provides a broad sense of the market direction, KNN refines this by predicting short-term price movements, leading to a more nuanced trading strategy. Local picture █ Trade Direction The strategy allows traders to choose between taking only long positions, only short positions, or both. This is particularly useful for adapting to different market conditions. █ Usage ToolTips: Explains what each parameter does and how to adjust them. Inputs: Customize values like the number of neighbors in KNN, ATR multiplier, and moving average type. Plotting: Visual cues on the chart to indicate bullish or bearish trends. Order Execution: Based on the generated signals, the strategy will execute buy/sell orders. █ Default Settings The default settings are selected to provide a balanced approach, but they can be modified for different trading styles and asset classes. Initial Capital: $10,000 Default Quantity Type: 10% of equity Commission: 0.1% Slippage: 1 Currency: USD By combining both machine learning and traditional technical analysis, this strategy offers a sophisticated and adaptive trading solution.Estrategia Pine Script®por PresentTrading1414 2.7 K
PowerHouse SwiftEdge AI v2.10 with Custom Filters & AI AnalysisPowerHouse SwiftEdge AI v2.10 with Custom Filters & AI Analysis Overview PowerHouse SwiftEdge AI v2.10 is an advanced TradingView Pine Script indicator designed to identify high-probability trading setups by combining pivot-based structure analysis, multi-timeframe trend detection, and adaptive AI-driven signal filtering. The script integrates Change of Character (CHoCH) and Break of Structure (BOS) signals with customizable momentum, volume, breakout, and trend filters to enhance trade precision. Additionally, it offers an optional AI Market Analysis module that predicts future price trends across multiple timeframes, providing traders with a comprehensive market outlook. The script is highly customizable, allowing users to tailor inputs to their trading style, whether for scalping, swing trading, or long-term strategies. It is suitable for all asset classes, including stocks, forex, crypto, and commodities, and performs optimally on timeframes ranging from 1-minute to daily charts. Key Features Pivot-Based Signal Generation: Identifies pivot highs and lows to detect CHoCH (reversal patterns) and BOS (continuation patterns). Signals are plotted as "Buy" or "Sell" labels with optional "Get Ready" pre-signals to prepare traders for potential setups. Take-profit (TP) levels are automatically calculated based on user-defined points, with optional TP box visualization. Multi-Timeframe Trend Analysis: Analyzes trends across seven timeframes (1M, 5M, 15M, 30M, 1H, 4H, D) using EMA and VWAP to determine bullish, bearish, or neutral conditions. Displays a futuristic AI-Trend Matrix dashboard showing trend direction, strength, and confidence levels for quick decision-making. Customizable Signal Filters: Momentum Filter: Ensures signals align with significant price changes, adjusted dynamically using ATR-based volatility. Higher Timeframe Trend Filter: Requires signals to align with the trend of a user-selected higher timeframe (e.g., 1H). Lower Timeframe Trend Filter: Prevents signals that conflict with the trend of a user-selected lower timeframe (e.g., 5M). Volume Filter: Optionally requires above-average volume to confirm signals. Breakout Filter: Optionally requires price to break previous highs/lows for signal validation. Repeated Signal Restriction: Prevents consecutive signals in the same trend direction until the trend changes on a user-defined timeframe. AI-Driven Adaptivity: Incorporates Cumulative Volume Delta (CVD) to assess buying/selling pressure and classify market volatility (Low, Medium, High). Uses ATR to dynamically adjust momentum thresholds, ensuring signals adapt to current market conditions. Optional AI Market Analysis module predicts trends across multiple timeframes by combining trend, momentum, and volatility scores. Visual Elements: Plots CHoCH and BOS levels as horizontal lines with distinct colors (aqua for CHoCH sell, lime for CHoCH buy, fuchsia for BOS sell, teal for BOS buy). Draws dynamic support and resistance trendlines based on short and long-term price action, colored by trend strength. Displays TP levels and pivot highs/lows for easy reference. How It Works The script combines several technical analysis concepts to create a robust trading system: Market Structure Analysis: Pivot highs and lows are identified using a user-defined lookback period (Pivot Length). CHoCH occurs when price crosses below a pivot high (bearish reversal) or above a pivot low (bullish reversal). BOS occurs when price breaks a previous pivot low (bearish continuation) or pivot high (bullish continuation). Trend and Momentum Integration: Trends are determined by comparing price to EMA and VWAP on multiple timeframes. Momentum is calculated as the percentage price change, with thresholds adjusted by ATR to account for volatility. "Get Ready" signals appear when momentum approaches the threshold, preparing traders for potential CHoCH or BOS signals. Signal Filtering: Filters ensure signals align with user-defined criteria (e.g., trend direction, volume, breakouts). The Restrict Repeated Signals option prevents over-signaling by requiring a trend change on a specified timeframe before generating a new signal in the same direction. AI Market Analysis: The optional AI module calculates a score for each timeframe based on trend direction, momentum, and volatility (ATR compared to its SMA). Scores are translated into predictions (▲ for bullish, ▼ for bearish, — for neutral), displayed in a dedicated table. CVD and Volatility Context: CVD tracks buying vs. selling pressure by accumulating volume based on price direction. Volatility is classified using CVD magnitude, influencing the script’s visual cues and signal sensitivity. Why This Combination? The integration of pivot-based structure analysis, multi-timeframe trend filtering, and AI-driven adaptivity addresses common trading challenges: Precision: CHoCH and BOS signals focus on key market turning points, reducing noise from minor price fluctuations. Context: Multi-timeframe analysis ensures trades align with broader market trends, improving win rates. Adaptivity: ATR and CVD adjustments make the script responsive to changing market conditions, avoiding static thresholds that fail in volatile or quiet markets. Customization: Extensive input options allow traders to adapt the script to their preferred markets, timeframes, and risk profiles. Predictive Insight: The AI Market Analysis module provides forward-looking trend predictions, helping traders anticipate market moves. This combination creates a self-contained system that balances responsiveness with reliability, making it suitable for both novice and experienced traders. How to Use Add to Chart: Apply the indicator to your TradingView chart for any asset and timeframe. Recommended timeframes: 5M to 1H for scalping/day trading, 4H to D for swing trading. Configure Inputs: Pivot Length: Adjust (default 5) to control sensitivity to pivot highs/lows. Lower values for faster signals, higher for stronger confirmations. Momentum Threshold: Set the minimum price change (default 0.01%) for signals. Increase for stricter conditions. Take Profit Points: Define TP distance (default 10 points). Adjust based on asset volatility. Signal Filters: Enable/disable filters (momentum, trend, volume, breakout) to match your strategy. Higher/Lower Timeframe: Select timeframes for trend alignment (e.g., 1H for higher, 5M for lower). AI Market Analysis: Enable for predictive trend insights across timeframes. Get Ready Signals: Enable to see pre-signals for potential setups. Interpret Signals: Buy/Sell Labels: Act on green "Buy" or red "Sell" labels, confirming with TP levels and trend direction. Get Ready Labels: Yellow "Get Ready BUY" or orange "Get Ready SELL" indicate potential setups; prepare but wait for confirmation. CHoCH/BOS Lines: Use aqua/lime (CHoCH) and fuchsia/teal (BOS) lines as key support/resistance levels. AI-Trend Matrix: Check the top-right dashboard for trend strength (%), confidence (%), and timeframe-specific trends. AI Market Analysis Table: If enabled, view predictions (▲/▼/—) for each timeframe to anticipate market direction. Trading Tips: Combine signals with other indicators (e.g., RSI, MACD) for additional confirmation. Use higher timeframe trend alignment for higher-probability trades. Adjust TP and signal distance based on asset volatility and trading style. Monitor the AI-Trend Matrix for trend strength; values above 50% or below -50% indicate strong directional bias. Originality PowerHouse SwiftEdge AI v2.10 stands out due to its unique blend of: Adaptive Signal Generation: ATR-based momentum thresholds and CVD-driven volatility context ensure signals remain relevant across market conditions. Multi-Timeframe Synergy: The script’s ability to filter signals based on both higher and lower timeframe trends provides a rare balance of precision and context. AI-Powered Insights: The AI Market Analysis module offers predictive capabilities not commonly found in traditional indicators, simulating institutional-grade analysis. Visual Clarity: The futuristic dashboard and color-coded trendlines make complex data accessible, enhancing usability for all trader levels. Unlike standalone pivot or trend indicators, this script integrates multiple layers of analysis into a cohesive system, reducing false signals and providing actionable insights without requiring external tools or research. Limitations False Signals: No indicator is foolproof; signals may fail in choppy or low-volume markets. Use filters to mitigate. Timeframe Sensitivity: Performance varies by timeframe and asset. Test settings thoroughly. AI Predictions: The AI Market Analysis is based on historical data and simplified scoring; it’s not a guaranteed forecast. Resource Usage: Enabling all filters and AI analysis may slow performance on lower-end devices.Indicador Pine Script®por SwiftEdgeActualizado 2020 2.9 K
Wall Street Ai**Wall Street Ai – Advanced Technical Indicator for Market Analysis** **Overview** Wall Street Ai is an advanced, AI-powered technical indicator meticulously engineered to provide traders with in-depth market analysis and insight. By leveraging state-of-the-art artificial intelligence algorithms and comprehensive historical price data, Wall Street Ai is designed to identify significant market turning points and key price levels. Its sophisticated analytical framework enables traders to uncover potential shifts in market momentum, assisting in the formulation of strategic trading decisions while maintaining the highest standards of objectivity and reliability. **Key Features** - **Intelligent Pattern Recognition:** Wall Street Ai employs advanced machine learning techniques to analyze historical price movements and detect recurring patterns. This capability allows it to differentiate between typical market noise and meaningful signals indicative of potential trend reversals. - **Robust Noise Reduction:** The indicator incorporates a refined volatility filtering system that minimizes the impact of minor price fluctuations. By isolating significant price movements, it ensures that the analytical output focuses on substantial market shifts rather than ephemeral variations. - **Customizable Analytical Parameters:** With a wide range of adjustable settings, Wall Street Ai can be fine-tuned to align with diverse trading strategies and risk appetites. Traders can modify sensitivity, threshold levels, and other critical parameters to optimize the indicator’s performance under various market conditions. - **Comprehensive Data Analysis:** By harnessing the power of artificial intelligence, Wall Street Ai performs a deep analysis of historical data, identifying statistically significant highs and lows. This analysis not only reflects past market behavior but also provides valuable insights into potential future turning points, thereby enhancing the predictive aspect of your trading strategy. - **Adaptive Market Insights:** The indicator’s dynamic algorithm continuously adjusts to current market conditions, adapting its analysis based on real-time data inputs. This adaptive quality ensures that the indicator remains relevant and effective across different market environments, whether the market is trending strongly, consolidating, or experiencing volatility. - **Objective and Reliable Analysis:** Wall Street Ai is built on a foundation of robust statistical methods and rigorous data validation. Its outputs are designed to be objective and free from any exaggerated claims, ensuring that traders receive a clear, unbiased view of market conditions. **How It Works** Wall Street Ai integrates advanced AI and deep learning methodologies to analyze a vast array of historical price data. Its core algorithm identifies and evaluates critical market levels by detecting patterns that have historically preceded significant market movements. By filtering out non-essential fluctuations, the indicator emphasizes key price extremes and trend changes that are likely to impact market behavior. The system’s adaptive nature allows it to recalibrate its analytical parameters in response to evolving market dynamics, providing a consistently reliable framework for market analysis. **Usage Recommendations** - **Optimal Timeframes:** For the most effective application, it is recommended to utilize Wall Street Ai on higher timeframe charts, such as hourly (H1) or higher. This approach enhances the clarity of the detected patterns and provides a more comprehensive view of long-term market trends. - **Market Versatility:** Wall Street Ai is versatile and can be applied across a broad range of financial markets, including Forex, indices, commodities, cryptocurrencies, and equities. Its adaptable design ensures consistent performance regardless of the asset class being analyzed. - **Complementary Analytical Tools:** While Wall Street Ai provides profound insights into market behavior, it is best utilized in combination with other analytical tools and techniques. Integrating its analysis with additional indicators—such as trend lines, support/resistance levels, or momentum oscillators—can further refine your trading strategy and enhance decision-making. - **Strategy Testing and Optimization:** Traders are encouraged to test Wall Street Ai extensively in a simulated trading environment before deploying it in live markets. This allows for thorough calibration of its settings according to individual trading styles and risk management strategies, ensuring optimal performance across diverse market conditions. **Risk Management and Best Practices** Wall Street Ai is intended to serve as an analytical tool that supports informed trading decisions. However, as with any technical indicator, its outputs should be interpreted as part of a comprehensive trading strategy that includes robust risk management practices. Traders should continuously validate the indicator’s findings with additional analysis and maintain a disciplined approach to position sizing and risk control. Regular review and adjustment of trading strategies in response to market changes are essential to mitigate potential losses. **Conclusion** Wall Street Ai offers a cutting-edge, AI-driven approach to technical analysis, empowering traders with detailed market insights and the ability to identify potential turning points with precision. Its intelligent pattern recognition, adaptive analytical capabilities, and extensive noise reduction make it a valuable asset for both experienced traders and those new to market analysis. By integrating Wall Street Ai into your trading toolkit, you can enhance your understanding of market dynamics and develop a more robust, data-driven trading strategy—all while adhering to the highest standards of analytical integrity and performance.Indicador Pine Script®por UnknownUnicorn2612547263
Gold AI RSI Monitor [Stacked + KNN]Here is a comprehensive description and user guide for the Gold AI RSI Monitor. You can copy and paste this into the "Description" field if you publish the script on TradingView, or save it for your own reference. Gold AI RSI Monitor 🚀 Overview The Gold AI RSI Monitor is a next-generation dashboard designed specifically for trading volatile assets like Gold (XAUUSD). It completely reimagines the traditional RSI by "stacking" 10 different timeframes (from 1-minute to Monthly) into a single, vertical view. Integrated into this dashboard is a K-Nearest Neighbors (KNN) Machine Learning algorithm. This AI analyzes historical price action to find patterns similar to the current market and predicts the next likely move with a confidence score. 📊 Visual Guide: How to Read the Chart 1. The "Stacked" Lanes Instead of switching timeframes constantly, this indicator displays them all at once using vertical offsets. Bottom Lane (0-100): 1-Minute RSI Middle Lanes: 5m, 15m, 30m, 1H, 2H, 4H, Daily Top Lane (900-1000): Monthly RSI 2. Gradient Color System The RSI lines change color based on momentum strength: 🔴 Red: Oversold / Bearish (Approaching 30 or lower) 🟡 Yellow: Neutral (Around 50) 🟢 Green: Overbought / Bullish (Approaching 70 or higher) 3. Tracker Lines Each timeframe has a dotted horizontal line extending to the right. This allows you to instantly see the exact RSI value for every timeframe without squinting. 🤖 The AI Engine (KNN) The "AI" component uses a K-Nearest Neighbors algorithm. Learning: It scans the last 1,000 bars of history. Matching: It finds the 5 historical moments that look mathematically identical to the current market conditions (based on RSI and Volatility). Predicting: It checks if price went UP or DOWN after those historical matches. The Signals: Buying Signal: If the majority of historical matches resulted in a price increase, the AI triggers a BUY. Selling Signal: If the majority resulted in a drop, the AI triggers a SELL. 🎯 How to Trade with This Indicator 1. The "Crosshair" Signal When the AI detects a high-probability setup, a massive Crosshair appears on your chart: Green Crosshair: Strong BUY signal. Red Crosshair: Strong SELL signal. Note: The crosshair consists of a thick vertical line and a dashed horizontal line intersecting at the signal candle. 2. Timeframe Alignment (Confluence) Do not rely on the AI alone. Look at the stacked RSIs: Strong Long: The AI shows a Green Crosshair AND the lower timeframes (1m, 5m, 15m) are all turning Green/upward. Strong Short: The AI shows a Red Crosshair AND the lower timeframes are turning Red/downward. 3. Support & Resistance Zones Bottom Dotted Line (30): Support. If RSI hits this and turns up, it's a buying opportunity. Top Dotted Line (70): Resistance. If RSI hits this and turns down, it's a selling opportunity. ⚙️ Settings Guide RSI Length: Default is 14. Lower (e.g., 7) makes it faster/choppier; higher (e.g., 21) makes it smoother. Enable AI Signals: Toggles the KNN calculation on/off. Neighbors (K): How many historical matches to check. Default is 5. Increase to 9-10 for fewer, more conservative signals. Decrease to 3 for faster, more aggressive signals. AI Timeframe: CRITICAL SETTING. If left empty, the AI calculates based on your current chart. Recommendation: For Gold scalping, set this to 15m or 1h. This ensures the AI looks at the bigger trend even if you are zooming in on the 1-minute chart. ⚠️ Disclaimer This tool is for educational and analytical purposes. The "AI" is a statistical probability algorithm based on past performance, which is not indicative of future results. Always manage your risk.Indicador Pine Script®por Protrade888lv37
PowerHouse SwiftEdge AI v2.10 StrategyOverview The PowerHouse SwiftEdge AI v2.10 Strategy is a sophisticated trading system designed to identify high-probability trade setups in forex, stocks, and cryptocurrencies. By combining multi-timeframe trend analysis, momentum signals, volume confirmation, and smart money concepts (Change of Character and Break of Structure ), this strategy offers traders a robust tool to capitalize on market trends while minimizing false signals. The strategy’s unique “AI” component analyzes trends across multiple timeframes to provide a clear, actionable dashboard, making it accessible for both novice and experienced traders. The strategy is fully customizable, allowing users to tailor its filters to their trading style. What It Does This strategy generates Buy and Sell signals based on a confluence of technical indicators and smart money concepts. It uses: Multi-Timeframe Trend Analysis: Confirms the market’s direction by analyzing trends on the 1-hour (60M), 4-hour (240M), and daily (D) timeframes. Momentum Filter: Ensures trades align with strong price movements to avoid choppy markets. Volume Filter: Validates signals with above-average volume to confirm market participation. Breakout Filter: Requires price to break key levels for added confirmation. Smart Money Signals (CHoCH/BOS): Identifies reversals (CHoCH) and trend continuations (BOS) based on pivot points. AI Trend Dashboard: Summarizes trend strength, confidence, and predictions across timeframes, helping traders make informed decisions without needing to analyze complex data manually. The strategy also plots dynamic support and resistance trendlines, take-profit (TP) levels, and “Get Ready” signals to alert users of potential setups before they fully develop. Trades are executed with predefined take-profit and stop-loss levels for disciplined risk management. How It Works The strategy integrates multiple components to create a cohesive trading system: Multi-Timeframe Trend Analysis: The strategy evaluates trends on three timeframes (1H, 4H, Daily) using Exponential Moving Averages (EMA) and Volume-Weighted Average Price (VWAP). A trend is considered bullish if the price is above both the EMA and VWAP, bearish if below, or neutral otherwise. Signals are only generated when the trend on the user-selected higher timeframe aligns with the trade direction (e.g., Buy signals require a bullish higher timeframe trend). This reduces noise and ensures trades follow the broader market context. Momentum Filter: Measures the percentage price change between consecutive bars and compares it to a volatility-adjusted threshold (based on the Average True Range ). This ensures trades are taken only during significant price movements, filtering out low-momentum conditions. Volume Filter (Optional): Checks if the current volume exceeds a long-term average and shows positive short-term volume change. This confirms strong market participation, reducing the risk of false breakouts. Breakout Filter (Optional): Requires the price to break above (for Buy) or below (for Sell) recent highs/lows, ensuring the signal aligns with a structural shift in the market. Smart Money Concepts (CHoCH/BOS): Change of Character (CHoCH): Detects potential reversals when the price crosses under a recent pivot high (for Sell) or over a recent pivot low (for Buy) with a bearish or bullish candle, respectively. Break of Structure (BOS): Confirms trend continuations when the price breaks below a recent pivot low (for Sell) or above a recent pivot high (for Buy) with strong momentum. These signals are plotted as horizontal lines with labels, making it easy to visualize key levels. AI Trend Dashboard: Combines trend direction, momentum, and volatility (ATR) across timeframes to calculate a trend score. Scores above 0.5 indicate an “Up” trend, below -0.5 indicate a “Down” trend, and otherwise “Neutral.” Displays a table summarizing trend strength (as a percentage), AI confidence (based on trend alignment), and Cumulative Volume Delta (CVD) for market context. A second table (optional) shows trend predictions for 1H, 4H, and Daily timeframes, helping traders anticipate future market direction. Dynamic Trendlines: Plots support and resistance lines based on recent swing lows and highs within user-defined periods (shortTrendPeriod, longTrendPeriod). These lines adapt to market conditions and are colored based on trend strength. Why This Combination? The PowerHouse SwiftEdge AI v2.10 Strategy is original because it seamlessly integrates traditional technical analysis (EMA, VWAP, ATR, volume) with smart money concepts (CHoCH, BOS) and a proprietary AI-driven trend analysis. Unlike standalone indicators, this strategy: Reduces False Signals: By requiring confluence across trend, momentum, volume, and breakout filters, it minimizes trades in choppy or low-conviction markets. Adapts to Market Context: The ATR-based momentum threshold adjusts dynamically to volatility, ensuring signals remain relevant in both trending and ranging markets. Simplifies Decision-Making: The AI dashboard distills complex multi-timeframe data into a user-friendly table, eliminating the need for manual analysis. Leverages Smart Money: CHoCH and BOS signals capture institutional price action patterns, giving traders an edge in identifying reversals and continuations. The combination of these components creates a balanced system that aligns short-term trade entries with longer-term market trends, offering a unique blend of precision, adaptability, and clarity. How to Use Add to Chart: Apply the strategy to your TradingView chart on a liquid symbol (e.g., EURUSD, BTCUSD, AAPL) with a timeframe of 60 minutes or lower (e.g., 15M, 60M). Configure Inputs: Pivot Length: Adjust the number of bars (default: 5) to detect pivot highs/lows for CHoCH/BOS signals. Higher values reduce noise but may delay signals. Momentum Threshold: Set the base percentage (default: 0.01%) for momentum confirmation. Increase for stricter signals. Take Profit/Stop Loss: Define TP and SL in points (default: 10 each) for risk management. Higher/Lower Timeframe: Choose timeframes (60M, 240M, D) for trend filtering. Ensure the chart timeframe is lower than or equal to the higher timeframe. Filters: Enable/disable momentum, volume, or breakout filters to suit your trading style. Trend Periods: Set shortTrendPeriod (default: 30) and longTrendPeriod (default: 100) for trendline plotting. Keep below 2000 to avoid buffer errors. AI Dashboard: Toggle Enable AI Market Analysis to show/hide the prediction table and adjust its position. Interpret Signals: Buy/Sell Labels: Green "Buy" or red "Sell" labels indicate trade entries with predefined TP/SL levels plotted. Get Ready Signals: Yellow "Get Ready BUY" or orange "Get Ready SELL" labels warn of potential setups. CHoCH/BOS Lines: Aqua (CHoCH Sell), lime (CHoCH Buy), fuchsia (BOS Sell), or teal (BOS Buy) lines mark key levels. Trendlines: Green/lime (support) or fuchsia/purple (resistance) dashed lines show dynamic support/resistance. AI Dashboard: Check the top-right table for trend strength, confidence, and CVD. The optional bottom table shows trend predictions (Up, Down, Neutral). Backtest and Trade: Use TradingView’s Strategy Tester to evaluate performance. Adjust TP/SL and filters based on results. Trade manually based on signals or automate with TradingView alerts (set alerts for Buy/Sell labels). Originality and Value The PowerHouse SwiftEdge AI v2.10 Strategy stands out by combining multi-timeframe analysis, smart money concepts, and an AI-driven dashboard into a single, user-friendly system. Its adaptive momentum threshold, robust filtering, and clear visualizations empower traders to make confident decisions without needing advanced technical knowledge. Whether you’re a day trader or swing trader, this strategy provides a versatile, data-driven approach to navigating dynamic markets. Important Notes: Risk Management: Always use appropriate position sizing and risk management, as the strategy’s TP/SL levels are customizable. Symbol Compatibility: Test on liquid symbols with sufficient historical data (at least 2000 bars) to avoid buffer errors. Performance: Backtest thoroughly to optimize settings for your market and timeframe.Estrategia Pine Script®por SwiftEdge33 1 K