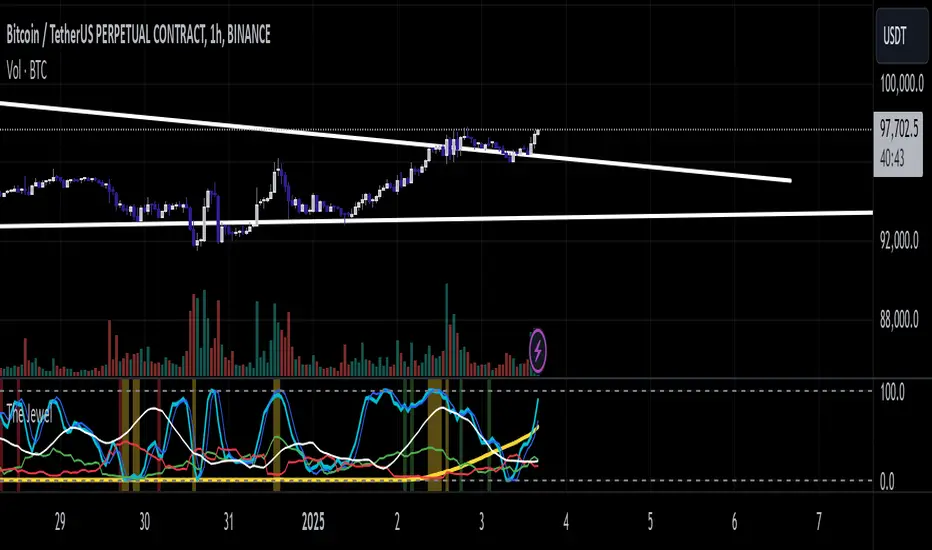
The JewelThe Jewel is a comprehensive momentum and trend-based indicator designed to give traders clear insights into potential market shifts. By integrating RSI, Stochastic, and optional ADX filters with an EMA-based trend filter, this script helps identify high-conviction entry and exit zones for multiple trading styles, from momentum-based breakouts to mean-reversion setups.
Features
Momentum Integration:
Leverages RSI and Stochastic crossovers for real-time momentum checks, reducing noise and highlighting potential turning points.
Optional ADX Filter:
Analyzes market strength; only triggers signals when volatility and directional movement suggest strong follow-through.
EMA Trend Filter:
Identifies broad market bias (bullish vs. bearish), helping traders focus on higher-probability setups by aligning with the prevailing trend.
Caution Alerts:
Flags potentially overbought or oversold conditions when both RSI and Stochastic reach extreme zones, cautioning traders to manage risk or tighten stops.
Customizable Parameters:
Fine-tune RSI, Stochastic, ADX, and EMA settings to accommodate various assets, timeframes, and trading preferences.
How to Use
Momentum Breakouts: Watch for RSI cross above a set threshold and Stochastic cross up, confirmed by ADX strength and alignment with the EMA filter for potential breakout entries.
Mean Reversion: Look for caution signals (RSI & Stoch extremes) as early warnings for trend slowdown or reversal opportunities.
Trend Continuation: In trending markets, rely on the EMA filter to stay aligned with the primary direction. Use momentum crosses (RSI/Stochastic) to time add-on entries or exits.
Important Notes
Non-Investment Advice
The Jewel is a technical analysis tool and does not constitute financial advice. Always use proper risk management and consider multiple confirmations when making trading decisions.
No Warranty
This indicator is provided as-is, without warranty or guarantees of performance. Traders should backtest and verify its effectiveness on their specific instruments and timeframes.
Collaborate & Share
Feedback and suggestions are welcome! Engaging with fellow traders can help refine and adapt The Jewel for diverse market conditions, strengthening the TradingView community as a whole.
Happy Trading!
If you find this script valuable, please share your feedback, ideas, or enhancements. Collaboration fosters a more insightful trading experience for everyone.
Buscar en scripts para "adx"
TrigWave Suite [InvestorUnknown]The TrigWave Suite combines Sine-weighted, Cosine-weighted, and Hyperbolic Tangent moving averages (HTMA) with a Directional Movement System (DMS) and a Relative Strength System (RSS).
Hyperbolic Tangent Moving Average (HTMA)
The HTMA smooths the price by applying a hyperbolic tangent transformation to the difference between the price and a simple moving average. It also adjusts this value by multiplying it by a standard deviation to create a more stable signal.
// Function to calculate Hyperbolic Tangent
tanh(x) =>
e_x = math.exp(x)
e_neg_x = math.exp(-x)
(e_x - e_neg_x) / (e_x + e_neg_x)
// Function to calculate Hyperbolic Tangent Moving Average
htma(src, len, mul) =>
tanh_src = tanh((src - ta.sma(src, len)) * mul) * ta.stdev(src, len) + ta.sma(src, len)
htma = ta.sma(tanh_src, len)
Sine-Weighted Moving Average (SWMA)
The SWMA applies sine-based weights to historical prices. This gives more weight to the central data points, making it responsive yet less prone to noise.
// Function to calculate the Sine-Weighted Moving Average
f_Sine_Weighted_MA(series float src, simple int length) =>
var float sine_weights = array.new_float(0)
array.clear(sine_weights) // Clear the array before recalculating weights
for i = 0 to length - 1
weight = math.sin((math.pi * (i + 1)) / length)
array.push(sine_weights, weight)
// Normalize the weights
sum_weights = array.sum(sine_weights)
for i = 0 to length - 1
norm_weight = array.get(sine_weights, i) / sum_weights
array.set(sine_weights, i, norm_weight)
// Calculate Sine-Weighted Moving Average
swma = 0.0
if bar_index >= length
for i = 0 to length - 1
swma := swma + array.get(sine_weights, i) * src
swma
Cosine-Weighted Moving Average (CWMA)
The CWMA uses cosine-based weights for data points, which produces a more stable trend-following behavior, especially in low-volatility markets.
f_Cosine_Weighted_MA(series float src, simple int length) =>
var float cosine_weights = array.new_float(0)
array.clear(cosine_weights) // Clear the array before recalculating weights
for i = 0 to length - 1
weight = math.cos((math.pi * (i + 1)) / length) + 1 // Shift by adding 1
array.push(cosine_weights, weight)
// Normalize the weights
sum_weights = array.sum(cosine_weights)
for i = 0 to length - 1
norm_weight = array.get(cosine_weights, i) / sum_weights
array.set(cosine_weights, i, norm_weight)
// Calculate Cosine-Weighted Moving Average
cwma = 0.0
if bar_index >= length
for i = 0 to length - 1
cwma := cwma + array.get(cosine_weights, i) * src
cwma
Directional Movement System (DMS)
DMS is used to identify trend direction and strength based on directional movement. It uses ADX to gauge trend strength and combines +DI and -DI for directional bias.
// Function to calculate Directional Movement System
f_DMS(simple int dmi_len, simple int adx_len) =>
up = ta.change(high)
down = -ta.change(low)
plusDM = na(up) ? na : (up > down and up > 0 ? up : 0)
minusDM = na(down) ? na : (down > up and down > 0 ? down : 0)
trur = ta.rma(ta.tr, dmi_len)
plus = fixnan(100 * ta.rma(plusDM, dmi_len) / trur)
minus = fixnan(100 * ta.rma(minusDM, dmi_len) / trur)
sum = plus + minus
adx = 100 * ta.rma(math.abs(plus - minus) / (sum == 0 ? 1 : sum), adx_len)
dms_up = plus > minus and adx > minus
dms_down = plus < minus and adx > plus
dms_neutral = not (dms_up or dms_down)
signal = dms_up ? 1 : dms_down ? -1 : 0
Relative Strength System (RSS)
RSS employs RSI and an adjustable moving average type (SMA, EMA, or HMA) to evaluate whether the market is in a bullish or bearish state.
// Function to calculate Relative Strength System
f_RSS(rsi_src, rsi_len, ma_type, ma_len) =>
rsi = ta.rsi(rsi_src, rsi_len)
ma = switch ma_type
"SMA" => ta.sma(rsi, ma_len)
"EMA" => ta.ema(rsi, ma_len)
"HMA" => ta.hma(rsi, ma_len)
signal = (rsi > ma and rsi > 50) ? 1 : (rsi < ma and rsi < 50) ? -1 : 0
ATR Adjustments
To minimize false signals, the HTMA, SWMA, and CWMA signals are adjusted with an Average True Range (ATR) filter:
// Calculate ATR adjusted components for HTMA, CWMA and SWMA
float atr = ta.atr(atr_len)
float htma_up = htma + (atr * atr_mult)
float htma_dn = htma - (atr * atr_mult)
float swma_up = swma + (atr * atr_mult)
float swma_dn = swma - (atr * atr_mult)
float cwma_up = cwma + (atr * atr_mult)
float cwma_dn = cwma - (atr * atr_mult)
This adjustment allows for better adaptation to varying market volatility, making the signal more reliable.
Signals and Trend Calculation
The indicator generates a Trend Signal by aggregating the output from each component. Each component provides a directional signal that is combined to form a unified trend reading. The trend value is then converted into a long (1), short (-1), or neutral (0) state.
Backtesting Mode and Performance Metrics
The Backtesting Mode includes a performance metrics table that compares the Buy and Hold strategy with the TrigWave Suite strategy. Key statistics like Sharpe Ratio, Sortino Ratio, and Omega Ratio are displayed to help users assess performance. Note that due to labels and plotchar use, automatic scaling may not function ideally in backtest mode.
Alerts and Visualization
Trend Direction Alerts: Set up alerts for long and short signals
Color Bars and Gradient Option: Bars are colored based on the trend direction, with an optional gradient for smoother visual feedback.
Important Notes
Customization: Default settings are experimental and not intended for trading/investing purposes. Users are encouraged to adjust and calibrate the settings to optimize results according to their trading style.
Backtest Results Disclaimer: Please note that backtest results are not indicative of future performance, and no strategy guarantees success.

ToxicJ3ster - Day Trading SignalsThis Pine Script™ indicator, "ToxicJ3ster - Signals for Day Trading," is designed to assist traders in identifying key trading signals for day trading. It employs a combination of Moving Averages, RSI, Volume, ATR, ADX, Bollinger Bands, and VWAP to generate buy and sell signals. The script also incorporates multiple timeframe analysis to enhance signal accuracy. It is optimized for use on the 5-minute chart.
Purpose:
This script uniquely combines various technical indicators to create a comprehensive and reliable day trading strategy. Each indicator serves a specific purpose, and their integration is designed to provide multiple layers of confirmation for trading signals, reducing false signals and increasing trading accuracy.
1. Moving Averages: These are used to identify the overall trend direction. By calculating short and long period Moving Averages, the script can detect bullish and bearish crossovers, which are key signals for entering and exiting trades.
2. RSI Filtering: The Relative Strength Index (RSI) helps filter signals by ensuring trades are only taken in favorable market conditions. It detects overbought and oversold levels and trends within the RSI to confirm market momentum.
3. Volume and ATR Conditions: Volume and ATR multipliers are used to identify significant market activity. The script checks for volume spikes and volatility to confirm the strength of trends and avoid false signals.
4. ADX Filtering: The ADX is used to confirm the strength of a trend. By filtering out weak trends, the script focuses on strong and reliable signals, enhancing the accuracy of trade entries and exits.
5. Bollinger Bands: Bollinger Bands provide additional context for the trend and help identify potential reversal points. The script uses Bollinger Bands to avoid false signals and ensure trades are taken in trending markets.
6. Higher Timeframe Analysis: This feature ensures that signals align with broader market trends by using higher timeframe Moving Averages for trend confirmation. It adds a layer of robustness to the signals generated on the 5-minute chart.
7. VWAP Integration: VWAP is used for intraday trading signals. By calculating the VWAP and generating buy and sell signals based on its crossover with the price, the script provides additional confirmation for trade entries.
8. MACD Analysis: The MACD line, signal line, and histogram are calculated to generate additional buy/sell signals. The MACD is used to detect changes in the strength, direction, momentum, and duration of a trend.
9. Alert System: Custom alerts are integrated to notify traders of potential trading opportunities based on the signals generated by the script.
How It Works:
- Trend Detection: The script calculates short and long period Moving Averages and identifies bullish and bearish crossovers to determine the trend direction.
- Signal Filtering: RSI, Volume, ATR, and ADX are used to filter and confirm signals, ensuring trades are taken in strong and favorable market conditions.
- Multiple Timeframe Analysis: The script uses higher timeframe Moving Averages to confirm trends, aligning signals with broader market movements.
- Additional Confirmations: VWAP, MACD, and Bollinger Bands provide multiple layers of confirmation for buy and sell signals, enhancing the reliability of the trading strategy.
Usage:
- Customize the input parameters to suit your trading strategy and preferences.
- Monitor the generated signals and alerts to make informed trading decisions.
- This script is made to work best on the 5-minute chart.
Disclaimer:
This indicator is not perfect and can generate false signals. It is up to the trader to determine how they would like to proceed with their trades. Always conduct thorough research and consider seeking advice from a financial professional before making trading decisions. Use this script at your own risk.

Quantiple Direction IndexThis indicator indicates market trends by analyzing the following signals:
1. RSI which is a momentum oscillator
2. Directional Movement Index (DMI) which measures the direction of the movement
3. Price in comparison to EMA 13 and 21 to determine whether the trend is clear or there is an ambiguity
4. ADX that shows the strength of the momentum
Scoring logic
While we have kept the source code open which gives the scoring logic, for ease of the user, I am summarizing the scoring logic
A. We break down RSI and DMI into a 9 point scale (-4 to +4) from extremely bearish to bullish. Then we give equal weight to both and come out with a direction score.
B. We use EMA to determine if their is clarity in the price trend. While the direction is deduced from point A, if there is clarity we know that the confidence on the direction is high. If EMA 13 is higher than EMA 21 and the price is above EMA 13, then we assign it as a score of +1 as we get clear bullish trend. Similarly if EMA 13 is below EMA 21 and the price is below both the EMAs then we assign it a score of -1 as we get clear bearish trend. Anything else is considered as inconclusive and given a score of 0
C. We use ADX to determine the strength of the directional momentum. It is like acceleration. We use ADX score as an strength adjustment factor. If the value is above 25 - we multiply A+B by 1.25. Similarly we multiply it by 0.75 if the strength is weak and no change if the strength is neutral.
Finally this indicator categorizes market direction into five levels:
- Very Bullish
- Bullish
- Neutral
- Bearish
- Very Bearish
Scores range from +6 (very bullish) to -6 (very bearish), with the user setting thresholds for each category. The midpoint between Bullish and Bearish defines the neutral zone.
Again all the exact values are in the code and the user can also customize as per their trading system.
Why does it make sense to combine these different indicators rather than looking at them in isolation?
We give equal weight to RSI and DMI to derive the direction of the price movement. Using two different indicators provide a better confirmation on the direction. However, this alone is not sufficient.
We want clarity of the direction and for that we use the EMA score (please refer to point B above). If we have clarity, the probability of the direction being right goes up.
Once we know the direction, we want to know what is the strength of that direction. This point is very valuable for an option trader. This is where this indicator brings value.
Please note that by looking at these indicators in isolation one can get a sense of direction or a sense of strength of the direction. But, when you combine them, you get whether the direction move is with strength or not. If you are into option trading, you will clearly understand the rational behind it when you look at the trading rules provided in this description. For example if one knows that the direction is bullish (which one can potentially get from RSI or DMI), one can either buy a call or sell a put. But one knows that not only the direction is bullish, but it has the right acceleration (strength of the momentum), then one will assign higher probability of higher profit from buying call than from selling put.
To summarize we have combined indicators to achieve the following
1. Get confirmation from two different indicators on the direction of the price movement (RSI and DMI)
2. Confirm that the direction is clear (Price relative to EMA)
3. Combine with the strength of the direction (ADX)
Direction, clarity of the direction and the strength of the directional movement is a valuable trading indicator in our opinion.
Suggested trading rules
1. Short strangle strategy when the trend is neutral with one's usual option selling quantity. Equal quantity on put and call.
2. Full quantity short put and half quantity short call when the trend is bullish.
3. Full quantity short put and call long when the indicator is very bullish.
4. Vice versa for bearish ( full call short, half put short) and very bearish (full call short, put long)
Suggested to use 5 min timeframe for scalping, 15 min for intraday positions, 1 hour for weekly and monthly positions, and daily/weekly for investments.
The value of this indicator oscillates between +6 to -6. You can tweak the range for V bullish, bullish, bearish, and v bearish. The values in between will default to the neutral zone.
Disclaimers:
1. While the creator has used this in the live market, no claim is being made on its effectiveness or profit making ability. Please use it for trading only after you have tested it and are satisfied.
2. There may be thousands or millions of better trader in this world than the creator of this script. The creator makes no claim of his intelligence or trading ability.
3. The creator has no intention of selling this particular script now or in future. This is purely for community use and there's no intention to make any monetary profit from it.
4. The creator is not requesting or soliciting anyone to like or promote this script. The creator is also not asking anyone to give him any business now or in future even if they like this script and benefit from it.

Enhanced Reversal DetectionScript Description:
The "Enhanced Reversal Detection" indicator is a powerful tool designed to identify potential market reversals across various financial instruments. It incorporates a sophisticated algorithm that analyzes price action along with key technical indicators such as the Relative Strength Index (RSI), Bollinger Bands, and Moving Average (MA).
How to Use:
Adjustable Parameters: The indicator offers a range of adjustable parameters to cater to different trading preferences and market conditions.
RSI Length: Adjusts the length of the RSI calculation to fine-tune sensitivity.
Overbought Level: Sets the threshold for identifying overbought conditions on the RSI scale.
Oversold Level: Sets the threshold for identifying oversold conditions on the RSI scale.
Bollinger Bands Length: Determines the length of the Bollinger Bands calculation.
Bollinger Bands Multiplier: Adjusts the standard deviation multiplier for the Bollinger Bands, influencing band width.
Moving Average Length: Defines the length of the Moving Average calculation to capture trend direction.
Min Bars Between Signals: Sets the minimum number of bars required between consecutive reversal signals.
ADX Length: Adjusts the length of the Average Directional Index (ADX) calculation.
ADX Threshold: Defines the threshold value for ADX, serving as a filter for reversal signals.
Signal Generation: The indicator generates signals for both bullish and bearish reversals based on predefined criteria. A bullish reversal signal is triggered when the closing price exceeds the lower Bollinger Band and RSI falls below the oversold threshold. Conversely, a bearish reversal signal occurs when the closing price falls below the upper Bollinger Band and RSI surpasses the overbought threshold.
Alerts: Traders can opt to receive alerts for bullish and bearish reversal signals, enabling them to stay informed of potential trading opportunities even when away from the platform.
Publication Readiness:
To ensure readiness for publication in the TradingView public library, the script has been meticulously crafted and documented:
The code is extensively commented to provide clear explanations of parameters, calculations, and signal generation logic.
Best coding practices have been followed to enhance readability and maintainability.
Rigorous testing has been conducted to validate the accuracy and reliability of signal generation across various market conditions.
The script adheres to TradingView's guidelines and policies for script publication, ensuring compliance with platform standards and user expectations.
With its comprehensive features and user-friendly design, the "Enhanced Reversal Detection" indicator is poised to become a valuable asset for traders seeking to identify high-probability reversal opportunities in the financial markets.

MyLibrary_functions_D_S_3D_D_T_PART_1Library "MyLibrary_functions_D_S_3D_D_T_PART_1"
TODO: add library description here
color_(upcolor_txt, upcolor, dncolor_txt, dncolor, theme)
Parameters:
upcolor_txt (color)
upcolor (color)
dncolor_txt (color)
dncolor (color)
theme (string)
Source_Zigzag_F(Source)
Parameters:
Source (string)
p_lw_hg(Source_low, Source_high, Depth)
Parameters:
Source_low (float)
Source_high (float)
Depth (int)
lowing_highing(Source_low, Source_high, p_lw, p_hg, Deviation)
Parameters:
Source_low (float)
Source_high (float)
p_lw (int)
p_hg (int)
Deviation (int)
ll_lh(lowing, highing)
Parameters:
lowing (bool)
highing (bool)
down_ll_down_lh(ll, lh, Backstep)
Parameters:
ll (int)
lh (int)
Backstep (int)
down(down_ll, down_lh, lw, hg)
Parameters:
down_ll (bool)
down_lh (bool)
lw (int)
hg (int)
f_x_P_S123_lw(lw_, hg_, p_lw_, down, Source_low)
Parameters:
lw_ (int)
hg_ (int)
p_lw_ (int)
down (int)
Source_low (float)
f_x_P_S123_hg(lw_, hg_, p_hg_, down, Source_high)
Parameters:
lw_ (int)
hg_ (int)
p_hg_ (int)
down (int)
Source_high (float)
Update_lw_hg_last_l_last_h(lw, hg, last_l, last_h, p_lw, p_hg, down, Source_low, Source_high)
Parameters:
lw (int)
hg (int)
last_l (int)
last_h (int)
p_lw (int)
p_hg (int)
down (int)
Source_low (float)
Source_high (float)
x1_P_y1_P_x2_P_y2_P_x3_P_y3_P_x4_P_y4_P(lw, hg, last_l, last_h, Source)
Parameters:
lw (int)
hg (int)
last_l (int)
last_h (int)
Source (string)
x1_P_os(lw, hg, x2_D, Diverjence_MACD_Line_, Diverjence_MACD_Histagram_, Diverjence_RSI_, Diverjence_Stochastic_, Diverjence_volume_, Diverjence_CCI_, Diverjence_MFI_, Diverjence_Momentum_, Diverjence_OBV_, Diverjence_ADX_, MACD, hist_MACD, RSI, volume_ok, Stochastic_K, CCI, MFI, momentum, OBV, adx)
Parameters:
lw (int)
hg (int)
x2_D (int)
Diverjence_MACD_Line_ (bool)
Diverjence_MACD_Histagram_ (bool)
Diverjence_RSI_ (bool)
Diverjence_Stochastic_ (bool)
Diverjence_volume_ (bool)
Diverjence_CCI_ (bool)
Diverjence_MFI_ (bool)
Diverjence_Momentum_ (bool)
Diverjence_OBV_ (bool)
Diverjence_ADX_ (bool)
MACD (float)
hist_MACD (float)
RSI (float)
volume_ok (float)
Stochastic_K (float)
CCI (float)
MFI (float)
momentum (float)
OBV (float)
adx (float)
x3_P_os(lw, hg, x2_D, x4_D, Diverjence_MACD_Line_, Diverjence_MACD_Histagram_, Diverjence_RSI_, Diverjence_Stochastic_, Diverjence_volume_, Diverjence_CCI_, Diverjence_MFI_, Diverjence_Momentum_, Diverjence_OBV_, Diverjence_ADX_, MACD, hist_MACD, RSI, volume_ok, Stochastic_K, CCI, MFI, momentum, OBV, adx)
Parameters:
lw (int)
hg (int)
x2_D (int)
x4_D (int)
Diverjence_MACD_Line_ (bool)
Diverjence_MACD_Histagram_ (bool)
Diverjence_RSI_ (bool)
Diverjence_Stochastic_ (bool)
Diverjence_volume_ (bool)
Diverjence_CCI_ (bool)
Diverjence_MFI_ (bool)
Diverjence_Momentum_ (bool)
Diverjence_OBV_ (bool)
Diverjence_ADX_ (bool)
MACD (float)
hist_MACD (float)
RSI (float)
volume_ok (float)
Stochastic_K (float)
CCI (float)
MFI (float)
momentum (float)
OBV (float)
adx (float)
Err_test(lw, hg, x1, y1, x2, y2, y_d, start, finish, Err_Rate)
Parameters:
lw (int)
hg (int)
x1 (int)
y1 (float)
x2 (int)
y2 (float)
y_d (float)
start (int)
finish (int)
Err_Rate (float)
divergence_calculation(Feasibility_RD, Feasibility_HD, Feasibility_ED, lw, hg, Source_low, Source_high, x1_P_pr, x3_P_pr, x1_P_os, x3_P_os, x2_P_pr, x4_P_pr, oscillator, Fix_Err_Mid_Point_Pr, Fix_Err_Mid_Point_Os, Err_Rate_permissible_Mid_Line_Pr, Err_Rate_permissible_Mid_Line_Os, Number_of_price_periods_R_H, Permissible_deviation_factor_in_Pr_R_H, Number_of_oscillator_periods_R_H, Permissible_deviation_factor_in_OS_R_H, Number_of_price_periods_E, Permissible_deviation_factor_in_Pr_E, Number_of_oscillator_periods_E, Permissible_deviation_factor_in_OS_E)
Parameters:
Feasibility_RD (bool)
Feasibility_HD (bool)
Feasibility_ED (bool)
lw (int)
hg (int)
Source_low (float)
Source_high (float)
x1_P_pr (int)
x3_P_pr (int)
x1_P_os (int)
x3_P_os (int)
x2_P_pr (int)
x4_P_pr (int)
oscillator (float)
Fix_Err_Mid_Point_Pr (bool)
Fix_Err_Mid_Point_Os (bool)
Err_Rate_permissible_Mid_Line_Pr (float)
Err_Rate_permissible_Mid_Line_Os (float)
Number_of_price_periods_R_H (int)
Permissible_deviation_factor_in_Pr_R_H (float)
Number_of_oscillator_periods_R_H (int)
Permissible_deviation_factor_in_OS_R_H (float)
Number_of_price_periods_E (int)
Permissible_deviation_factor_in_Pr_E (float)
Number_of_oscillator_periods_E (int)
Permissible_deviation_factor_in_OS_E (float)
label_txt(label_ID, zigzag_Indicator_1_, zigzag_Indicator_2_, zigzag_Indicator_3_)
Parameters:
label_ID (string)
zigzag_Indicator_1_ (bool)
zigzag_Indicator_2_ (bool)
zigzag_Indicator_3_ (bool)
delet_scan_item_1(string_, NO_1, GAP)
Parameters:
string_ (string)
NO_1 (int)
GAP (int)
delet_scan_item_2(string_, NO_1, GAP)
Parameters:
string_ (string)
NO_1 (int)
GAP (int)
calculation_Final_total(MS_MN, Scan_zigzag_NO, zigzag_Indicator, zigzag_Indicator_1, zigzag_Indicator_2, zigzag_Indicator_3, LW_hg_P2, LW_hg_P1, lw_1, lw_2, lw_3, hg_1, hg_2, hg_3, lw_hg_D_POINT_ad_Array, lw_hg_D_POINT_id_Array, Array_Regular_MS, Array_Hidden_MS, Array_Exaggerated_MS, Array_Regular_MN, Array_Hidden_MN, Array_Exaggerated_MN)
Parameters:
MS_MN (string)
Scan_zigzag_NO (string)
zigzag_Indicator (bool)
zigzag_Indicator_1 (bool)
zigzag_Indicator_2 (bool)
zigzag_Indicator_3 (bool)
LW_hg_P2 (int)
LW_hg_P1 (int)
lw_1 (int)
lw_2 (int)
lw_3 (int)
hg_1 (int)
hg_2 (int)
hg_3 (int)
lw_hg_D_POINT_ad_Array (array)
lw_hg_D_POINT_id_Array (array)
Array_Regular_MS (array)
Array_Hidden_MS (array)
Array_Exaggerated_MS (array)
Array_Regular_MN (array)
Array_Hidden_MN (array)
Array_Exaggerated_MN (array)
Search_piote_1(array_id_7, scan_no)
Parameters:
array_id_7 (array)
scan_no (int)

Powertrend - Volume Range Filter Strategy [wbburgin]The Powertrend is a range filter that is based off of volume, instead of price. This helps the range filter capture trends more accurately than a price-based range filter, because the range filter will update itself from changes in volume instead of changes in price. In certain scenarios this means that the Powertrend will be more profitable than a normal range filter.
Essentials of the Strategy
This is a breakout strategy which works best on trending assets with high volume and liquidity. It should be used on middle to higher timeframes and can be used on all assets that have volume provided by the data source (stocks, crypto, forex). It is long-only as of now. It can work on lower timeframes if you optimize the strategy filters to make less trades or if your exchange/broker is low/no fees, provided that your exchange/broker has high liquidity and volume.
The strategy enters a long position if the range filter is trending upwards and the price crosses over the upper range band, which signifies a price-volume breakout. The strategy closes the long position if the range filter is trending downwards and the price crosses under the lower range band, which signifies a breakdown. Both these conditions can be altered by the three filter options in the settings. The default trend filter is not alterable because it helps prevent false entries and exits that are against the trend.
Settings
The Length setting is the lookback period for the range smoothing.
The ADX Filter setting enables you to turn on an ADX filter, which will halt entries and exits unless the ADX of your customizable length is above a ADX VWMA of that length.
The Range Supertrend setting creates a supertrend from the top and bottom ranges, which can be used to filter entries and exits. The length is customizable. The filter can show you whether the range is making higher highs and lower lows. Below is an example of the Range Supertrend being used as a filter and plotted on-chart:
The VWMA setting halts entries if they are below a customizable length VWMA.
Both the Range Supertrend and the VWMA can also be plotted separately without actually filtering the strategy, so that you can use them independently if you wish. You can turn off the bar color, the highlighting, and the labels if you wish in the settings. A note about the bar color: if the color changes but the strategy does not signal an exit or entry this means that the crossover was against the trend. In these circumstances it may be indicative of a pullback to enter or exit or to add onto your position.
About the Strategy Results Below
A range filter is normally composed of two components - the range filter itself and a smoothing function. In the development of this script I tested both normal and volume-based varieties of the range filter and the smoothing function:
Tests Performed
Volume-based Range x VWMA smoothing
Price-based Range x VWMA smoothing
Price-based Range x EMA smoothing
Volume-based Range x EMA smoothing (final result)
The highest-performing was a volume-based range filter and a normal EMA-based smoothing function, but that does not mean that this strategy will be profitable - exits are based off of signal reversion so I strongly encourage you to develop your own take profits/stop losses for the strategy if you think it may be a good fit for you. The results below are with a commission value of 0.05% (because I built the strategy first for equities), slippage of 3, so if your exchange/broker has a higher fee schedule, I recommend adding filters and/or moving to higher timeframes for the strategy. Additionally, I used 10% of equity in each trade, while using the Range Supertrend filter (the previous upload was unrealistic because it used 100% of equity - missed a 0, apologies, and added in slippage).

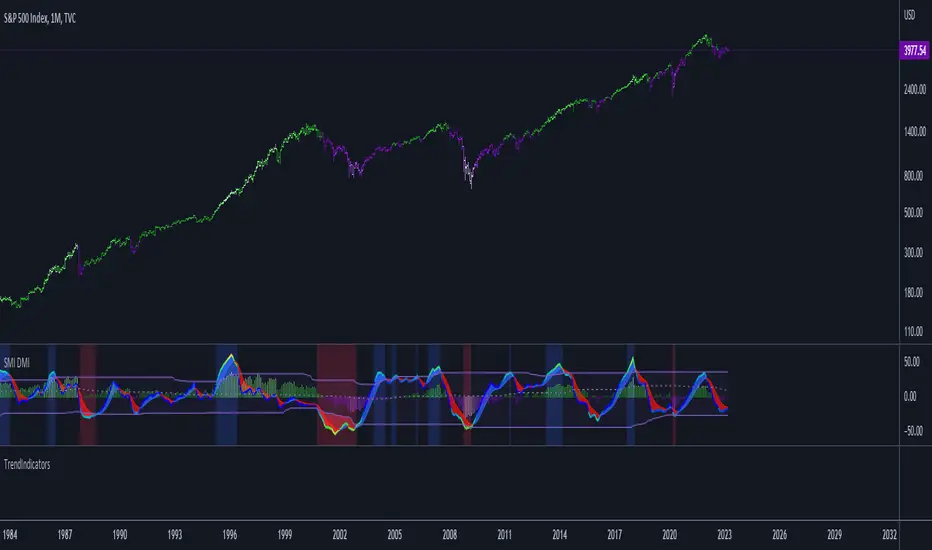
TrendIndicatorsLibrary "TrendIndicators"
This is a library of 'Trend Indicators'.
It aims to facilitate the grouping of this category of indicators, and also offer the customized supply of
the source, not being restricted to just the closing price.
Indicators (this is a work in progress):
1. Absolute DI (Directional Moviment Index) (Difference between DI+ and DI-).
Used in 'DMI Stochastic Extreme' by Barbara Star.
2. DMI
DI_Abs(lengthDI, smoothDI, typeMA, lengthMA)
@description Absolute DI (Directional Moviment Index).
Used in 'DMI Stochastic Extreme' by Barbara Star.
Difference between DI+ and DI-
Parameters:
lengthDI : (int) Length of DI+/DI-
smoothDI : (bool) Sets whether absolute DI should be smoothed
typeMA : (int) Type of moving average of smoothing
lengthMA : (int) Length for moving average of smoothing
Returns: (float) Absolute value of DI
dmi(diLength, adxSmoothing)
@description DMI (Directional Movement Index)
Same as ta.dmi()
Parameters:
diLength : (int) Length of DI+/DI-
adxSmoothing : (int) ADX Smoothing
Returns: Tuple of three DMI series: Positive Directional
Movement (+DI), Negative Directional Movement (-DI) and Average Directional Movement Index (ADX).
dmi(source, diLength, adxSmoothing)
@description DMI (Directional Movement Index)
Customized version of ta.dmi(), with custom source
Parameters:
source : (float) Source for DI+/DI-
diLength : (int) Length of DI+/DI-
adxSmoothing : (int) ADX Smoothing
Returns: Tuple of three DMI series: Positive Directional
Movement (+DI), Negative Directional Movement (-DI) and Average Directional Movement Index (ADX).
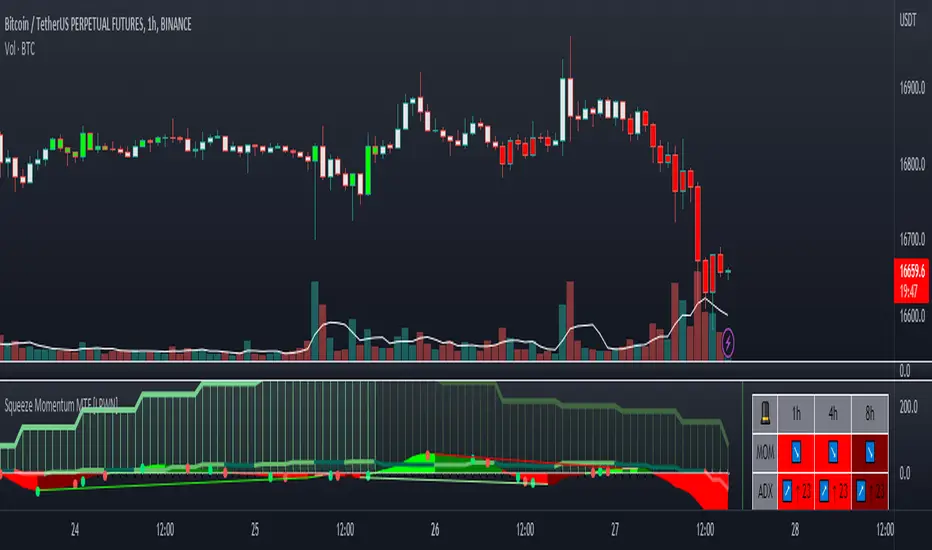
Squeeze Momentum MTF [LPWN]//ENGLISH
Squeeze momentum of lazy bear, multiple time frames, It gives you information if the cycles with high temporality momentums are in harmony, by default two more momentums are shown, I prefer to use only one extra, in the options you can change the time frame of the momentums, in addition to the momentums you can add the RSI and ADX, if the momentum look small, you can change the value of general scale to make them bigger, the table gives us information on how the momentums and the adx are, in the options you can set the candles to color according to the harmony of the momentums
// SPANISH
Squeeze momentum de lazy bear, multiple time frames, te da informacion si los ciclos con momentums de temporalidad alta estan en armonia,por defecto se muestran dos momentums mas, yo prefiero usar solo uno extra, en las opcoines puedes cambiar la temporalidad de los momentums, ademas de los momentums puedes agregar el RSI y el ADX, si el momentum se ve pequeño, puedes cambiar el valor de general scale para hacerlos mas grandes, la tabla nos da infomracion de como estan los momentums y el adx, en las opciones puedes poner que las velas se pongan del color de acuerdo a la armonia de los momentums
MACD With Trend Filter: Visual Backtest Module TemplateSample Strategy: MACD Crossover with trend filter options
MA Filter : Price Close Above MA, Search for Buy, Price Close Below MA, Search for Sell
ADX Filter : Take trade only when ADX is above certain treshold
MACD Signal : MACD Cross above signal line while under 0 line indicate Buy Signal
MACD Cross below signal line while above 0 line indicate Sell Signal
-----------------------------
Using Alert Module:
Enable Alert --> Enable TV's alert and plot signal to chart
Alert Type --> Set to take Buy only, Sell only or Both alert
----------------------------
Using Backtest Module:
Enable Backtest --> Enable Backtest simulation
Backtest Type --> Set to take Buy only, Sell only or Both
SL Type -->
ATR : Set SL in ATR times Multiplier below/above entry price
Fixed : Set SL in fixed point below entry point (in 'Dollar'). e.g. for Stocks -> 0.5 equals to 50cent while for EURUSD currency -> 0.005 equal to 50 pips
HiLo Bar : Set SL at highest/lowest wick of previous bar plus/minus Fixed point. e.g. EURUSD HiLo=3 and Fixed Point = 0.0005, buy trade will place SL 5 Pips below lowest of previous 3 bar
SL ATR Period --> Set Lookback Period used for SL's ATR calculation
SL ATR Multi --> Set ATR Multiplier for SL
SL Fixed --> Set Fixed Level for SL (Use when SL Type is either Fixed or HiLo Bar)
SL Bar --> Set Number of previous bar to check for SL placement
TP RR Ratio --> Set TP based on RR multiplier. e.g. 2 means TP level will be twice further from entry point compared to Entry-SL distance.
Notes: The point is for preliminary testing, so it only supports 1 trade at a time and no Trailing Stop
----------------------------
Disclaimer:
This script main objective is to create my personal indicator template so that i just have to modify the indicator module for preliminary testing in future.
Testing Alert Module so i can re-use it as template in future study/indicator
Testing Visual Backtest Module so i can re-use it as template in future study/indicator
i believe using Strategy function is a better approach for this but the entry/exit level seems to be hit n miss (at least for me, still trying to figure what i did wrong)
also, i rather code the strategy in other platform where i can use the more accurate tick data if i want to validate backtest statistics.
My study scripts was built only to test/visualize an idea to see its viability and if it can be used to optimize existing strategy.
credit: ADX code are originally from "ADX and DI" by @BeikabuOyaji although i re-wrote so i can have cleaner read and use RMA instead of SMA

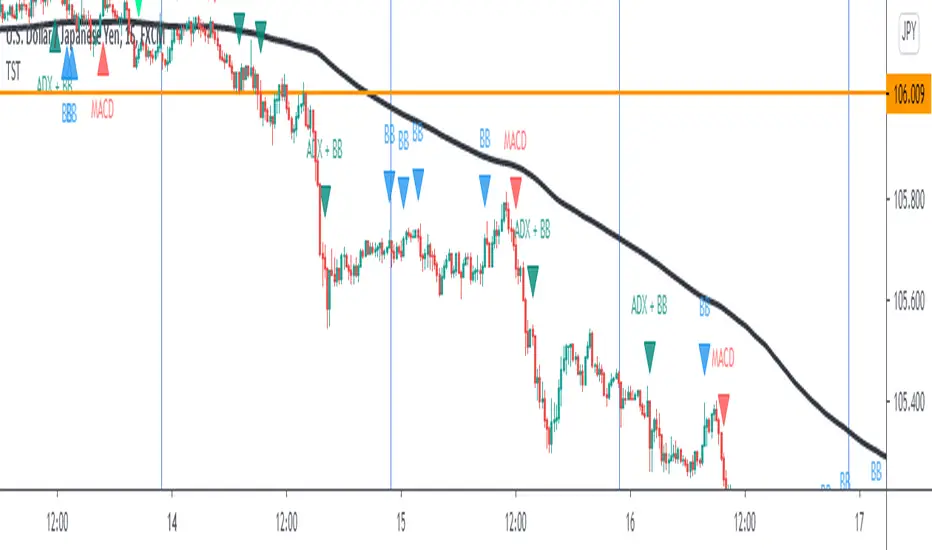
TST Signals & AlertsThis is an unofficial script for strategies tested on Trading Strategy Testing Youtube channel. Over time, most successful strategies will be added with an option to set strategy-specific alerts . TST Signals & Alerts will draw signals on the chart when the entry conditions are met. You can also opt for displaying indicators .
My script is meant for beginners but can be used by veterans too. Just pick one or two strategies, you don't want to flood your chart with conflicting signals. You may want to support your trades with a proper analysis. Is the market trending? Is there a fundament around the corner?
If a new signal occurs when there is still an open position, you are not supposed to take another.
The current version includes MACD and ADX + BB and BB strategies.
MACD strategy:
►Buy, when MACD crosses below the signal line when it is negative. The price must also be above 200 EMA.
►Sell, when MACD crosses above the signal line when it is positive. The price must also be below 200 EMA.
►This strategy was tested on 15-minute charts of EURUSD with reward-to-risk ratio 1,5 and win rate of 61% over 100 trades.
►►►MACD has to be added to your chart separately because it needs a new window. Ticking display indicators will not add MACD to your chart.
►►►MACD was also tested by a different channel I made a script for. You can view the results and the script here:
ADX + BB strategy:
►Buy, when the price is above 200 EMA and ADX becomes higher than 25.
►Sell, when the price is below 200 EMA and ADX becomes higher than 25.
►Stop-loss is either 200 EMA or Bollinger Bands level. Check the channel for more information.
►This strategy was tested on 5-minute charts of EURUSD, USDJPY, AUDUSD with reward-to-risk ratio 1,2 and win rate of 56% over 100 trades in total.
BB strategy:
►Buy, when the price is above 200 EMA and candle's low is below the lower Bollinger Band.
►Sell, when the price is below 200 EMA and candle's high is above the upper Bollinger Band.
►This strategy was tested on 15-minute charts of EURUSD with reward-to-risk ratio 1,5 and win rate of 52% over 100 trades in total.
►►►Due to the relatively low win rate of this strategy, you need to filter out potentially harmful signals with a proper analysis.
Bear in mind that backtesting performance doesn't guarantee future profitability. • Most systematic strategies are not suitable for each timeframe - if you use the different timeframe than the one it was tested on, the result can differ significantly. • You should perform your own backtest to base your trades on more data & to establish confidence in the selected strategy. • This script is not a replacement for proper analysis.
New strategies will be added when I have time. If I see multiple people asking for the same feature, I might agree to release it with a new version. I am not going to add input options in this script, it could come as a separate script though. I am in no way affiliated with the Youtube channel, so if you find the script helpful, shot me a message or send me some TradingView coins >)
If you encounter any bug, you can report it in a message or in comments. Support it with screenshot and relevant information such as a time when it occurred and what options were on etc.
Stochastic Pop and Drop by Jake Bernstein v1 [Bitduke]I found a simple strategy by Jake Bernstein, modified it a little and created a strategy with Risk Management System (SL+TP); After that I test it on the different cryptocurrency pairs.
About the Indicator
Basically it's the strategy of 2 indicators: Stochastic Oscillator to define the bias and Average Directional Index to confirm it.
One again, It uses Stochastic Oscillator to define the trading bias. In particular, the trading bias was deemed bullish when the weekly 14-period Stochastic Oscillator was above some default value (in him paper - 50) and rising and vice versa.
Once the trading bias is established, Steckler used the Average Directional Index (ADX) to define a slowdown in the trend. ADX measures the strength of the trend and a move below 20 signals a weak trend.
Modifications
I didn't implement Average Directional Index (ADX) and test just different sources for data, oscillator periods and different levels in relation to the crypto market.
So, it shows good results with two tight thresholds at 55 and 45 level.
The bar chart below the defining the bullish and bearish periods (green and red) and gives a signal to enter the trade (purple bars).
Backtesting
Backtested on XBTUSD , BTCPERP (FTX) pairs. You may notice it shows good results on 3h timeframe.
Relatively low drawdown
~ 10% (from 2019 to date) FTX
~ 22% (4 years from 2016) Bitmex
I backtested on the different altcoin pairs as well, but the results were just not good.
Relatively good results were shown by some index pairs from the FTX exchange ( FTX:SHITPERP ), but I think there is a few data for backtesting to be asure in them.
Bitmex 3h (2017 - 2020) :
i.imgur.com
FTX 3h (2019 - 2020):
i.imgur.com
Possible Improvements
- Regarding trading algorithm it would be good to check with strategy with ADX somehow. Maybe for the better entries
- As for Risk Management system, it can be improved by adding trailing stop to the strategy.
Link: school.stockcharts.com

RSI Shaded - MTF
Non-repainting multiple time frame RSI with shading of overbought and oversold levels.
Includes option for simple moving average smooth of the RSI (Larry Connors)
Includes option to plot the EMA of the RSI
Related to RSI Shaded .
For other multiple time frame indicators see:
Adaptive ATR-ADX Trend
Fisher Transform MTF
ADX-DI MTF
Laguerre RSI MTF
Dynamic Flow Ribbon [Adaptive]The Dynamic Flow Ribbon is a next-generation trend-following tool designed to solve the two biggest problems traders face: Lag and Noise .
Unlike traditional Moving Averages (SMA/EMA) that are often too slow to catch reversals or too sensitive to chop, this indicator utilizes Rational Quadratic Kernel Smoothing . This advanced mathematical approach creates a "Flow Ribbon" that hugs price action tightly during trends while remaining silky smooth, filtering out the random noise that leads to false signals.
This is not just a crossover indicator; it is a complete Market Regime Detector . It automatically identifies when the market is trending and when it is ranging, helping you stay out of dangerous "chop" zones.
Why Use This?
Zero-Lag Smoothing: Experience the responsiveness of a fast EMA with the smoothness of a slow SMA.
Chop Filter: The ribbon automatically turns Gray when volatility (ADX) drops, signaling you to sit on your hands and preserve capital.
Visual Clarity: No messy lines. Just a clean, glowing ribbon that tells you the trend direction instantly.
How It Works
The indicator calculates two dynamic curves:
Fast Flow Line: Tracks immediate price action using a tight kernel window.
Base Flow Line: A slower, weighted baseline that acts as the trend anchor.
The Ribbon: The space between these lines forms the "Ribbon."
Green (Bullish): Fast Flow > Base Flow. The trend is Up.
Red (Bearish): Fast Flow < Base Flow. The trend is Down.
Gray (Flat): Volatility is too low (ADX < Threshold). The market is sideways.
How to Trade
This tool is best used for Trend Continuation and Reversal Catching .
The Entry: Wait for a Crossover Signal (Small Circle).
Buy when the Ribbon flips Green.
Sell when the Ribbon flips Red.
The Filter: If the Ribbon is Gray , ignore all signals. This prevents you from getting whipsawed in a ranging market.
The Exit: You can ride the trend until the Ribbon flips color, or use your own support/resistance targets.
Settings
Bandwidth (Smoothness): Adjusts the sensitivity of the kernel. Higher values = smoother ribbon (better for swing trading). Lower values = faster reaction (better for scalping).
Trend Filter: Toggle the ADX-based chop filter on/off.
Visuals: Fully customizable colors to match your chart aesthetic.
Pro Tip: Combine for Maximum Accuracy
While the Dynamic Flow Ribbon is excellent for Trend Direction, it does not plot Support & Resistance levels.
For the ultimate trading setup, I highly recommend pairing this with my AIO Pivot Master
or any other pivot indicator, which you can easily find on TradingView.
Use Dynamic Flow to determine the Direction .
Use AIO Pivot Master to find your Entry and Exit targets .
Disclaimer
For Educational and Informational Purposes Only
This indicator is provided for educational and informational purposes only and DOES NOT constitute financial, investment, or trading advice. It does not predict future market movements with certainty.
Risk Warning
Trading in financial markets (Stocks, Crypto, Futures, Forex, etc.) involves a high degree of risk and may not be suitable for all investors. You could lose some or all of your initial investment. Past performance of any trading system or methodology is not necessarily indicative of future results.
No Liability
The author of this script assumes no responsibility or liability for any errors or omissions in the content of this indicator, or for any trading losses or damages incurred as a result of using this tool. Users are solely responsible for their own trading decisions and should always use proper risk management. By using this script, you acknowledge and agree to these terms.

ATR# ATR Trailing Stop Multi-Strategy v7 with Pivot & GST
## Overview
A comprehensive multi-indicator trading strategy that combines multiple technical analysis approaches with sophisticated risk management. The strategy uses a confirmation-based system where trades are executed only when multiple indicators agree on the direction.
## Core Strategy Logic
### Signal Confirmation System
- **Entry Condition**: Requires at least 3 confirmation points from different indicators
- **Weighted Indicators**:
- Dow Theory (Weight: 2 points)
- ATR Trailing Stop (Weight: 2 points)
- Gaussian Smooth Trend (Weight: 1 point)
- KAMA (Weight: 1 point)
- VWMA (Weight: 1 point)
- Alligator (Weight: 1 point)
### Exit Conditions
- **Profit Exit**: When opposite signals achieve 3+ confirmation points
- **Stop Loss**: Fixed percentage stop loss (configurable)
- **Filter-Based Exit**: Signals from individual indicators when filters are violated
## Technical Indicators
### 1. Dow Theory Filter
- Analyzes volume and volatility conditions
- Uses SMA 20/50 crossovers for trend direction
- Volume must exceed MA by threshold (default: 1.5x)
- NATR must exceed threshold (default: 1.0%)
### 2. ATR Trailing Stop System
- Three ATR-based trailing lines (Fast/Medium/Slow)
- Fast: ATR(5) × 0.5 multiplier
- Medium: ATR(10) × 1.5 multiplier
- Slow: ATR(20) × 3.0 multiplier
- State changes when medium line crosses slow line
### 3. Gaussian Smooth Trend (GST)
- Advanced smoothing using DEMA, Gaussian filter, and SMMA
- Includes standard deviation bands for volatility filtering
- Multiple color schemes available for visualization
### 4. KAMA (Kaufman Adaptive Moving Average)
- Two KAMA lines with different lengths (10, 24)
- Adaptive smoothing based on market volatility
- Signals generated on crossovers
### 5. VWMA (Volume Weighted Moving Average)
- Price weighted by volume
- Signals on price crossing VWMA
### 6. Alligator Indicator
- Three SMMA lines (Jaw/Teeth/Lips)
- Standard Williams Alligator settings
- Signals based on line alignment and price position
## Entry Block Filters
### ADX Filter (Optional)
- Filters trades based on trend strength
- Configurable min/max values for long and short positions
- Default: ADX between 15-60
### RSI Filter (Optional)
- Additional RSI-based filtering
- Separate ranges for long and short positions
- Default Long: RSI 20-70, Short: RSI 30-80
### NATR Filter (Optional)
- Filters based on normalized ATR
- Ensures minimum volatility for valid signals
- Default Long/Short: NATR 0.5-5.0%
## Additional Filters
### CCI Filter
- Filters signals based on CCI momentum
- Oversold condition for longs: CCI > -100 and rising
- Overbought condition for shorts: CCI < 100 and falling
### Volatility Filter
- Minimum ATR percentage requirement
- Default: 0.3% minimum ATR/price ratio
### Distance Filter
- Minimum distance from Alligator lips in pips
- Ensures sufficient movement before entry
- Default: 10 pips minimum
## Pivot Points Support
- Multiple pivot point calculation methods:
- Traditional
- Fibonacci
- Woodie
- Classic
- DM
- Camarilla
- Multiple timeframe support (Daily, Weekly, Monthly, etc.)
- Visual display of pivot levels and labels
## Risk Management
### Stop Loss
- Configurable percentage-based stop loss
- Default: 2.5%
- Applied immediately on entry
### Position Management
- Single position only (no pyramiding)
- Position tracking with P/L calculation
- Visual exit lines for individual indicator signals
## Visual Features
### Signal Display
- Colored arrows for each indicator signal
- Entry/Exit labels with price information
- Horizontal exit lines for visual confirmation
- All indicators can be toggled on/off
### Color Schemes
- GST with multiple color modes
- Customizable pivot point colors
- Consistent color coding across indicators
## Alerts
- Entry alerts for both long and short positions
- Exit alerts for both profit and stop loss exits
- Individual indicator alerts available
## Settings Overview
### Strategy Settings
- Dow Theory thresholds (Volume, NATR)
- Stop loss percentage
- ATR Trailing parameters
- Indicator toggles and weights
### Filter Settings
- Entry block filters (ADX, RSI, NATR)
- CCI parameters
- Volatility and distance filters
### Visual Settings
- Show/hide indicators
- Arrow and label display
- Color scheme selection
### Pivot Settings
- Calculation method
- Timeframe
- Level colors and visibility
## Usage Recommendations
### Timeframes
- Works on all timeframes
- Pivot points automatically adjust to timeframe
- Recommended: 15-minutes and above
### Market Conditions
- Best in trending markets
- Multiple filters help avoid choppy conditions
- Volume confirmation adds reliability
### Customization
- Adjust confirmation thresholds for more/less aggressive trading
- Modify filters based on market volatility
- Fine-tune stop loss based on risk tolerance
## Performance Notes
- Strategy uses close prices for order execution
- Maximum 500 labels to prevent chart clutter
- All calculations in real-time
- Historical backtesting supported
## Important Notes
- Past performance doesn't guarantee future results
- Test thoroughly before live trading
- Adjust parameters for specific instruments
- Consider commission and slippage in backtesting

ICT Market Regime Detector [TradeHook]🔮 Overview
The **ICT Market Regime Detector** is an advanced market condition classifier designed to identify the current market environment and provide context-aware trading guidance. Rather than generating buy/sell signals, this indicator focuses on answering the crucial question: *"What type of market am I trading in right now?"*
Understanding market regime is fundamental to successful trading. The same strategy that works brilliantly in a trending market can fail spectacularly during consolidation. This indicator automatically classifies market conditions into one of eight distinct regimes, each requiring different trading approaches.
---
🎯 Regime Classifications
The indicator identifies these market states:
| Regime | Description | Recommended Approach |
|------------------------|--------------------------------------------------|--------------------------------------|
| *STRONG TREND* |Directional momen. w/ healthy struc| Cont.entries with OTE pullbacks |
| **WEAK TREND** | Gradual drift with retracements | Conservative Order Block entries |
| **ACCUMULATION** | Institutional buying within range | Longs near range lows |
| **DISTRIBUTION** | Institutional selling within range | Shorts near range highs |
| **CONSOLIDATION** | Tight range, low volatility squeeze | Wait for breakout |
| **EXPANSION** | Volatile breakout phase | Momentum following |
| **REVERSAL** | Structural transition period | Wait for confirmation |
| **CHOPPY** | No clear edge | **Avoid trading** |
---
⚙️ How It Works
**Trend Analysis Engine**
- Calculates ADX (Average Directional Index) using Wilder's smoothing method
- Monitors +DI/-DI for directional bias
- Detects trend health via EMA alignment
- Identifies exhaustion through RSI divergence
**Volatility Analysis Engine**
- Measures current vs historical volatility ratio
- Classifies as LOW, NORMAL, HIGH, or EXTREME
- Tracks volatility expansion/contraction phases
**Range Analysis Engine**
- Calculates dynamic support/resistance boundaries
- Tracks price position within range (0-100%)
- Detects range narrowing (squeeze) and expansion patterns
**Institutional Activity Detection**
- Volume spike identification
- Absorption candle patterns (large wicks, small body)
- Displacement candles (large body, small wicks)
- Accumulation/Distribution pattern recognition
---
🛡️ Risk Management Features
**Daily Loss Limit**
- Set maximum daily loss as percentage of account
- Visual warning when approaching limit
- Alert when limit is breached
**Maximum Daily Trades**
- Configurable trade counter per session
- Prevents overtrading
- Session reset options (NY Open, London Open, etc.)
**Trading Readiness Checklist**
- Clear regime ✓/✗
- Kill zone active ✓/✗
- HTF alignment ✓/✗
- Volatility normal ✓/✗
- Loss limit OK ✓/✗
- Trades remaining ✓/✗
---
📊 Multi-Timeframe Analysis
The indicator includes 4H timeframe regime alignment to ensure lower timeframe setups align with higher timeframe bias. Trades taken with HTF alignment historically have higher probability.
---
⏰ Kill Zone Integration
Built-in ICT Kill Zone detection:
- 🌙 Asian Session (Range Building)
- 🇬🇧 London Open (Prime Execution)
- 🇺🇸 NY AM (Prime Execution)
- 🔫 Silver Bullet (10-11 AM EST)
- 🇺🇸 NY PM (Afternoon Opportunities)
Configurable UTC offset for your timezone.
---
🎨 Visual Features
- **Regime-Colored Bars** - Instantly see current market state
- **Comprehensive Dashboard** - All metrics in one panel
- **Adjustable Table Size** - Tiny/Small/Normal/Large
- **Flexible Positioning** - Place dashboard in any corner
- **Optional Regime Labels** - Mark regime changes on chart
---
⚠️ Important Notes
1. This indicator is a **decision support tool**, not a signal generator
2. Always combine with proper price action analysis
3. Past regime identification doesn't guarantee future performance
4. Risk management settings are for tracking purposes only - actual position management should be done through your broker
5. The indicator works best on liquid markets with consistent volume data
---
📚 Educational Purpose
This indicator is designed for educational purposes to help traders understand market structure and regime classification. It implements concepts from ICT (Inner Circle Trader) methodology including:
- Market structure analysis
- Kill zone timing
- Institutional activity patterns
- Multi-timeframe confluence
---
🔧 Inputs Summary
**Master Toggles**
- Enable/Disable indicator, regime detection, recommendations, risk management, alerts
**Core Settings**
- Analysis lookback periods (short/medium/long)
- ADX thresholds for trend classification
- Volatility spike multiplier
**Risk Management**
- Max daily loss percentage
- Max daily trades
- Account size for P&L calculation
- Session reset timing
**Visualization**
- Dashboard on/off and position
- Regime zones and labels
- Bar coloring
- Table text size
---
💡 Tips for Use
1. **Don't trade CHOPPY regimes** - The indicator explicitly warns when no edge exists
2. **Respect the checklist** - Trade only when multiple conditions align
3. **Adjust ADX thresholds** - Different instruments may require fine-tuning
4. **Monitor regime duration** - Fresh regime changes often present the best opportunities
5. **Use with other TradeHook indicators** - Designed to complement the MTMGBS system
⚖️ DISCLAIMER
This indicator is for **educational and informational purposes only**. It does not constitute financial advice. Trading involves substantial risk of loss and is not suitable for all investors. Past performance is not indicative of future results. Always conduct your own analysis and consult with a qualified financial advisor before making trading decisions.

Multi-Filter Profit MaximizerDescription : This script is a trend-following system designed to maximize profits by capturing extended trends while filtering out market noise. It integrates four core components:
SuperTrend (Customized): Acts as a dynamic trailing stop and trend baseline.
ADX Filter: Ensures signals only occur during active volatility to avoid choppy markets.
CVD (Cumulative Volume Delta): Validates the price movement with actual volume flow.
Stochastic Momentum: Pinpoints high-probability entry entries within the trend.
--------------------------------------------------------------------------------------------------------------
How to Use This Indicator (Profit Maximization Manual)
This indicator is designed to prioritize **“win rate” and “price range”** over the number of entries.
Market Environment Recognition (Background & Lines):
Green background & green line: An uptrend. Focus solely on long positions.
Red background & red line: A downtrend. Focus solely on short positions.
EMA 200 (Orange Line): The iron rule is to go long if the candlestick is above this line, and short if it's below.
Entry (BUY / SELL Signals):
Enter when the BUY or SELL label appears.
This is the moment when the “trend direction,” “momentum via ADX,” “fund flow via CVD,” and “timing via Stochastic” all align perfectly.
Profit Maximization Exit (Most Critical):
Stop Loss (SL): Exit immediately if the candle body breaks below the green (or red) SuperTrend line right after entry. No hesitation.
Take Profit (TP):
Method A (Trend Riding): Hold until the SuperTrend line changes color. If a major trend emerges, this can yield tremendous profits.
Method B (Conservative Approach): Take half the profit at roughly a 1:2 risk-reward ratio, then hold the remainder aligned with the SuperTrend.
Why This is “The Best”
Many indicators get whipped back and forth in range-bound markets, spitting out profits. It's coded to generate absolutely no signals when ADX < 20 (weak market). Furthermore, using SuperTrend as the stop-loss line forces a structure that comes closest to the Holy Grail of trading: **“Small losses, unlimited profits as long as the trend continues.”**

Market State Fear & Greed Bubble Index V1Market State Fear & Greed Bubble Index V1
📊 Comprehensive Market Sentiment Analyzer
This advanced indicator measures market psychology through a multi-dimensional scoring system, combining demand/supply pressure, trend momentum, and statistical extremes to identify fear/greed cycles and trading opportunities.
🎯 Core Features
Five-Factor Fear & Greed Score
Weighted sentiment analysis:
Demand/Supply (25%): Real-time buying/selling pressure
RSI (25%): Momentum extremes
KDJ (20%): Overbought/oversold detection
Bollinger Band % (20%): Statistical positioning
ADX Trend (10%): Trend strength confirmation
Multi-Layer Market State Detection
Extreme Fear/Greed: Statistical bubble identification
Trend Bias: Bullish/Bearish/Neutral classification
Confidence Scoring: Setup reliability assessment
Reversal Alerts: Early trend change signals
Visual Dashboard
Top-right information panel displays:
Fear & Greed Score (0-100)
Market State Classification
Trend Bias & Confidence
Signal Quality & Alerts
📈 Key Components
Fear & Greed Gauge
0-30: Extreme Fear (buying opportunities)
30-47: Fear (accumulation zones)
47-70: Neutral (consolidation)
70-90: Greed (caution zones)
90-100: Extreme Greed (selling opportunities)
Deviation Zones
Red Zone (±17.065): Critical reversal areas
Yellow Zone (±34.135): Warning levels
Blue Zone (±47.72): Statistical extremes where reversals are highly likely. These occur when asset prices are in a bubble that's about to pop.
Signal Types
Buy/Sell Labels: Primary entry/exit signals
Scalp Signals: Short-term opportunities
Bottom/Top Detectors: Extreme reversal zones
Whale Indicators: Institutional activity markers
🚀 Trading Applications
Extreme Fear Setups Conditions:
Fear & Greed Score < 34.135
BB% < 0 or < J-inverted line
RSI < 34.135
Confidence score > 68%
Bullish divergence present
Action: Accumulation positions, scaled entries
Extreme Greed Setup Conditions:
Fear & Greed Score > 68.2
BB% > 100 or > 80 with divergence
RSI > 68.2
ADX showing trend exhaustion
Multiple timeframe resistance
Action: Profit-taking, protective stops
Trend Following
Bullish Conditions:
Sentiment score rising from fear zones
DMI+ above DMI- and rising
Confidence > 75%
Volume supporting moves
Bearish Conditions:
Sentiment declining from greed zones
DMI- above DMI+ and rising
Distribution patterns
Multiple resistance failures
⚙️ Customization Options
Adjustable Parameters:
DMI Settings: DI lengths, ADX smoothing
KDJ Periods: Customizable sensitivity
BB% Range: Statistical band adjustments
Smoothing Options: Demand/Supply filtering
Alert Thresholds: Custom signal levels
Visual Customization:
Color schemes for different market states
Line thickness and style preferences
Information panel display options
Alert sound/visual preferences
📊 Signal Interpretation
Primary Signals:
Green 'B': Strong buy opportunity
Red 'S': Strong sell opportunity
White 'Scalp': Short-term trade
Trade Area: Accumulation/distribution zones
Visual Markers:
🔥: Bullish momentum building
🐻: Bear exhaustion building
🐳: Whale/institutional activity
Color-coded fills: Market state visualization
Confidence Levels:
≥80%: High reliability setups
60-79%: Moderate confidence
<60%: Low confidence, avoid or reduce size
⚠️ Risk Management Guidelines
Critical Rules:
Never trade against extreme sentiment (Extreme Fear → buy, Extreme Greed → sell)
Require multiple confirmation signals
Use confidence scores for position sizing
Avoid When:
Conflicting signals between components
Low volume participation
Confidence score < 50%
Major news events pending
Extreme volatility conditions
💡 Advanced Strategies
Sentiment Cycle Trading
Identify sentiment extremes
Wait for confirmation reversals
Enter with trend confirmation
Exit at opposite sentiment extreme
Use confidence scores and fear & greed scores to scale:
Fear & greed scores < 30 = buy area
Fear & greed score > 60 = sell area
Trend Momentum
Exit: At extreme greed with divergence
Enter: At extreme fear with divergence
📊 Market State Classification
Five Primary States:
EXTREME FEAR (BB% <0, RSI <34, Score <34)
FEAR (Score 34-47, bearish momentum)
NEUTRAL (Score 47-70, consolidation)
GREED (Score 70-90, bullish momentum)
EXTREME GREED (Score >90, BB% >100)
State Transitions:
Fear → Neutral: Early accumulation
Neutral → Greed: Trend development
Greed → Extreme Greed: Distribution
Extreme → Reversal: Trend change
🔍 Information Panel Guide
Real-Time Metrics:
FEAR & GREED: Current sentiment score
Market State: Classification and bias
Trend Bias: Bullish/Bearish/Neutral
Confidence: Setup reliability percentage
Momentum: Current directional strength
Volatility: Market condition assessment
Signal Quality: Trade recommendation
Reversal Imminent: Early warning alerts
🌟 Unique Advantages
Psychological Edge:
Quantifies market emotion through multiple indicators
Identifies bubbles before they pop
Provides statistical confidence for each setup
Combines technical extremes with sentiment analysis
Offers clear visual cues for decision making
Professional Features:
Multi-timeframe sentiment analysis
Real-time confidence scoring
Comprehensive alert system
Institutional activity detection
Clear risk/reward visualization
📚 Educational Value
This indicator teaches:
Market psychology cycles
Statistical extreme identification
Multi-indicator confirmation
Risk quantification methods
Professional trade management
Perfect for traders seeking to understand and profit from market sentiment cycles.
Disclaimer: For educational purposes. Trading involves risk. Past performance doesn't guarantee future results.

Linear Regression Market State IndexStandard Deviation Market Structure Indicator
A Comprehensive Multi-Timeframe Market Analysis Tool
🎯 Overview
The Standard Deviation Market Structure (SDMS) indicator is a sophisticated technical analysis tool that integrates multiple proven methodologies to identify market structure, trend direction, and potential reversal zones. By combining price action, statistical analysis, and momentum indicators across multiple timeframes, SDMS provides traders with a comprehensive view of market dynamics.
✨ Key Features
Multi-Timeframe Integration
Primary analysis on current timeframe
1-hour statistical confirmation for support/resistance levels
Order block extension across 500 future bars
Comprehensive Technical Suite
RSI with Deviation Analysis
Dynamic Order Block Detection
Gaussian Filter Channels
Linear Regression with Statistical Bands
Standard deviation to detect price outliers
Directional Movement Index (DMI/ADX)
Bollinger Band % Analysis
Support/Resistance Line System
Visual Clarity
Color-coded signals and zones
Automatic level management
Clean, intuitive display
📊 Core Components Explained
1. Order Block System
What Are Order Blocks?
Order blocks are price zones where institutional activity has occurred, creating future support or resistance levels. SDMS automatically detects these critical zones.
Detection Logic:
Bullish Order Blocks: Form when price breaks above recent highs following bearish candles
Bearish Order Blocks: Form when price breaks below recent lows following bullish candles
Visual Identification:
Green boxes with "BuOB" labels (support zones)
Red boxes with "BeOB" labels (resistance zones)
Each block shows its boundary price for easy reference
Dynamic Management:
Automatically extends 300 bars into the future
Self-cleaning: removes blocks when price breaches their boundaries
Real-time adjustment to changing market structure
2. Statistical Support/Resistance System
How It Works:
SDMS creates support and resistance lines based on statistical extremes confirmed on the 1-hour timeframe.
Trigger Conditions:
Support Lines (Green): Trigger when 1H Bollinger Band % crosses above 0 and bearish momentum subsides.
Resistance Lines (Red): Trigger when 1H Bollinger Band % crosses below 1 and bullish momentum subsides
The Science Behind BB%:
BB% = (Price - Lower Band) / (Upper Band - Lower Band)
BB% <= 0: Price at statistical oversold extreme; also indicated by white candles.
BB% > 1: Price at statistical overbought extreme; also indicated by white candles.
Line Management:
Maximum of 15 active lines
Oldest lines automatically removed
Lines extend across chart for ongoing reference
3. Trend Analysis Suite
Hull Moving Average (HMA):
55-period smoothed trend indicator
Color-coded: Green = bullish, Red = bearish
Visual band shows trend acceleration/deceleration
Gaussian Channel:
Advanced filtering of market noise
Dynamic channel based on true range volatility
Helps identify mean reversion opportunities
Form a yellow band when price is overbought or oversold zones.
Linear Regression System:
Statistical price modeling
Multiple standard deviation bands (up to 3SD)
Regression-based candlestick visualization
Candles turn white when in overbought zones. Yellow candles indicate extremely overbought zones. Blue candles indicate a bullish trend with high volume.
Bearish candles are bluish-purple when volume is high and red when the volume is within normal ranges or low.
4. Momentum & Oscillator Integration
RSI with Deviation Tracking:
21-period RSI with 30-period smoothing
Tracks deviation from moving average based off linear regression
Identifies momentum divergences
Directional Movement Index:
Multi-period DMI/ADX analysis
Used to detect overbought and oversold zones within the indicator calculations.
Combines with RSI for enhanced signals
Momentum confirmation for all entries/exits
🎯 Trading Signals & Alerts
Buy Signals (Yellow "Buy" Labels)
Multi-Condition Confirmation Required:
RSI Oversold Reversal: RSI crosses above 30
Trend Alignment: HMA showing bullish structure
Momentum Confirmation: DMI alignment
Statistical Support: Price at or near support zones
Risk Management: Multiple confirming indicators
Strong Buy Conditions:
Confluence of order block support + BB% support line
Multiple timeframe alignment
Volume confirmation at key levels
Sell Signals (Red/Yellow "Sell" Labels)
Multi-Condition Confirmation Required:
RSI Overbought Reversal: RSI crosses below 70
Trend Exhaustion: HMA showing bearish structure
Momentum Divergence: DMI bearish alignment
Statistical Resistance: Price at or near resistance zones
Timeframe Confirmation: 1H BB% bearish signals
Strong Sell Conditions:
Confluence of order block resistance + BB% resistance line
Multiple timeframe distribution
Volume surge at resistance
Additional Alerts
RSI Divergence Signals: Triangles showing momentum shifts
Extreme Price Alerts: Circles at statistical extremes
Structure Breaks: Visual cues for order block violations
🎨 Visual System Guide
Color Coding System
Green: Bullish conditions, support zones, rising trends
Red: Bearish conditions, resistance zones, falling trends
Blue: Statistical channels, neutral zones
Yellow: Alert conditions, extreme signals
White: Transition zones, neutral signals
Zone Identification
Buying Pressure Zones: Green/blue tinted areas below price or white candles with white dots within the moving average center line
Selling Pressure Zones: Red tinted areas above price with white dots within the moving average center line
Standard Deviation Zones: Gradient colors showing statistical extremes
⚙️ Customization Options
Adjustable Parameters
RSI Settings: Period, oversold/overbought levels, sensitivity
Order Block Detection: Lookback period, ATR multiplier, extension
Statistical Settings: Gaussian filter poles, regression periods
Support/Resistance: Maximum lines, BB% settings
Visual Preferences: Colors, band displays, alert styles
Input Groups
RSI Trading Strategy
Order Block Configuration
Gaussian Channel Settings
Linear Regression Parameters
DMI/ADX Configuration
Bollinger Band % Settings
📈 Practical Trading Applications
For Swing Traders
Identify Key Levels: Use order blocks + BB% lines for entry/exit planning
Trend Confirmation: HMA + Gaussian channel for trend direction
Risk Management: Standard deviation bands for stop placement
Timing Entries: RSI/DMI alignment for optimal entry timing
For Day Traders
Intraday Levels: Order blocks provide immediate S/R for day trading
Momentum Signals: Real-time RSI/DMI signals for quick moves
Statistical Edges: Gaussian channel for mean reversion plays
Breakout Confirmation: Order block breaks with volume
For Position Traders
Higher Timeframe Structure: 1H BB% lines for major levels
Trend Persistence: HMA for long-term trend identification
Accumulation/Distribution Zones: Order blocks show institutional activity
Multi-Timeframe Alignment: Confirmation across timeframes
🔍 How to Use SDMS Effectively
Step 1: Market Structure Assessment
Identify active order blocks (green/red boxes)
Note BB% support/resistance lines (horizontal lines)
Assess HMA and moving average trend direction (color)
Check Gaussian channel position (preferably outside 2SD)
Step 2: Signal Confirmation
Wait for multiple indicator alignment
look for doji candles.
Confirm with green (bullish) or red (bearish) candles
Confirm with volume if available
Check for confluence of levels
Assess risk/reward based on nearby levels
Step 3: Trade Management
Enter at confirmed support/resistance
Place stops beyond opposite levels
Take profits at next statistical level
Monitor for structure changes
Step 4: Risk Management
Use standard deviation bands for volatility assessment
Never risk more than 1-2% per trade
Adjust position size based on confluence strength
Have predefined exit rules
💡 Advanced Strategies
Strategy 1: Confluence Trading
Setup: Order block + BB% line at same level
Entry: Price tests confluence zone with RSI signal
Stop: Beyond the confluence zone
Target: Next statistical level
Strategy 2: Breakout Trading
Setup: Price approaching order block boundary
Entry: Break with volume + RSI/DMI confirmation
Stop: Re-entry into order block
Target: Next BB% line extension
Strategy 3: Mean Reversion
Setup: Price at Gaussian channel extremes
Entry: RSI reversal signal at channel boundary
Stop: Beyond channel extreme
Target: Channel midline or opposite boundary
⚠️ Important Considerations
Best Market Conditions
Trending Markets: Excellent performance in clear trends
Breakout Scenarios: Strong identification of break levels
Range Markets: Works well with defined ranges
Limitations
Choppy Markets: May give false signals in consolidation
News Events: Fundamental shocks can override technical levels
Timeframe Specific: Optimal on 15-minute to daily charts
Risk Management Rules
Always use stops
Never rely on single signals
Consider market context
Adjust for volatility changes
Keep position sizes consistent
🔧 Technical Specifications
Maximum Lines: 500
Maximum Bars Back: 1000
Maximum Boxes: 500
Calculation Efficiency: Optimized for real-time use
🏆 Why SDMS Stands Out
Unique Advantages
Integrated Approach: Combines multiple methodologies into one tool
Self-Adjusting: Automatically adapts to market changes
Multi-Timeframe: Provides both immediate and higher timeframe context
Visual Clarity: Clean, intuitive display of complex data
Professional Grade: Institutional-level analysis accessible to all traders
Educational Value: Learn how different indicators interact
Understand market structure development
See institutional order flow patterns
Develop disciplined trading habits
📚 Learning Resources
Recommended Study Approach
Start Simple: Focus on order blocks and BB% lines first
Add Complexity: Gradually incorporate other indicators
Paper Trade: Practice without risk
Keep Journal: Document setups and outcomes
Review Regularly: Analyze both wins and losses
Common Pitfalls to Avoid
Overtrading: Wait for high-quality setups
Ignoring Context: Consider overall market conditions
Chasing Signals: Enter at planned levels, not after moves
Risk Mismanagement: Always know your risk before entering
Confirmation Bias: Be objective about signals
🤝 Community & Support
Getting the Most from SDMS
Start with Defaults: Use default settings initially
Adjust Gradually: Make small changes as you understand the tool
Combine with Fundamentals: Use for timing within fundamental context
Stay Disciplined: Follow your trading plan consistently
Continuous Improvement
SDMS is designed for continuous learning. As you use the indicator, you'll develop insights into:
Market microstructure
Institutional trading patterns
Statistical edge identification
Risk management optimization
Risk management is more important than signal accuracy
Patience is required for high-quality setups
Success Factors
Discipline: Following your plan consistently
Patience: Waiting for proper setups
Risk Management: Protecting your capital
Continuous Learning: Improving your skills over time
🌟 Final Thoughts
The Standard Deviation Market Structure indicator represents a sophisticated approach to technical analysis, combining the best elements of price action, statistical analysis, and momentum indicators. While powerful, remember that no indicator guarantees success. SDMS is a tool – your skill, discipline, and risk management determine your trading results.
Use SDMS as part of a comprehensive trading plan, combine it with proper risk management, and continue developing your trading skills. The markets are always teaching – stay humble, stay disciplined, and trade well.
Disclaimer: This indicator is for educational purposes only. Past performance does not guarantee future results. Trading involves risk of loss. Always consult with a qualified financial professional before making investment decisions.

EDUVEST Lorentzian ClassificationEDUVEST Lorentzian Classification - Machine Learning Signal Detection
━━━━━━━━━━━━━━━━━━━━━━━━━━━━━━━━━━━━━━━━━━━━━━━━
█ ORIGINALITY
This indicator enhances the original Lorentzian Classification concept by jdehorty with EduVest's visual modifications and alert system integration. The core innovation is using Lorentzian distance instead of Euclidean distance for k-NN classification, providing more robust pattern recognition in financial markets.
━━━━━━━━━━━━━━━━━━━━━━━━━━━━━━━━━━━━━━━━━━━━━━━━
█ WHAT IT DOES
- Generates BUY/SELL signals using machine learning classification
- Displays kernel regression estimate for trend visualization
- Shows prediction values on each bar
- Provides trade statistics (Win Rate, W/L Ratio)
- Includes multiple filter options (Volatility, Regime, ADX, EMA, SMA)
━━━━━━━━━━━━━━━━━━━━━━━━━━━━━━━━━━━━━━━━━━━━━━━━
█ HOW IT WORKS
【Lorentzian Distance Calculation】
Unlike Euclidean distance, Lorentzian distance uses logarithmic transformation:
d = Σ log(1 + |xi - yi|)
This provides:
- Better handling of outliers
- More stable distance measurements
- Reduced sensitivity to extreme values
【Feature Engineering】
The classifier uses up to 5 configurable features:
- RSI (Relative Strength Index)
- WT (WaveTrend)
- CCI (Commodity Channel Index)
- ADX (Average Directional Index)
Each feature is normalized using the n_rsi, n_wt, n_cci, or n_adx functions.
【k-Nearest Neighbors Classification】
1. Calculate Lorentzian distance between current bar and historical bars
2. Find k nearest neighbors (default: 8)
3. Sum predictions from neighbors
4. Generate signal based on prediction sum (>0 = Long, <0 = Short)
【Kernel Regression】
Uses Rational Quadratic kernel for smooth trend estimation:
- Lookback Window: 8
- Relative Weighting: 8
- Regression Level: 25
【Filters】
- Volatility Filter: Filters signals during extreme volatility
- Regime Filter: Identifies market regime using threshold
- ADX Filter: Confirms trend strength
- EMA/SMA Filter: Trend direction confirmation
━━━━━━━━━━━━━━━━━━━━━━━━━━━━━━━━━━━━━━━━━━━━━━━━
█ HOW TO USE
【Recommended Settings】
- Timeframe: 15M, 1H, 4H, Daily
- Neighbors Count: 8 (default)
- Feature Count: 5 for comprehensive analysis
【Signal Interpretation】
- Green BUY label: Long entry signal
- Red SELL label: Short entry signal
- Bar colors: Green (bullish) / Red (bearish) prediction strength
【Trade Statistics Panel】
- Winrate: Historical win percentage
- Trades: Total (Wins|Losses)
- WL Ratio: Win/Loss ratio
- Early Signal Flips: Premature signal changes
【Filter Recommendations】
- Enable Volatility Filter for ranging markets
- Enable Regime Filter for trend confirmation
- Use EMA Filter (200) for higher timeframes
━━━━━━━━━━━━━━━━━━━━━━━━━━━━━━━━━━━━━━━━━━━━━━━━
█ CREDITS
Original Lorentzian Classification concept and MLExtensions library by jdehorty.
Enhanced with visual modifications and alert integration by EduVest.
License: Mozilla Public License 2.0

WoAlgo Premium v3.0
WoAlgo Premium v3.0 - Smart Money Analysis
Overview
** WoAlgo Premium v3.0 ** is an advanced technical analysis indicator designed for educational purposes. This tool combines Smart Money Concepts with multi-factor confluence analysis to help traders identify potential market opportunities across multiple timeframes.
The indicator integrates market structure analysis, order flow concepts, and technical momentum indicators into a comprehensive dashboard system. It is designed to assist traders in understanding institutional trading patterns and market dynamics through visual analysis tools.
### What It Does
This indicator provides:
**1. Smart Money Concepts Analysis**
- Market structure identification (Break of Structure and Change of Character patterns)
- Order block detection with volume confirmation
- Fair value gap recognition
- Liquidity zone mapping (equal highs and lows)
- Premium and discount zone calculations
**2. Multi-Factor Confluence Scoring**
The indicator calculates a proprietary confluence score (0-100) based on five key components:
- Price action analysis (30% weight)
- Volume confirmation (20% weight)
- Momentum indicators (25% weight)
- Trend strength measurement (15% weight)
- Money flow analysis (10% weight)
**3. Multi-Timeframe Analysis**
- Scans 5 different timeframes (5M, 15M, 1H, 4H, Daily)
- Calculates alignment percentage across timeframes
- Displays trend and structure status for each period
**4. Visual Dashboard System**
- Comprehensive main dashboard with 13 metrics
- Real-time screener table with 10 data columns
- Multi-timeframe scanner
- Performance tracking panel
### How It Works
**Market Structure Detection**
The indicator identifies key structural changes in price action:
- **BOS (Break of Structure)**: Indicates trend continuation when price breaks previous swing points
- **CHoCH (Change of Character)**: Signals potential trend reversal when market structure shifts
**Order Block Identification**
Order blocks are detected when:
- Significant volume appears at swing points
- Price shows strong directional movement from these levels
- Enhanced detection with extreme volume confirmation (OB++ markers)
**Fair Value Gap Recognition**
Gaps between candles are identified when:
- Price leaves inefficiencies in the market
- Three consecutive candles create a gap pattern
- Gap size exceeds minimum threshold based on ATR
**Confluence Calculation**
The system evaluates multiple technical factors:
1. **Price Position**: Relative to moving averages (EMA 20, 50, 200)
2. **Volume Analysis**: Standard deviation-based volume spikes
3. **Momentum**: RSI, MACD, Stochastic indicators
4. **Trend Strength**: ADX measurements
5. **Money Flow**: MFI indicator readings
Each factor contributes weighted points to create an overall confluence score that helps assess signal strength.
### Signal Types
**Confirmation Signals (▲ / ▼)**
Generated when:
- EMA crossovers occur (20/50 cross)
- Volume confirmation is present
- RSI is in appropriate zone
- Confluence score exceeds 50%
**Strong Signals (▲+ / ▼+)**
Higher-confidence signals requiring:
- Confluence score above 70%
- Extreme volume confirmation
- Alignment with 200 EMA trend
- MACD confirmation
- Bullish or bearish market structure
**Contrarian Signals (⚡)**
Reversal indicators appearing when:
- RSI reaches extreme levels (<30 or >70)
- Stochastic shows oversold/overbought conditions
- Price touches Bollinger Band extremes
- Potential divergence patterns emerge
**Reversal Zones**
Visual boxes highlighting areas where:
- Market structure conflicts with momentum
- High probability of directional change
- Key support/resistance levels interact
**Smart Trail**
Dynamic stop-loss indicator that:
- Adjusts based on ATR (Average True Range)
- Follows trend direction
- Updates automatically as price moves
- Provides risk management reference points
### Dashboard Components
**Main Dashboard (13 Metrics)**
1. **Confluence Score**: Current bull/bear percentage (0-100)
2. **Market Regime**: Trend classification (Strong Up/Down, Range, Squeeze)
3. **Signal Status**: Active buy/sell signal indication
4. **Structure State**: Current market structure (Bullish/Bearish/Neutral)
5. **Trend Strength**: ADX-based measurement
6. **RSI Level**: Momentum indicator with overbought/oversold zones
7. **MACD Direction**: Trend momentum confirmation
8. **Money Flow Index**: Smart money sentiment
9. **Volume Status**: Current volume relative to average
10. **Volatility Rating**: ATR percentage measurement
11. **ATR Value**: Average true range for position sizing
12. **MTF Alignment**: Multi-timeframe agreement percentage
**Screener Table (10 Columns)**
- Current symbol and timeframe
- Real-time price and percentage change
- Quality rating (star system)
- Active signal type
- Smart trail status
- Market structure state
- MACD direction
- Trend strength percentage
- Bollinger Band squeeze detection
**MTF Scanner (5 Timeframes)**
Displays for each timeframe:
- Trend direction indicator
- Market structure classification
- Visual confirmation with color coding
**Performance Metrics**
- Win rate percentage (simplified calculation)
- Total signals generated
- Current confluence score
- MTF alignment status
- Volatility level
### Settings and Customization
**Preset Styles**
Choose from predefined configurations:
- **Conservative**: Fewer, higher-quality signals
- **Moderate**: Balanced approach (recommended)
- **Aggressive**: More frequent signals
- **Scalper**: Short-term focused
- **Swing**: Longer-term oriented
- **Custom**: Full manual control
**Smart Money Concepts Controls**
- Toggle each feature independently
- Adjust swing length (3-50 periods)
- Enable/disable internal structure
- Control order block display
- Manage breaker block visibility
- Show/hide fair value gaps
- Display liquidity zones
- Premium/discount zone visualization
**Signal Configuration**
- Enable/disable confirmation signals
- Toggle strong signal markers
- Control contrarian signal display
- Show/hide reversal zones
- Smart trail activation
- Sensitivity adjustment (5-50)
**Visual Customization**
- Moving average display options
- MA period adjustments (Fast: 20, Slow: 50, Trend: 200)
- Support/resistance line toggle
- Dynamic S/R lookback period
- Candle coloring based on trend
- Color scheme customization
- Dashboard size options (Small/Normal/Large)
- Position placement (4 corners)
### How to Use
**Step 1: Initial Setup**
1. Add indicator to chart
2. Select appropriate preset or use Custom
3. Adjust timeframe to match trading style
4. Configure dashboard visibility preferences
**Step 2: Analysis Workflow**
1. Check MTF Scanner for timeframe alignment
2. Review Main Dashboard confluence score
3. Observe Market Regime classification
4. Identify active signals on chart
5. Confirm with Smart Money Concepts (order blocks, FVG, structure)
**Step 3: Trade Consideration**
Strong signals (▲+ / ▼+) require:
- Confluence score >70%
- MTF alignment >60%
- Confirmation from multiple dashboard metrics
- Support from Smart Money Concepts
- Appropriate volume levels
**Step 4: Risk Management**
- Use Smart Trail as dynamic stop-loss reference
- Consider ATR for position sizing
- Monitor volatility rating
- Respect support/resistance levels
- Combine with personal risk parameters
### Best Practices
**For Scalping (1M-5M timeframes)**
- Use Scalper preset
- Reduce swing length to 5-7
- Focus on strong signals only
- Monitor MTF alignment closely
- Quick entries near order blocks
**For Intraday Trading (15M-1H timeframes)**
- Use Moderate preset (recommended)
- Default swing length (10)
- Combine confirmation and strong signals
- Check MTF scanner before entry
- Use fair value gaps for entries
**For Swing Trading (4H-D timeframes)**
- Use Swing preset
- Increase swing length to 15-20
- Focus on strong signals
- Require high MTF alignment
- Patient approach with major structure levels
### Technical Specifications
**Indicators Used**
- Exponential Moving Averages (20, 50, 200)
- Hull Moving Average
- Relative Strength Index (14)
- MACD (12, 26, 9)
- Money Flow Index (14)
- Stochastic Oscillator (14, 3)
- ADX / DMI (14)
- Bollinger Bands (20, 2)
- ATR (14)
- Volume Analysis (SMA 20 with standard deviation)
**Calculation Methods**
- Swing detection using pivot high/low functions
- Volume confirmation via statistical analysis
- Multi-factor scoring with weighted components
- Dynamic support/resistance using highest/lowest functions
- Real-time MTF data via security() function
### Limitations and Considerations
**Important Notes**
1. This indicator is designed for educational and analytical purposes only
2. Historical performance does not guarantee future results
3. Signals should be confirmed with additional analysis
4. Market conditions vary and affect indicator performance
5. Not all signals will be profitable
6. Risk management is essential for all trading
**Known Limitations**
- Confluence scoring is algorithmic and not predictive
- MTF analysis requires sufficient historical data
- Effectiveness varies across different market conditions
- Sideways markets may produce conflicting signals
- High volatility can affect signal reliability
- Backtesting results shown are simplified calculations
**Not Suitable For**
- Automated trading without human oversight
- Sole basis for trading decisions
- Guaranteed profit expectations
- Inexperienced traders without proper education
- Trading without risk management plans
### Market Applicability
**Effective On**
- Trending markets (any direction)
- Clear structure formation periods
- Liquid instruments with consistent volume
- Multiple asset classes (forex, stocks, crypto, commodities)
- Various timeframes with appropriate settings
**Less Effective During**
- Extended ranging/choppy conditions
- Extremely low volume periods
- Major news events causing gaps
- Early market open with high spread
- Illiquid instruments with erratic price action
### Risk Disclaimer
**⚠️ IMPORTANT NOTICE**
This indicator is provided for **educational and informational purposes only**. It does not constitute financial advice, investment recommendations, or trading signals.
**Key Risk Factors:**
- Trading financial instruments involves substantial risk of loss
- Past performance does not indicate future results
- No indicator can predict market movements with certainty
- Users should conduct independent research and analysis
- Professional financial advice should be sought when appropriate
- Risk management and position sizing are critical to successful trading
- Users are solely responsible for their trading decisions
**Responsible Usage:**
- Combine with comprehensive market analysis
- Use appropriate stop-loss orders
- Never risk more than you can afford to lose
- Maintain realistic expectations
- Continue education on technical analysis principles
- Test thoroughly on demo accounts before live trading
- Understand all indicator features before using
### Educational Resources
**Understanding Smart Money Concepts**
Smart Money Concepts analyze how institutional traders and large market participants operate. Key principles include:
- Institutional order flow patterns
- Market structure changes
- Liquidity manipulation
- Supply and demand imbalances
- Order block formations
**Multi-Timeframe Analysis Theory**
Analyzing multiple timeframes helps:
- Identify overall market direction
- Improve entry timing
- Confirm trend strength
- Recognize consolidation periods
- Reduce conflicting signals
**Confluence Trading Approach**
Using multiple confirming factors:
- Increases signal reliability
- Reduces false signals
- Provides conviction for trades
- Helps with position sizing
- Improves risk-reward ratios
### Version History
**v3.0 (Current)**
- Multi-factor confluence scoring system
- Complete Smart Money Concepts implementation
- Real-time multi-timeframe analysis
- Four professional dashboard panels
- Enhanced order block detection
- Breaker block identification
- Premium/discount zone calculations
- Smart trail stop-loss system
- Customizable preset configurations
- Performance tracking metrics
**Development Philosophy**
This indicator was developed with focus on:
- Educational value for traders
- Transparent methodology
- Comprehensive feature set
- User-friendly interface
- Flexible customization options
### Technical Support
**For Questions About:**
- Indicator functionality
- Parameter optimization
- Signal interpretation
- Dashboard metrics
- Best practice recommendations
Please use TradingView's comment section below. The developer monitors comments and provides assistance to users learning to use the indicator effectively.
### Acknowledgments
This indicator implements concepts from:
- Smart Money Concepts trading methodology
- Multi-timeframe analysis techniques
- Technical indicator theory
- Market structure analysis principles
- Institutional order flow concepts
All implementations are original code and calculations based on established technical analysis principles.
---
## ADDITIONAL INFORMATION SECTION
**Category**: Indicators
**Type**: Market Structure / Multi-Timeframe Analysis
**Complexity**: Intermediate to Advanced
**Open Source**: Code visible for transparency and education
**Pine Script Version**: v6
**Chart Overlay**: Yes
**Maximum Objects**: 500 boxes, 500 lines, 500 labels

varenleongv1🔑 Core Features
1️⃣ Higher Timeframe Trend Bias
The indicator uses a higher-timeframe EMA to define the overall market direction.
This helps filter out lower-timeframe noise and keeps trades aligned with the bigger picture.
2️⃣ Local Trend Confirmation
Two EMAs (Fast & Mid) with slope analysis confirm short-term momentum.
Trades are only considered when price structure and momentum agree with the higher-timeframe bias.
3️⃣ Market Structure Detection
The indicator automatically identifies:
Higher Highs & Higher Lows (uptrend)
Lower Highs & Lower Lows (downtrend)
This structure-based logic avoids lag and provides realistic trend confirmation instead of reacting to every candle.
4️⃣ Automatic Trendline Drawing
Confirmed swing highs and lows are used to draw:
Rising support lines in uptrends
Falling resistance lines in downtrends
Trendlines are based on confirmed pivots, meaning they do not repaint once formed.
5️⃣ ADX Chop Filter (Optional)
An optional ADX filter helps identify sideways or low-momentum markets.
When ADX is below the chosen threshold, the indicator will classify conditions as chop / no-trend, helping prevent forced trades.
6️⃣ Clear Visual Feedback
Background color highlights the current market state:
Green = Uptrend
Red = Downtrend
Grey = No Trend / Chop
EMAs and trendlines are plotted directly on price for clarity.

MLExtensionsLibrary "MLExtensions"
A set of extension methods for a novel implementation of a Approximate Nearest Neighbors (ANN) algorithm in Lorentzian space.
normalizeDeriv(src, quadraticMeanLength)
Returns the smoothed hyperbolic tangent of the input series.
Parameters:
src (float) : The input series (i.e., the first-order derivative for price).
quadraticMeanLength (int) : The length of the quadratic mean (RMS).
Returns: nDeriv The normalized derivative of the input series.
normalize(src, min, max)
Rescales a source value with an unbounded range to a target range.
Parameters:
src (float) : The input series
min (float) : The minimum value of the unbounded range
max (float) : The maximum value of the unbounded range
Returns: The normalized series
rescale(src, oldMin, oldMax, newMin, newMax)
Rescales a source value with a bounded range to anther bounded range
Parameters:
src (float) : The input series
oldMin (float) : The minimum value of the range to rescale from
oldMax (float) : The maximum value of the range to rescale from
newMin (float) : The minimum value of the range to rescale to
newMax (float) : The maximum value of the range to rescale to
Returns: The rescaled series
getColorShades(color)
Creates an array of colors with varying shades of the input color
Parameters:
color (color) : The color to create shades of
Returns: An array of colors with varying shades of the input color
getPredictionColor(prediction, neighborsCount, shadesArr)
Determines the color shade based on prediction percentile
Parameters:
prediction (float) : Value of the prediction
neighborsCount (int) : The number of neighbors used in a nearest neighbors classification
shadesArr (array) : An array of colors with varying shades of the input color
Returns: shade Color shade based on prediction percentile
color_green(prediction)
Assigns varying shades of the color green based on the KNN classification
Parameters:
prediction (float) : Value (int|float) of the prediction
Returns: color
color_red(prediction)
Assigns varying shades of the color red based on the KNN classification
Parameters:
prediction (float) : Value of the prediction
Returns: color
tanh(src)
Returns the the hyperbolic tangent of the input series. The sigmoid-like hyperbolic tangent function is used to compress the input to a value between -1 and 1.
Parameters:
src (float) : The input series (i.e., the normalized derivative).
Returns: tanh The hyperbolic tangent of the input series.
dualPoleFilter(src, lookback)
Returns the smoothed hyperbolic tangent of the input series.
Parameters:
src (float) : The input series (i.e., the hyperbolic tangent).
lookback (int) : The lookback window for the smoothing.
Returns: filter The smoothed hyperbolic tangent of the input series.
tanhTransform(src, smoothingFrequency, quadraticMeanLength)
Returns the tanh transform of the input series.
Parameters:
src (float) : The input series (i.e., the result of the tanh calculation).
smoothingFrequency (int)
quadraticMeanLength (int)
Returns: signal The smoothed hyperbolic tangent transform of the input series.
n_rsi(src, n1, n2)
Returns the normalized RSI ideal for use in ML algorithms.
Parameters:
src (float) : The input series (i.e., the result of the RSI calculation).
n1 (simple int) : The length of the RSI.
n2 (simple int) : The smoothing length of the RSI.
Returns: signal The normalized RSI.
n_cci(src, n1, n2)
Returns the normalized CCI ideal for use in ML algorithms.
Parameters:
src (float) : The input series (i.e., the result of the CCI calculation).
n1 (simple int) : The length of the CCI.
n2 (simple int) : The smoothing length of the CCI.
Returns: signal The normalized CCI.
n_wt(src, n1, n2)
Returns the normalized WaveTrend Classic series ideal for use in ML algorithms.
Parameters:
src (float) : The input series (i.e., the result of the WaveTrend Classic calculation).
n1 (simple int)
n2 (simple int)
Returns: signal The normalized WaveTrend Classic series.
n_adx(highSrc, lowSrc, closeSrc, n1)
Returns the normalized ADX ideal for use in ML algorithms.
Parameters:
highSrc (float) : The input series for the high price.
lowSrc (float) : The input series for the low price.
closeSrc (float) : The input series for the close price.
n1 (simple int) : The length of the ADX.
regime_filter(src, threshold, useRegimeFilter)
Parameters:
src (float)
threshold (float)
useRegimeFilter (bool)
filter_adx(src, length, adxThreshold, useAdxFilter)
filter_adx
Parameters:
src (float) : The source series.
length (simple int) : The length of the ADX.
adxThreshold (int) : The ADX threshold.
useAdxFilter (bool) : Whether to use the ADX filter.
Returns: The ADX.
filter_volatility(minLength, maxLength, useVolatilityFilter)
filter_volatility
Parameters:
minLength (simple int) : The minimum length of the ATR.
maxLength (simple int) : The maximum length of the ATR.
useVolatilityFilter (bool) : Whether to use the volatility filter.
Returns: Boolean indicating whether or not to let the signal pass through the filter.
backtest(high, low, open, startLongTrade, endLongTrade, startShortTrade, endShortTrade, isEarlySignalFlip, maxBarsBackIndex, thisBarIndex, src, useWorstCase)
Performs a basic backtest using the specified parameters and conditions.
Parameters:
high (float) : The input series for the high price.
low (float) : The input series for the low price.
open (float) : The input series for the open price.
startLongTrade (bool) : The series of conditions that indicate the start of a long trade.
endLongTrade (bool) : The series of conditions that indicate the end of a long trade.
startShortTrade (bool) : The series of conditions that indicate the start of a short trade.
endShortTrade (bool) : The series of conditions that indicate the end of a short trade.
isEarlySignalFlip (bool) : Whether or not the signal flip is early.
maxBarsBackIndex (int) : The maximum number of bars to go back in the backtest.
thisBarIndex (int) : The current bar index.
src (float) : The source series.
useWorstCase (bool) : Whether to use the worst case scenario for the backtest.
Returns: A tuple containing backtest values
init_table()
init_table()
Returns: tbl The backtest results.
update_table(tbl, tradeStatsHeader, totalTrades, totalWins, totalLosses, winLossRatio, winrate, earlySignalFlips)
update_table(tbl, tradeStats)
Parameters:
tbl (table) : The backtest results table.
tradeStatsHeader (string) : The trade stats header.
totalTrades (float) : The total number of trades.
totalWins (float) : The total number of wins.
totalLosses (float) : The total number of losses.
winLossRatio (float) : The win loss ratio.
winrate (float) : The winrate.
earlySignalFlips (float) : The total number of early signal flips.
Returns: Updated backtest results table.
