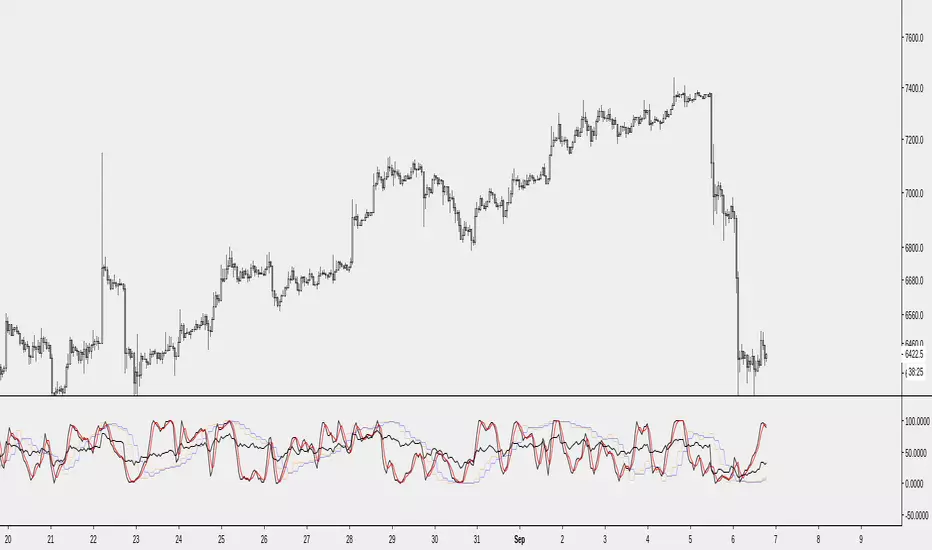
APEX - WaveTrend [v1]WaveTrend is a smoothed oscillator which enables it to detect true reversals in an extremely accurate manner. The beauty of this indicator is that does not generate signals during choppy sideways markets.
The basic settings are 10 / 3 / 4 these are very aggressive settings, that will generate a lot of signals in all even not so volatile markets. If you need high-quality signals you settings close to 10 / 3 /21. The strongest buy/sell signals are given when the cross occurs above or below the threshold. In the 10 / 3 / 4 you threshold for buy should be around -90 values. If you use the very smoothed variant the threshold will be around -45 to -50 values.
This indicator will be first available in APEX v1 currently being beta tested.
Buscar en scripts para "WaveTrend"


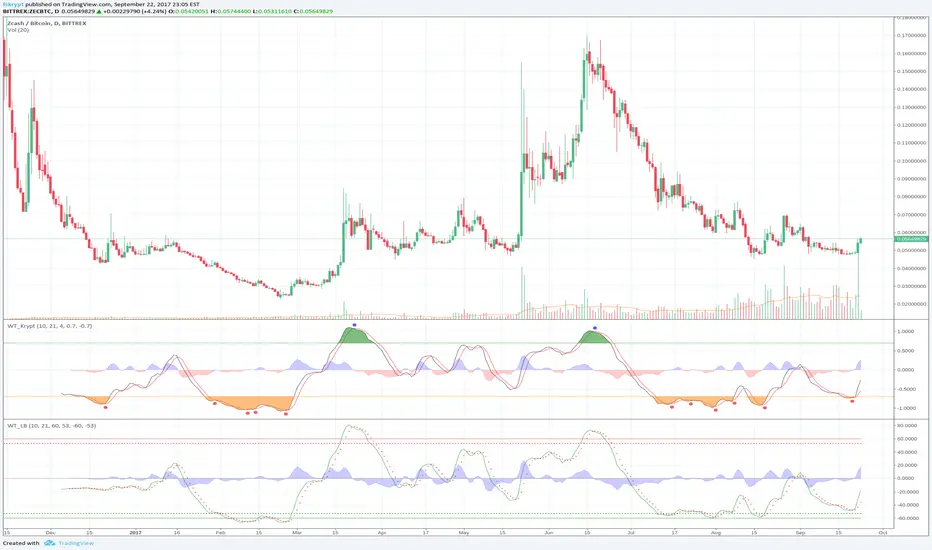
WaveTrend Oscillator [Krypt]This is similar to regular WaveTrend Oscillator except:
- replaces hlc3 input with a weighted log formula for better stability/performance on high volatility charts
- zero-centered scaling
- SMA crossovers above and below OB/OS thresholds are marked as buy/sell signals

Enhanced WaveTrend OscillatorThe Enhanced WaveTrend Oscillator is a modified version of the original WaveTrend. The WaveTrend indicator is a popular technical analysis tool used to identify overbought and oversold conditions in the market and generate trading signals. The enhanced version addresses certain limitations of the original indicator and introduces additional features for improved analysis and comparison across assets.
WaveTrend:
The original WaveTrend indicator calculates two lines based on exponential moving averages and their relationship to the asset's price. The first line measures the distance between the asset's price and its EMA, while the second line smooths the first line over a specific period. The result is divided by 0.015 multiplied by the smoothed difference ('d' for reference). The indicator aims to identify overbought and oversold conditions by analyzing the relationship between the two lines.
In the original formula, the rudimentary estimation factor 0.015 times 'd' fails to accomodate for approximately a quarter of the data, preventing the indicator from reaching the traditional stationary levels of +-100. This limitation renders the indicator quantitatively biased, as it relies on the user's subjective adjustment of the levels. The enhanced version replaces this factor with the standard deviation of the asset's price, resulting in improved estimation accuracy and provides a more dynamic and robust outcome, we thereafter multiply the result by 100 to achieve a more traditional oscillation.
Enhancements and Features:
The enhanced version of the WaveTrend indicator addresses several limitations of the original indicator and introduces additional features-
Dynamic Estimation: The original indicator uses an arbitrary estimation factor, while the enhanced version replaces it with the standard deviation of the asset's price. This modification provides a more dynamic and accurate estimation, adapting to the specific price characteristics of each asset.
Stationary Support and Resistance Levels: The enhanced version provides stationary key support and resistance levels that range from -150 to 150. These levels are determined based on the analysis of the indicator's data and encompass more than 95% of the indicator's values. These levels offer important reference points for traders to identify potential price reversals or significant price movements.
Comparison Across Assets: The enhanced version allows for better comparison and analysis across different assets. By incorporating the standard deviation of the asset's price, the indicator provides a more consistent and comparable interpretation of the market conditions across multiple assets.
Upon closer inspection of the modification in the enhanced version, we can observe that the resulting indicator is a smoothed variation of the Z-Score!
f_ewave(src, chlen, avglen) =>
basis = ta.ema(src, chlen)
dev = ta.stdev(src, chlen)
wave = (src - basis) / dev * 100
ta.ema(wave, avglen)
Z-Score Analysis:
The Z-Score is a statistical measurement that quantifies how far a particular data point deviates from the mean in terms of standard deviations. In the enhanced version, the calculation involves determining the basis (mean) and deviation (standard deviation) of the asset's price to calculate its Z-Score, thereafter applying a smoothing technique to generate the final WaveTrend value.
Utility:
The 𝗘𝗻𝗵𝗮𝗻𝗰𝗲𝗱 𝗪𝗧 indicator offers traders and investors valuable insights into overbought and oversold conditions in the market. By analyzing the indicator's values and referencing the stationary support and resistance levels, traders can identify potential trend reversals, evaluate market strength, and make better informed analysis.
It is important to note that this indicator should be used in conjunction with other technical analysis tools and indicators to confirm trading signals and validate market dynamics.
Credit:
The 𝗘𝗻𝗵𝗮𝗻𝗰𝗲𝗱 𝗪𝗧 indicator is a modification of the original WaveTrend Oscillator developed by @LazyBear on TradingView.
Example Charts:
Squeeze mom MTF filtered by Wavetrend with div (Tilt)📋 Description :
This script is based on two famous indicators from @Lazybear : Squeeze Momentum and WaveTrend. fr.tradingview.com
The idea is to use the Wavetrend crossovers and filter them according to the momentum curve.
There is a multi timeframe module with automatic selection of the higher timeframe. The user can also choose his timeframe manually.
There is also a detection of regular and hidden divergences
🛠 Options :
- filtering the cross wave trend according to the momemtum curve
- active or not higher timeframe with automatic or manually timeframe selection
- display or not WaveTrend ans squeeze momentum
- Show a tape that signals when wavetrend is overbought or oversold
- choose colors and apparences
- display a panel for the higher timeframe value

On-chart Wavetrend Divergence with PivotsThis is an OnChart WaveTrend Divergence Indicator with Pivots and Alerts
LazyBears WaveTrend Indicator or also known as "Market Cipher" is an Indicator that is based on Moving Averages, therefore its an "lagging indicator". Lagging indicators are best used in combination with leading indicators. In this script the "leading indicator" component are Daily, Weekly or Monthly Pivots. These Pivots can be used as dynamic Support and Resistance, Stoploss, Take Profit etc.
This indicator combination is best used in larger timeframes. For lower timeframes you might need to change settings to your liking.
What are those circles?
-These are the WaveTrend Divergences. Red for Regular-Bearish. Orange for Hidden-Bearish. Green for Regular-Bullish. Aqua for Hidden-Bullish.
Please keep in mind that this indicator is a tool and not a strategy, do not blindly trade signals, do your own research first! Use this indicator in conjunction with other indicators to get multiple confirmations.

Moving Average with Dynamic Color Gradient (WaveTrend Momentum)Similar scripts exist but I haven't seen one using WaveTrend and I haven't seen one that hand picks evenly divided colors between GREEN-YELLOW-RED.
The green is exact green, the yellow is exact yellow, and the red is exact red.
Not complicated, just useful.

Hashem WaveTrendHASHEM WAVETREND
This indicator is mixture of 4 types of WaveTrends with proper SMA and EMA Smoothings. When the Blue wave crosses the purple wave and if they are in the Lower or Higher Zones, that could be a setup. Also, Customized Godmode with 2 settings and Divergences on Purple Wave are included.
When an Orange Triangle shows up it means the setup is quite powerful.
This can be used on any timeframes and any markets. Don't forget always Higher TF = More Weight and Don't be greedy in CounterTrends .
Besides, VWAP (the difference between the two waves) is plotted. When the Yellow wave is high and near the Fibo levels, It means the trend is just started OR it's near the end.
This indicator is powerful in Swings , Scalpes and Trends on any timeframe, but when the price is ranging in a very tight range , the signals often would be false. So be careful about tight ranges .
Note That The Signals are NOT Confirmed. You must Confirm them with your own TA.

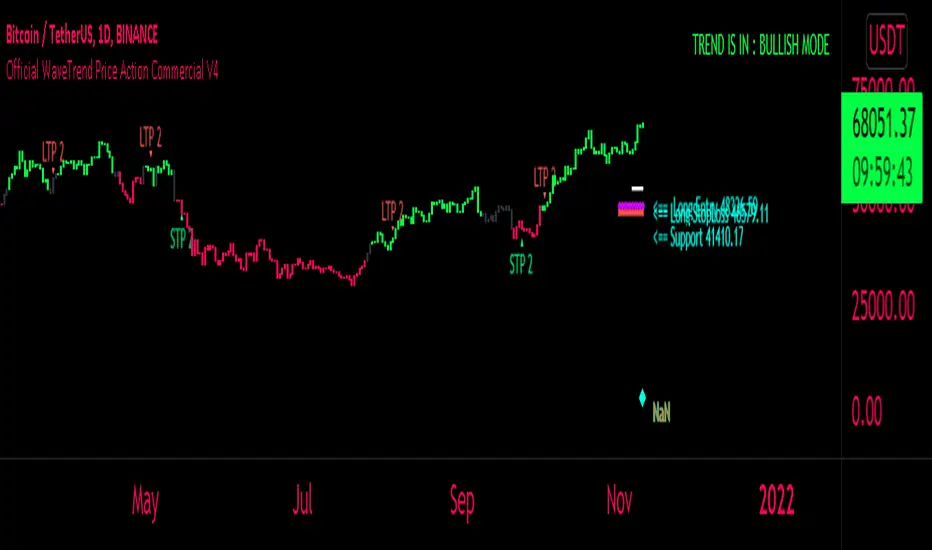
FaizanN Official WaveTrend Price Action Commercial PINEV4Hello Traders,
Here i bring you my first Price Action WaveTrend based Indictor combined with fib entry and exit trailing levels with minimum risk and maximum profit , as we must have seen at times as we enter the trend reverse and hits our stoploss . Keeping that in mind as i too struggled and made losses so i decided and focused more on minimizing the loss and only on confirmation Long or Short trade is been initiated along with Stoploss as explaned in the images below , why should we give market our money ;) as we are here to make money :D .. There is no holy grail as Stop loss wont be hit but yes it will be way less and all alerts are based on candle close ... One can use this on any chart and any timeframe and its very good for scalping too . Better results are on 15m and above . Hope you guys will like it and comment if you have any doubts..
-----------------
Disclaimer
Copyright by FaizanNawazz.
The information contained in my scripts/indicators/strategies/ideas does not constitute financial advice or a solicitation to buy or sell any securities of any type. I will not accept liability for any loss or damage, including without limitation any loss of profit, which may arise directly or indirectly from the use of or reliance on such information.
All investments involve risk, and the past performance of a security, industry, sector, market, financial product, trading strategy, or individual’s trading does not guarantee future results or returns. Investors are fully responsible for any investment decisions they make. Such decisions should be based solely on an evaluation of their financial circumstances, investment objectives, risk tolerance, and liquidity needs.
My scripts/indicators are only for educational purposes!
Happy Trading!
[NMC]RSI MTF, StochasticRSI MTF, BB%, WavetrendThis is our second indicator and is very useful if you want to create a strategy based on multiple indicators and time frames. RSI and Stochastic RSI are multi-timeframe and they are based on ChrisMoody's multi-timeframe scripts.
You can choose from RSI, Stochastic RSI, BB% and Wavetrend. In the near future we my add CCI, CMF, TSI or any similar indicator with the possibility to plot from a higher timeframe.
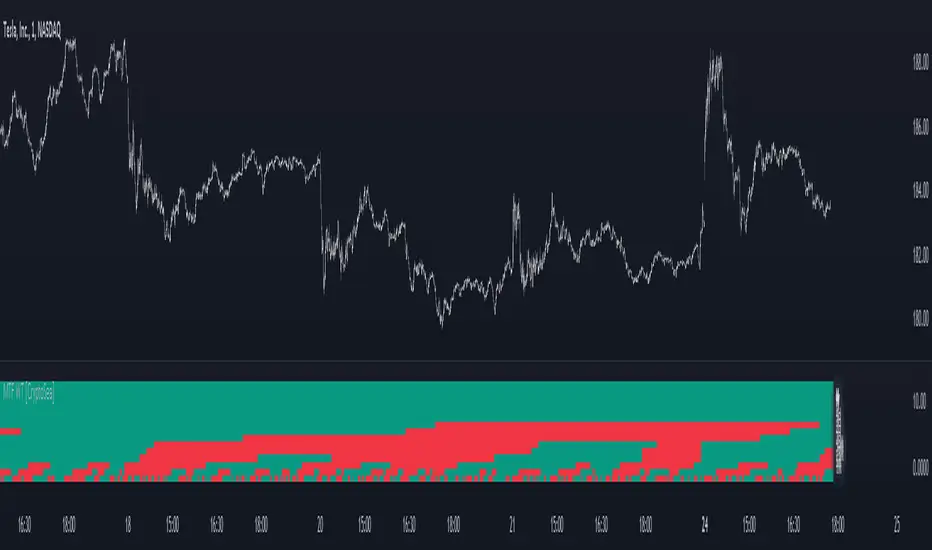
MTF WaveTrend [CryptoSea]The MTF WaveTrend Indicator is a sophisticated tool designed to enhance market analysis through multi-timeframe WaveTrend calculations. This tool is built for traders who seek to identify market momentum and potential reversals with higher accuracy.
In the example below, we can see all the choosen timeframes agree on bearish momentum.
Key Features
Multi-Timeframe WaveTrend Analysis: Tracks WaveTrend values across multiple timeframes to provide a comprehensive view of market momentum.
Customizable Colour Rules: Offers three different colour rules (Traditional, WT1 0 Rule, WT1 & WT2 0 Rule) to suit various trading strategies.
Timeframe Visibility Control: Allows users to enable or disable specific timeframes, providing flexibility in analysis.
Clear Visual Indicators: Uses color-coded squares and labels to clearly display WaveTrend status across different timeframes.
Candle Colouring Option: Includes a setting for neutral candle coloring to enhance chart readability.
This example shows what can happen when all timeframes start alligning with eachother.
How it Works
WaveTrend Calculation: Computes the WaveTrend oscillator by applying a series of exponential moving averages and scaling calculations.
Multi-Timeframe Data Aggregation: Utilizes the `request.security` function to gather and display WaveTrend values from various timeframes without repainting issues.
Conditional Plotting: Displays visual cues only when higher timeframes align with the selected timeframe, ensuring relevant and reliable signals.
Dynamic Colour Rules: Adjusts the indicator colors based on the chosen rule, whether it's a traditional crossover, WT1 crossing zero, or both WT1 & WT2 crossing zero.
Traditional: Colors are determined by the relationship between WT1 and WT2. If WT1 is greater than WT2, it is bullish (bullColour), otherwise bearish (bearColour).
WT1 0 Rule: Colors are based on whether WT1 is above or below zero. WT1 above zero is bullish (bullColour), below zero is bearish (bearColour).
WT1 & WT2 0 Rule: A more complex rule where both WT1 and WT2 need to be above zero for a bullish signal (bullColour) or both below zero for a bearish signal (bearColour). If WT1 and WT2 are not in agreement, a neutral color (neutralColour) is displayed.
This indicator will make sure that the lowest timeframe you can see data from will be the timeframe you are on. This is to avoid false signals as you cannot display 3 x 5 minute candles whilst looking at the 15 minute candle.
Application
Strategic Decision-Making: Assists traders in making informed decisions by providing detailed analysis of WaveTrend movements across different timeframes.
Trend Confirmation: Reinforces trading strategies by confirming potential reversals with multi-timeframe WaveTrend analysis.
Customized Analysis: Adapts to various trading styles with extensive input settings that control the display and sensitivity of WaveTrend data.
The MTF WaveTrend Indicator by is an invaluable addition to a trader's toolkit, offering depth and precision in market trend analysis to navigate complex market conditions effectively.
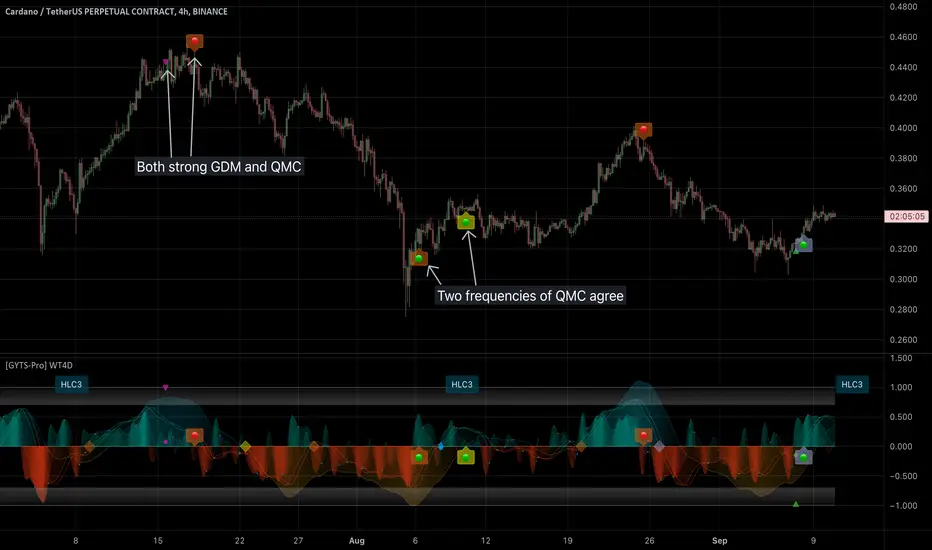
[GYTS-Pro] Signal Provider | WaveTrend 4D with GDM + QMCWaveTrend 4D with GDM + QMC (Professional Edition)
🌸 " 📡 Signal Provider" in GoemonYae Trading System (GYTS) 🌸
WaveTrend 4D (WT4D) is an extension of the incredible WaveTrend 3D (2022, Justin Dehorty) . This oscillator elevates the classic WaveTrend by integrating advanced mathematical models for a multi-dimensional view of market momentum, capturing subtle shifts and trends that traditional indicators might miss. Each oscillator layer uses a combination of normalised derivatives, hyperbolic tangent transformations, and dual-pole filtering (John Ehlers' SuperSmoother), providing a normalised and smooth signals.
WT4D strives to help discriminating high-quality signals from the indicator by introducing the Gradient Divergence Measure (GDM) and Quantile Median Crosses (QMC) -- see below for more information.
WaveTrend 4D is a "📡 Signal Provider" in the 🌸 GoemonYae Trading System (GYTS) 🌸. Multiple 📡 Signal Providers connect to a GYTS "🧬 Flux Composer" to find confluence. On its turn, the Flux Composer can be connected to the GYTS "🎼 Order Orchestrator" for backtesting and trade automation. However, WaveTrend 4D is a wonderful indicator on its own as well.
🌸 --- MAIN FEATURES --- 🌸
- The focus is on two type of signals: divergences between the overall trend and the waves (GDM) and the weakening of strong trends (QMC)
- The name "WaveTrend 4D" is derived from the usage of 4 dimensions, representing different frequencies or timeframes. This gives the opportunity to use 2 sets of 3 frequencies to find divergences. Next to the "fast", "normal" and "slow" frequency, the fourth frequency is called "lethargic" (very slow).
- High probability trading involves diligently determining the significance of signals. For this purpose, a novel "Gradient Divergence Measure" (GDM) is developed to signify the strength of divergence signals and are drawn as triangles next to the divergence circles.
- Another and powerful approach is to use the frequencies' crossing of the median (zero) line. We seek to only signal reversals after a significant trend, and call this the "Quantile Median Crosses" (QMC).
More information the GDM and QMC and details of all features are described below.
🌸 --- GRADIENT DIVERGENCE MEASURE (GDM) --- 🌸
💮 Introduction
--
The GDM dynamically calculates a composite measure based on multiple factors. Unlike traditional binary divergence indicators, GDM employs a continuous value system to capture the nuanced dynamics of market behaviour. This methodology allows traders and analysts to assess the potency of divergence signals with greater precision, facilitating more informed decision-making processes.
💮 Methodology
--
The GDM is calculated using a composite formula that integrates various market dynamics. At its core, it consists of six components listed below, each weighted to optimize the indicator's responsiveness to market conditions:
The magnitude of relative change between waves -- A larger difference between the waves, i.e. lower high or higher low could signify a stronger divergence.
The absolute value of the latest wave -- The strength of the latest wave provides insight into the extremity of the market conditions.
Slope of the divergence -- The slope between the two points of divergence essentially measures the rate of change in the frequency\'s value over time. It captures both the direction and the steepness of the indicator’s move between two waves.
The magnitude of relative change of the price -- A divergence means that the oscillator shows an opposite pattern than price action. Thus, if the price makes a significantly higher high or lower low, but the indicator does not, this discrepancy can be used to measure the divergence strength. This components measures the price's extrema during the crosses of the indicator's waves.
Higher timeframe's frequency trend -- Similarly, instead of looking at the price directly, this component measures the more general trend of the price by using the higher timeframe frequency (i.e. the slow frequency when looking at divergences of the normal frequency).
Time duration -- Lastly, the time duration between the two points of a divergence can also be a factor. A divergence that spans over a longer period might indicate a more significant market sentiment shift.
Note that these 6 components are not independent, e.g. the slope is actually the result of the magnitude between waves, the absolute value and time duration. However, the default GDM is carefully tuned to include all these features without being too sensitive to outliers.
💮 Tuning the GDM
--
At the same time, different people have different ideas of what factors are important to denote a "strong" divergence. For this reason, in the 🧰 Professional Edition of this indicator, as opposed to the 🤲 Community Edition, the user can select between different "GDM profiles" that resemble a certain approach:
Upon initiating the GDM indicator, users are prompted to select one of six distinct profiles. Each profile adjusts the indicator’s parameters to optimize performance under different market scenarios:
balanced : Offers a general approach, with a balanced assessment of market conditions without specific focus on any one aspect.
regular divergence : Emphasises price action, ideal for identifying classical divergence patterns where price and momentum diverge.
wavetrend focus : Minimises the influence of price action, concentrating on the WaveTrend oscillator’s behaviour for trend analysis.
short-term waves : Prioritises the slope of the waves, targeting traders interested in short-term market movements and potential inflection points.
long-term waves : Extends the analysis period, focusing on longer-term market trends and wave duration for strategic positioning.
overbought/oversold : Highlights extreme conditions in market valuation, useful for identifying potential reversal points from overbought or oversold levels.
The 🎩 Ultimate Edition takes it a step further and gives full freedom to dial in weights for each of the 6 components. The GDM formula is set up in such way to accommodate ease of use and react logically to these parameters. Having said that, the default GDM calculation should be more than sufficient for most cases.
Another way of tuning the GDM is to dial in the "sensitivity". This controls the extent of normalisation between signals, and essentially affects how often strong GDMs appear. At the conservative end (higher sensitivity), the strong GDMs are less frequent but are relatively significant, while with a lower sensitivity the strong GDMs appear more frequent.
💮 GDM on the Oscillator
--
Coming back to the indicator, the GDMs are represented by triangles and their value represents the strength. A value close to `1` signifies a strong bearish divergence and thus a possible reversal of continuation of a downtrend. Similarly, a value close to `-1` signifies a strong bullish divergence.
Note that there are two colour sets which can be enabled and disabled. One uses crosses between the fast and normal frequencies (with the slow frequency acting as the price trend with which there should be an opposite interaction -- "divergence"). Similarly, crosses between the normal and slow frequencies (with the lethargic (the most slow) frequency acting as the price trend) are used to find divergences on a higher timeframe.
🌸 --- QUANTILE MEDIAN CROSSES (QMC) --- 🌸
💮 Introduction
--
A different and powerful approach is to use the frequencies' crossing of the median (zero) line. This would signify a continuation of the reversal. However, also here, not all of those crossings would be trades with a high probability of success. For this reason, we seek to only consider reversals after the most strong trends start to show weakness. We call these reversals the "Quantile Median Crosses" (QMC), derived from the methodology.
💮 Methodology
--
To find this "most strong trends", we calculate the integral ("the area") of a frequency between all historical median crosses, and take an upper quantile of those integrals. This means that when the series is crossing the median in often (consolidation), the ares between those crosses would be small. But if there was a strong momentum, and the series would separate itself significantly from the median and would do so for a long time, its area would be large.
So after considering all the past integrals, we take the upper quantile of those (i.e. sort all integral and for example take the top 5%) and if the latest trend's integral was in this upper quantile, it is considered "significant". Hence, the name "quantile" in the name "Quantile Median Cross"
💮 Tuning the QMC
--
The QMC is easily tuned by its "sensitivity". This basically represents a set of quantile bounds for the normal, slow and lethargic series. We have set these 3 parameters for each sensitivity profile after careful testing. The 🎩 Ultimate Edition gives full control for each quantile bound.
💮 QMC on the Oscillator
--
The QMC is shown as a label "🔴" above the median or with "🟢" below the median. In the 🎩 Ultimate Edition, the user instead sees the exact quantile and the number of samples. The normal frequency has a "bronze" colour, the slow frequency "silver" and the lethargic is "gold". In addition to the labels, there are also diamond shapes in the same colour drawn on the median in the oscillator. This represents the previous median crossing, and helps the user to see between which two points the integral is calculated.
🌸 --- DETAILED FEATURES --- 🌸
As discussed, at its core, the main signals are the Gradient Divergence Signals (GDM) and Quantile Median Crosses (QMC). However, there are more very powerful features that this 📡 Signal Provider can include. Below is a list of all features and we differentiate the availability of a feature per 📡 Signal Provider version by using these icons: 🤲 Community Edition; 🧰 Professional Edition; 🎩 Ultimate Edition.
Before going into the features, there are two important aspects to note: As this is a 📡 Signal Provider, it can be connected to the GYTS 🧬 Flux Composer and this is possible for each edition (i.e. the 🤲 Community Edition 📡 Signal Composer works with the 🤲 Community Edition 🧬 Flux Composer, and the same holds for the 🧰 Professional and 🎩 Ultimate Editions). Contrary to most other indicators that connect with each other, the signals that are passed are not just binary signals ("buy" or "sell") but pass the actual GDM and QMC values. This gives the opportunity in the 🧬 Flux Composer to more accurately use multiple signals with different strengths to finally give an overall signal.
The second important aspect is that for the 🤲 Community Edition, there are two versions of this 📡 Signal Provider: one that has the GDM feature and another the QMC feature. Besides that, the list below depicts a fairly complete overview of all the features across different versions:
( 🤲 🧰 🎩 ) Four Dimensions -- All four dimensions are available for each edition. The input data can also be transformed with an EMA or CoG as in the original WaveTrend 3D.
( -- 🧰 🎩 ) Both GDM and QMC -- Only the Pro and Ult versions include both the GDM and QMC in one indicator
( 🤲 🧰 🎩 ) Custom indicator name -- There's an option to give a name to the indicator which will be displayed on the chart. On its own, it might not be helpful, but in the GoemonYae Trading System (GYTS) suite, it helps to identify the different Signal Providers.
( 🤲 🧰 🎩 ) Visual improvements -- As in the original WaveTrend 3D, there are various ways the indicator can be displayed, including emphasising a certain frequency, a "mirror mode" and separating each frequency. We have expanded on some of these options. For example, the divergences, GDMs and QMCs are also displayed when the frequencies are separated, the mirror mode works with the emphasised frequency, there are more options to control the width of the emphasised frequency and each frequency can be enabled or disabled.
( 🤲 🧰 🎩 ) Support for HTF -- The indicator works on higher timeframes than the current chart and all parameters and calculations are scaled accordingly.
( __ 🧰 🎩 ) Support for other tickers -- There is also an option to select another ticker than the current chart. This especially makes sense in the 🌸 GYTS suite 🌸, where multiple Signal Providers are combined to find confluence. For example, a common approach is to use a certain ETF (or BTC in crypto) on a higher timeframe as filter to determine overall market direction.
( __ __ 🎩 ) Disable "only true divergences" -- In the Ultimate Edition, less signals can be filtered out when disabling looking at the third frequency. In general, this is not the best idea but it can be helpful when filtering signals with other means.
( __ 🧰 __ ) GDM profiles -- As mentioned, the GDM is carefully tuned and we consider it an excellent method to signify the strength of a divergence. Therefore, the standard calculation in the Community Edition is sufficient. Nevertheless, the Pro Edition has profiles (as previously described) so the user can select how (s)he feels a "strong divergence" should be.
( __ __ 🎩 ) GDM weights -- Full control over the weights of the 6 components of the GDM instead of using the profiles. The GDM algorithm is set up in such way that this is possible in an intuitive way.
( __ __ 🎩 ) Disable asymmetric GDM calculation -- Calculate the bullish and bearish GDMs independently (asymmetric calculation) or normalise them altogether (symmetric calculation). This can sometimes be helpful to filter out weaker GDMs depending on market conditions.
( 🤲 🧰 🎩 ) QMC calculation -- Using the QMC is possible in all versions, and each of the Normal, Slow and Lethargic frequencies can be toggled on and off.
( __ 🧰 __ ) QMC sensitivity -- Similar to the GDM profiles, in the Pro version there are presets to make the sensitivity higher (and thus get more signals) or lower.
( __ __ 🎩 ) QMC quantile threshold -- Instead of the sensitivity presets, in the Ult Edition the quantile threshold for each frequency is set. The user also sees the actual quantile and number of samples in the label
( 🤲 🧰 🎩 ) WaveTrend 4D settings -- Possibility to adjust the core WaveTrend settings
( 🤲 🧰 🎩 ) Alerts -- When alerts are enabled, TradingView will notify when there is a bullish/bearish strong GDM (i.e. within the zone) and a bullish/bearish QMC.
OBV + WaveTrend Volume Scalper [GratefulFutures]This script is a combination script of three different strategies that provides buy and sell signals based on the change of volume with momentum confirmations.
Sources used:
This script relies on the outstanding scripts of the great script writer LazyBear: LazyBear
The following scripts were used in this publication:
1. A modified "On-Balance Volume Oscillator" modified from LazyBear's original script:
2. Wavetrend Oscillator with crosses, Author: LazyBear
3. Squeeze Momentum Oscillator, Author: LazyBear
This script functions based on the following criteria being true:
1. On balance volume oscillator turning from negative to positive (buy) or positive to negative (sell)
2. Squeeze Momentum value is increasing (buy) or decreasing (sell)
3. Wavetrend 1 (wt1) is greater than wavetrend 2 (wt2) (buy)/ Wavetrend 1 (wt1) is less than wavetrend 2 (wt2) (sell)
By combining these factors the indicator is able to signal exactly when net buying turns to net selling (OBV) and when this change is most advantageous to continue based on the momentum and price action of the underlying asset (SQMOMO and Wavetrend).
This allows you to pair volume and price action for a powerful tool to identify where price will reverse or continue providing exceptional entries for short term trades, especially when combined with other aspects such as support and resistance, or volume profile.
How to use:
Simply adjust the settings to your preference and read the given signals as generated.
Settings
There are multiple ways to tune the signals generated. It is set standard for my preferred use on a 1 minute chart.
OBV Oscillator Settings
The first 4 dropdowns in the Inputs section tune the On Balance Volume Oscillator (OBVO) portion of the indicator. You can choose if you want it to calculate based on close, open, high, low, or other value.
The most impactful in the entire settings is going to be the length and smoothing of the OBVO EMA. Making this number lower increasing the sensitivity to changes in volume, making the signals come quicker but is more susceptible to quick fluctuations. A value of between (5-20) is reasonable for the OBVO EMA length. There is a separate smoothing factor titled OBV Smoothing Length and below that, OBV Smoothing Type , a value of (2) is standard with "SMA" for smoothing type with a value of between 2-10 being reasonable. You may also play with these values to see what you like for your trading style.
Wavetrend Settings
The next 3 options are to modify the wavetrend portion of the indicator. I do not modify these from standard, and feel that they work appropriately on all time frames at the following values: n1 length (10), n2 length (20), Wavetrend Signal SMA length (4)
Squeeze Momentum Settings
The following 5 options through the end modify the Squeeze momentum portion of the indicator. The only one that modifies the signals generated is the KC Length , Making this number lower increasing the sensitivity to changes in price action, making the signals come quicker but is more susceptible to quick fluctuations. A value of between (18-25) is reasonable for KC Length .
Style Setting
You may select if you want to see the buy and sell signals. The following 5 options Raw OBV Osc through Squeeze Momentum allow you to see where each specific requirement was met, posted as a vertical line, but for live use it is recommended to turn all of these vertical lines off and only use the buy and sell signals.
Time Frames:
While this script is most effective on shorter time frames (1 minute for scalping and daytrading) it is also viable to use it on longer timeframes, due to the nature of its components being independent of time frame.
Examples of use - (Green and red vertical lines are for visualization purpose and are not part of the script)
SPY 1 Minute (Factory Settings):
SPX 15 minutes (Factory Settings):
Considerations
This script is meant primarily for short term trading, trades on the basis of seconds to minutes primarily. While they can be a good indication of volume lining up with momentum, it is always wise to use them in combination with other factors such as support, resistance, market structure, volume levels, or the many other techniques out there...
As Always... Happy Trading.
-Not_A_Mad_Scientist (GreatfulFutures Trade University)

[GYTS-CE] Signal Provider | WaveTrend 4D with QMCWaveTrend 4D with Quantile Median Crosses (Community Edition)
🌸 " 📡 Signal Provider" in GoemonYae Trading System (GYTS) 🌸
WaveTrend 4D (WT4D) is an extension of the incredible WaveTrend 3D (2022, Justin Dehorty) . This oscillator elevates the classic WaveTrend by integrating advanced mathematical models for a multi-dimensional view of market momentum, capturing subtle shifts and trends that traditional indicators might miss. Each oscillator layer uses a combination of normalised derivatives, hyperbolic tangent transformations, and dual-pole filtering (John Ehlers' SuperSmoother), providing normalised and smooth signals with minimised lag.
The name "WaveTrend 4D" is derived from the usage of 4 dimensions, representing different frequencies or timeframes. Next to the "fast", "normal" and "slow" frequency, the fourth frequency is called "lethargic" (very slow). This gives the opportunity utilise more dimensions without having abundant signals, since we quantify and filter the quality of signals.
WT4D strives to help discriminating high-quality signals from the indicator by introducing the Gradient Divergence Measure (GDM) and Quantile Median Crosses (QMC). For simplicity, speed and focus, this particular indicator includes only the QMC part. Check the other 🤲Community Edition of this indicator that focuses on the GDM. For QMC, see below for more information.
🌸 --- QUANTILE MEDIAN CROSSES (QMC) --- 🌸
💮 Introduction
--
A powerful approach when working with WaveTrend is to use the frequencies' crossings of the median (zero) line. This would signify a continuation of the reversal. However, not all of those crossings would be trades with a high probability of success. For this reason, we strive to only consider reversals after the most strong trends start to show weakness. We call these reversals the "Quantile Median Crosses" (QMC), deriving the name from the used methodology.
💮 Methodology
--
To find these "most strong trends", we calculate the integral ("the area") of a frequency between all historical median crosses, and take an upper quantile of those integrals. This means that when the frequency is crossing the median in a period of consolidation, the areas between those crosses would be small. But if there was a strong momentum, and the frequency would separate itself significantly from the median and would do so for a long time, its area would be large.
So after considering all the past integrals, we take the upper quantile of those (i.e. sort all integrals and for example take the top 5%) and if the latest trend's integral was in this upper quantile, it is considered "significant". Hence, the name "quantile" in the name "Quantile Median Cross".
💮 QMC on the Oscillator
--
The QMC is shown as a label "🔴" above the median or with "🟢" below the median. The normal frequency has a "bronze" colour, the slow frequency "silver" and the lethargic is "gold". In addition to the labels, there are also diamond shapes in the same colour drawn on the median in the oscillator. This represents the previous median crossing, and helps the user to see between which two points the integral is calculated.
🌸 --- GOEMONYAE TRADING SYSTEM --- 🌸
As previously mentioned, this indicator is a 📡 Signal Provider, part of the suite of the GoemonYae Trading System (🤲 Community Edition). The greatest value comes from connecting multiple 📡 Signal Providers to the 🧬 Flux Composer to find confluence between signals. Contrary to most other indicators that connect with each other, the signals that are passed are not just binary signals ("buy" or "sell") but pass the actual GDM and QMC values. This gives the opportunity in the 🧬 Flux Composer to more accurately use multiple signals with different strengths to finally give an overall signal. On its turn, the Flux Composer can be connected to the GYTS "🎼 Order Orchestrator" for backtesting and trade automation.

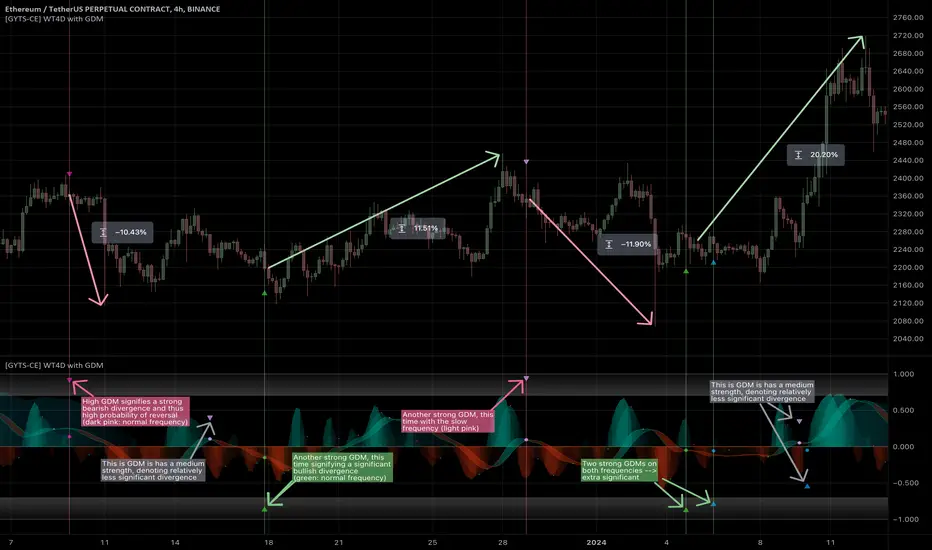
[GYTS-CE] Signal Provider | WaveTrend 4D with GDMWaveTrend 4D with Gradient Divergence Measure (Community Edition)
🌸 " 📡 Signal Provider" in GoemonYae Trading System (GYTS) 🌸
WaveTrend 4D (WT4D) is an extension of the incredible WaveTrend 3D (2022, Justin Dehorty) . This oscillator elevates the classic WaveTrend by integrating advanced mathematical models for a multi-dimensional view of market momentum, capturing subtle shifts and trends that traditional indicators might miss. Each oscillator layer uses a combination of normalised derivatives, hyperbolic tangent transformations, and dual-pole filtering (John Ehlers' SuperSmoother), providing normalised and smooth signals with minimised lag.
The name "WaveTrend 4D" is derived from the usage of 4 dimensions, representing different frequencies or timeframes. Next to the "fast", "normal" and "slow" frequency, the fourth frequency is called "lethargic" (very slow). This gives the opportunity utilise more dimensions without having abundant signals, since we quantify and filter the quality of signals.
WT4D strives to help discriminating high-quality signals from the indicator by introducing the Gradient Divergence Measure (GDM) and Quantile Median Crosses (QMC). For simplicity, speed and focus, this particular indicator includes only the GDM part. Check the other 🤲Community Edition of this indicator that focuses on the QMC. For GDM, see below for more information.
🌸 --- GRADIENT DIVERGENCE MEASURE (GDM) --- 🌸
💮 Introduction
--
The GDM dynamically calculates a composite measure based on multiple factors. Unlike traditional binary divergence indicators, GDM employs a continuous value system to capture the nuanced dynamics of market behaviour. This methodology allows traders and analysts to assess the potency of divergence signals with greater precision, facilitating more informed decision-making processes.
💮 Methodology
--
The GDM is calculated using a composite formula that integrates various market dynamics. At its core, it consists of six components listed below, each weighted to optimize the indicator's responsiveness to market conditions:
The magnitude of relative change between waves -- A larger difference between the waves, i.e. lower high or higher low could signify a stronger divergence.
The absolute value of the latest wave -- The strength of the latest wave provides insight into the extremity of the market conditions.
Slope of the divergence -- The slope between the two points of divergence essentially measures the rate of change in the frequency\'s value over time. It captures both the direction and the steepness of the indicator’s move between two waves.
The magnitude of relative change of the price -- A divergence means that the oscillator shows an opposite pattern than price action. Thus, if the price makes a significantly higher high or lower low, but the indicator does not, this discrepancy can be used to measure the divergence strength. This components measures the price's extrema during the crosses of the indicator's waves.
Higher timeframe's frequency trend -- Similarly, instead of looking at the price directly, this component measures the more general trend of the price by using the higher timeframe frequency (i.e. the slow frequency when looking at divergences of the normal frequency).
Time duration -- Lastly, the time duration between the two points of a divergence can also be an important factor. A divergence that spans over a longer period might indicate a more significant market sentiment shift.
💮 Tuning the GDM
--
The 6 components discussed above are not independent, e.g. the slope is actually the result of the magnitude between waves, the absolute value and time duration. However, the default GDM is carefully tuned to include all these features without being too sensitive to outliers.
This makes this indicator very user-friendly. The only core parameter is the the "sensitivity". This controls the extent of normalisation between signals, and essentially affects how often strong GDMs appear. At the conservative end (higher sensitivity), the strong GDMs are less frequent but are relatively significant, while with a lower sensitivity the strong GDMs appear more frequent.
💮 GDM on the Oscillator
--
The GDMs are represented by triangles and their value represents the strength. A value close to `1` signifies a strong bearish divergence and thus a possible reversal of continuation of a downtrend. Similarly, a value close to `-1` signifies a strong bullish divergence.
Note that there are two colour sets which can be enabled and disabled. One uses crosses between the fast and normal frequencies (with the slow frequency acting as the price trend with which there should be an opposite interaction -- hence a "divergence"). Similarly, crosses between the normal and slow frequencies (with the lethargic (the most slow) frequency acting as the price trend) are used to find divergences on a higher timeframe.
Another handy feature is a threshold to more strikingly visualise "strong" GDMs.
🌸 --- GOEMONYAE TRADING SYSTEM --- 🌸
As previously mentioned, this indicator is a 📡 Signal Provider, part of the suite of the GoemonYae Trading System (🤲 Community Edition). The greatest value comes from connecting multiple 📡 Signal Providers to the 🧬 Flux Composer to find confluence between signals. Contrary to most other indicators that connect with each other, the signals that are passed are not just binary signals ("buy" or "sell") but pass the actual GDM and QMC values. This gives the opportunity in the 🧬 Flux Composer to more accurately use multiple signals with different strengths to finally give an overall signal. On its turn, the Flux Composer can be connected to the GYTS "🎼 Order Orchestrator" for backtesting and trade automation.
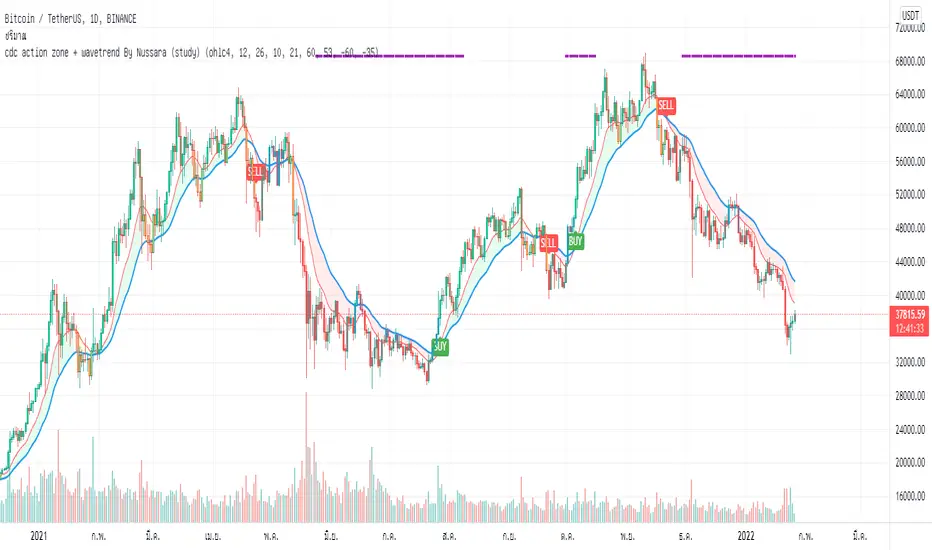
cdc action zone + wavetrend By Nussara (study)I previously shared strategy CDC action zone + WaveTrend By Nussara.
But some people say that the alarm is not connected to the robot trade (not 3commas robot trade) .
But for me, I used the strategy CDC action zone + WaveTrend By Nussara connect to 3commas robot trade with no problem at all.
However, I made a study script for those who want to connect to robot trade.
This version combines a famous indicator CDC Action zone V.2 and WaveTrend together.
When the WaveTrend cross below -35, it is an indication of oversold. The indicator will show a purple line on top until the WaveTrend is greater than 53.
Buy condition.
1. Purple line appears on the top indicator.
2. CDC Action zone - fast EMA crossover slow EMA .
Sell condition
1. CDC Action zone - fast EMA crossunder slow EMA .
This indicator is Suitable for a 1DAY time frame or more.
WaveTrend with MFI and Auto/Manual HTFWaveTrend with MFI and Auto/Manual HTF
WaveTrend with MFI and Auto/Manual HTF
WaveTrend with MFI and Auto/Manual HTF
WaveTrend with MFI and Auto/Manual HTF

WaveTrend with CrossesWaveTrend with Crosses — Spot Golden & Dead Crosses with Precision!
WaveTrend with Crosses is a customized version of the classic WaveTrend oscillator, enhanced with clean visual signals to help you pinpoint momentum shifts through golden and dead crosses.
✅ Key Features
Momentum analysis based on WaveTrend (WT1 & WT2)
Detects Golden Cross (WT1 crosses above WT2) and
Dead Cross (WT1 crosses below WT2)
Customizable Overbought/Oversold zones (defaults: ±60, ±53)
Visual circle markers on valid crossovers for easy recognition
Built-in alert system to notify you of real-time cross signals
📊 How to Use
Add the indicator to your chart and choose your desired symbol & timeframe.
The blue shaded area shows the divergence between WT1 and WT2 — a visual cue for momentum buildup.
Circle markers:
Red circle: Dead cross — potential bearish momentum
Green circle: Golden cross — potential bullish reversal
Customize the settings to fit your personal trading strategy if needed.
🛠 User Inputs
n1, n2: Channel lengths (default: 10 and 21)
obLevel, osLevel: Overbought/Oversold thresholds (default: ±60 / ±53)
standardValue: Threshold used to validate significant crossovers (default: 60)
🔔 Alert System
Get notified with alerts like "Golden Cross" or "Dead Cross" when key crossovers occur,
helping you react quickly and confidently.
⚠️ Notes
Past performance is not indicative of future results — always backtest and use in conjunction with other tools.
Low timeframes may generate frequent signals; filtering or confirmation is recommended.
💡 Author's Note
Simple and effective — this tool is designed to focus solely on cross-based entries.
Ideal for momentum-based scalping or swing trading strategies.
Feel free to customize and tweak as needed! 😄

WaveTrend [LazyBear] with Long/Short LabelsWaveTrend Oscillator with Entry Signals (LONG/SHORT) – Advanced Edition
This indicator is based on the renowned WaveTrend Oscillator by LazyBear, a favorite among professional traders for spotting trend reversals with precision.
🚀 Features:
Original WaveTrend formula with dual-line structure (WT1 & WT2).
Customizable overbought and oversold zones for visual clarity.
Automatic LONG and SHORT signals plotted directly on the chart:
✅ LONG: When WT1 crosses above WT2 below the oversold zone.
❌ SHORT: When WT1 crosses below WT2 above the overbought zone.
Momentum histogram shows strength of market moves.
Fully optimized for Pine Script v5 and lightweight across all timeframes.
🔍 How to use:
Combine with support/resistance levels or candlestick reversal patterns.
Works best on 15min, 1H, or 4H charts.
Suitable for all markets: crypto, stocks, forex, indices.
📊 Ideal for:
Traders seeking clean, reliable entry signals.
Reversal strategies with technical confluence.
Visual confirmation of WaveTrend crossovers without manual interpretation.
💡 Pro Tip: Combine with EMA or RSI filters to further enhance accuracy.
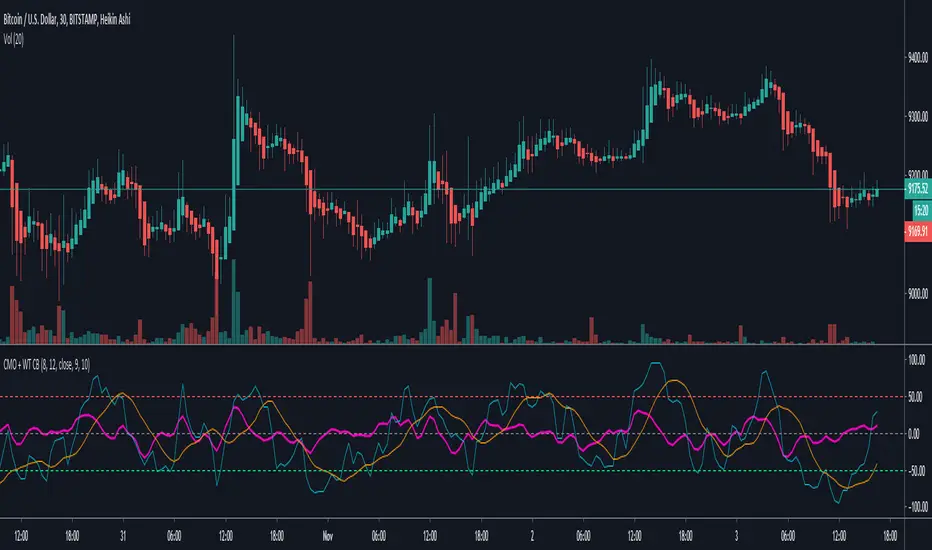
Chande Momentum Oscillator + WaveTrend Oscillator [ChuckBanger]This is a combination of Lazybears WaveTrend Oscillator (purple line) and Chande Momentum Oscillator (blue line with the orange line as a signal line). Use WaveTrend as a confirmation tool. It is consider as a selling point when CMO is over the red horizontal dotted line. The opposite applies if CMO line is under the red horizontal dotted line.
You can also use this with WaveTrand to confirm the sell or buy point. When WT line is over center line and CMO has crossed over it's signal line. It is a buy point. The opposite applies if WT line is under the center line and CMO is under its signal line.
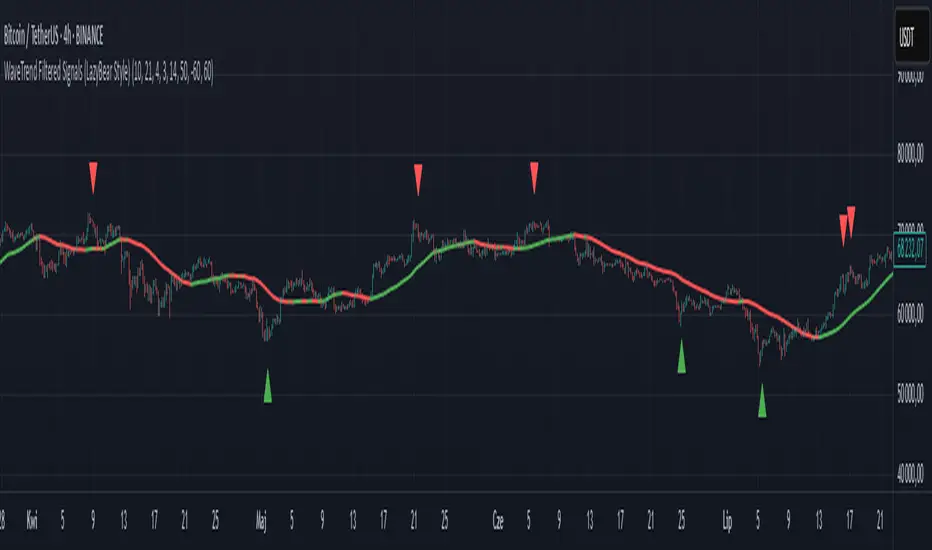
WaveTrend Filtered Signals (LazyBear Style)WaveTrend Filtered Signals (LazyBear Style)
This indicator is based on the popular WaveTrend oscillator (LazyBear) and adds several optional filters to improve signal quality:
✅ Available filters:
WT oversold/overbought zones – enabled by default. Signals are shown only if WT was previously in the specified zone (e.g., < -60 for longs, > 60 for shorts).
SMA trend filter – allows filtering signals in the direction of the moving average trend.
SMA position filter – signals appear only when price is above (for long) or below (for short) the moving average.
Consolidation filter – ignores signals during low-volatility sideways price movement.
💡 All filters are optional and can be enabled or disabled in the settings.
The default setup focuses on a clean approach: WaveTrend + oversold/overbought zones, with other filters left for customization.
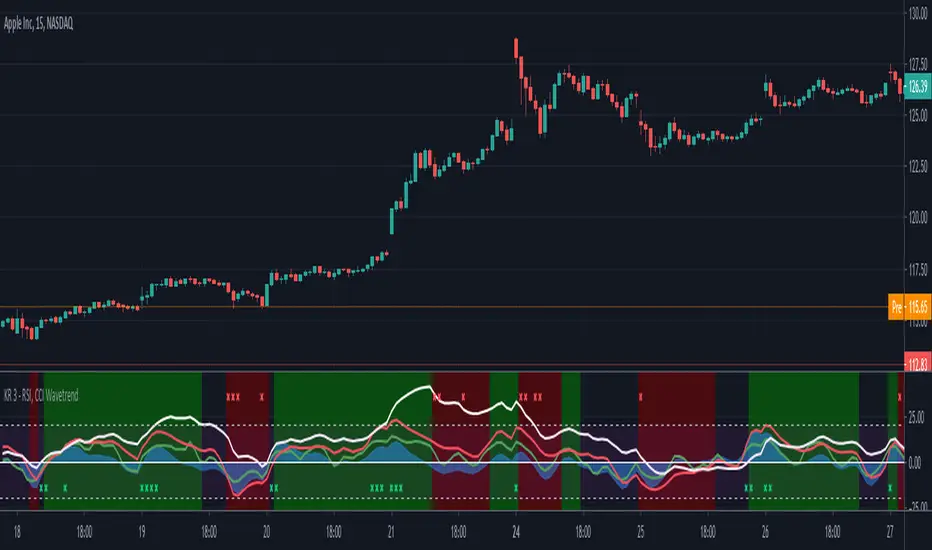
RSI, CCI WaveTrend God by Keiron RichieThis script uses Relative Strength Index ( RSI ), Commodity Channel Index ( CCI ) and WaveTrend (WT) together as an oscillator with an additional custom RSI rate of change indicator and buy/sell background color zones derived from a complex combination of these indicators.
The White line shows the moving average of RSI as an oscillator
The Green line is the fast Exponential Moving Average ( EMA ) of CCI & the Red line is the slow EMA of CCI .
The Blue area is the EMA of WaveTrend WT
How to read:
If the RSI , CCI or WT crosses above a programmed threshold and the other lines are also within a pre-defined buy range then the background will change to green for buy.
If the RSI , CCI or WT crosses below a programmed threshold and the other lines are also within a pre-defined sell range then the background will change to red for sell.
Where requirements are not met, the background is neither green nor red.
There are also red and green indicator x’s at the top/bottom of the indicator. They show a drastic change in Relative strength within a short period. This often indicates an immediate buy or sell opportunity.
Buy, Sell, Exit Buy and Exit Sell alerts are included.
Use the link below to obtain access to this indicator.