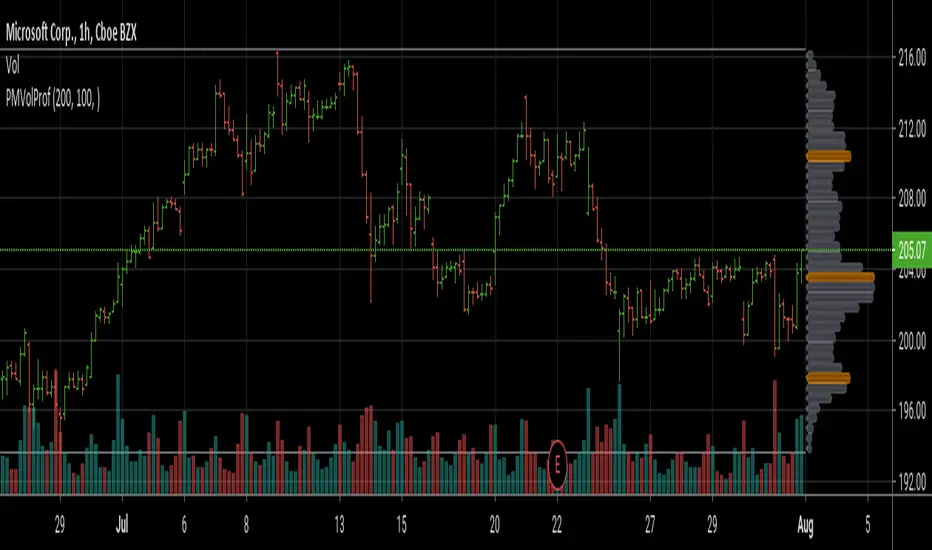
Poor man's volume profileThis is an attempt to get something more or less similar to the volume profile for free.
The code is generated using a template. To change the settings, you may need to regenerate the code. The code has a link to the repository with the template.
Buscar en scripts para "Volume"
Renko Weis Wave VolumeThis is live and non-repainting Renko Weis Wave Volume tool. The tool has it’s own engine and not using integrated function of Trading View.
Renko charts ignore time and focus solely on price changes that meet a minimum requirement. Time is not a factor on Renko chart but as you can see with this script Renko RSI created on time chart.
Renko chart provide several advantages, some of them are filtering insignificant price movements and noise, focusing on important price movements and making support/resistance levels much easier to identify.
As source Closing price or High/Low can be used.
Traditional or ATR can be used for scaling. If ATR is chosen then there is rounding algorithm according to mintick value of the security. For example if mintick value is 0.001 and brick size (ATR/Percentage) is 0.00124 then box size becomes 0.001. And also while using dynamic brick size (ATR), box size changes only when Renko closing price changed.
This tool is based on the Weis Wave described by David H. Weis (a Wyckoff specialist). The Weis Waves Indicator sums up volumes in each wave. This is how we receive a bar chart of cumulative volumes of alternating waves and The cumulative volume makes the Weis wave charts unique.
If there is no volume information for the security then this tool has an option to use “True Range” instead of volume .
Better to use this script with the following one:
Enjoy!

Delta Volume Columns [LucF]Displays delta volume columns using intrabar volume information. Each volume column is divided into three sections: buying, selling and neutral volume. Volume for each section is determined from the volume and price movement of each intrabar at a user-selected lower resolution.
Features include:
- Choice of color themes for either dark or light chart backgrounds
- Delta volume columns
- Volume Balance displayed as the difference between the MAs of buying and selling volume
- Display of divergences between a bar’s volume balance and the bar’s price movement (example: buying volume > selling volume but close < open). Divergences can be shown in 2 different color schemes (including green/red showing a tentative direction), on volume columns and/or on chart bars
- Display of bar by bar volume balance with highlighting of above average volume
- Display of the usual total volume MA
- Choice of the lower resolution used to retrieve intrabar information
- Alerts configurable on any combination of the markers, with control over long/short direction
- Choice of 3 different markers:
1. Double bumps: two consecutive bars where buying or selling volume is in the same direction and where volume > volume MA
2. Divergence confirmations: direction of the price bar following a price/volume balance divergence
3. Volume balance shifts: zero level crossings of the volume balance MA delta
The chart shows the two main modes of display:
- Top pane : shows the stacked volume columns with divergences in orange and the flattened volume balance MAs delta at the bottom of the volume columns. This volume balance is the same shown in the bottom pane. The top pane also shows the instant volume balance strip above the volume columns. The strip’s colors show which of the buying or selling volume was greater, and colors are brighter if the total volume was above the total volume MA.
- Bottom pane : shows the volume balance MAs delta with markers 1 and 2. Given that this graphic has no price momentum component, I find quite eerie how it often looks like a momentum-based signal.
The default 5 minute intrabar resolution is used in combination with the weekly chart, which is excessive.
This script uses a special characteristic of the security() function’s behavior when it is sent to a resolution lower than the chart’s resolution. Details are given in the script’s comments. This method has the advantage of working under more circumstances than some of the other loop-based methods, but it also has its limits.
IMPORTANT
This is what you need to know:
- The method used does not work on the realtime bar—only on historical bars. Consequently, the volume column shown on the realtime bar is a normal volume column plotted in green or red, following price movement. The column will only show delta volume information after it closes and becomes a historical bar.
- The indicator only works on some chart resolutions: 5, 10, 15 and 30 minutes, 1, 2, 4, 6, and 12 hours, 1 day, 1 week and 1 month. The script’s code can be modified to run on other resolutions, but chart resolutions must be divisible by the lower resolution used for intrabars.
- Intrabar resolutions can be selected from 1, 5, 15, 30, 45 minutes, 1, 2, 3, 4 hours, 1 day, 1 week and 1 month. The intrabar resolution must of course be smaller than the chart’s resolution.
- Contrary to my other indicators where alerts must be configured to trigger “Once Per Bar Close” in order to avoid false triggers (or repainting), all this indicator’s alerts are designed to trigger using previous bar information since the indicator’s calculations in the realtime bar are not exact. Markers are not plotted with a negative offset; they appear at the beginning of the realtime bar following confirmation of the marker’s condition on the previous bar. Alerts for this indicator should thus be configured to trigger “Once Per Bar” so they trigger at the beginning of the realtime bar. Note that the penalty is not that great, as it is simply the instant between the close of the previous realtime bar and the opening of the next. The advantage of using this technique is that the indicator does not repaint; a marker that appears at the beginning of the realtime bar will never disappear.
- The script only plots information that is reliable in the realtime bar, i.e., total volume and markers. All other plots are set to n/a to prevent misleading traders.
- When the difference between the chart’s resolution and the lower resolution is too important, volume columns will not calculate for all bars in the dataset.
On Delta Volume
Buying or selling volume are misnomers, as every unit of volume transacted is both bought and sold by 2 different traders. There is no such thing as “buy only” or “sell only” volume, but trader lingo is riddled with original fabulations.
Without access to order book information, traders work with the assumption that when price moves up during a bar, there was more buying pressure than selling pressure. The built-in volume indicator available on TradingView uses this logic to color the volume columns green or red. While this script’s numbers are more precise because it analyses a number of intrabars to calculate its information, it uses the exact same imperfect logic to calculate its buying/selling/neutral sections.
Until Pine scripts can have access to how much volume was transacted at the bid/ask prices, our so-called buying/selling volume information will always be a mere proxy.
Divergences
You may wonder how there can be divergences between buying/selling volume information and price movement. This will sometimes be due to the methodology’s shortcomings we have just discussed, but divergences may also occur in instances where because of order book structure, it takes less volume to increase the price of an asset than it takes to decrease it.
As usual, divergences are points of interest because they reveal imbalances, which may or may not become turning points. I do not share the overwhelming enthusiasm traders have for divergences. To your pattern-hungry brain, the orange bars this indicator shows on chart will—as divergences on other indicators do–appear to often indicate turnarounds. My opinion is that reality is generally quite sobering, as many who have tried building automated rules based on divergences will tell you. I do not have hard numbers on the lack of performance of divergences—only many failed attempts to make them perform, which a few experienced strategy modelers I know share with me. Please don’t try to read too much into them. While they look great on past data, I find they are often difficult to use in realtime to make bets with good odds.
Thanks to:
- A guy called Kuan who commented on a Backtest Rookies presentation of an intrabar delta volume indicator using a for loop. The heart of “my” indicator is code borrowed from Kuan; I just built a hopefully useful wrapper around it.
- @theheirophant, my partner in the exploration of the sometimes weird abysses of security() ’s behavior at lower resolutions.

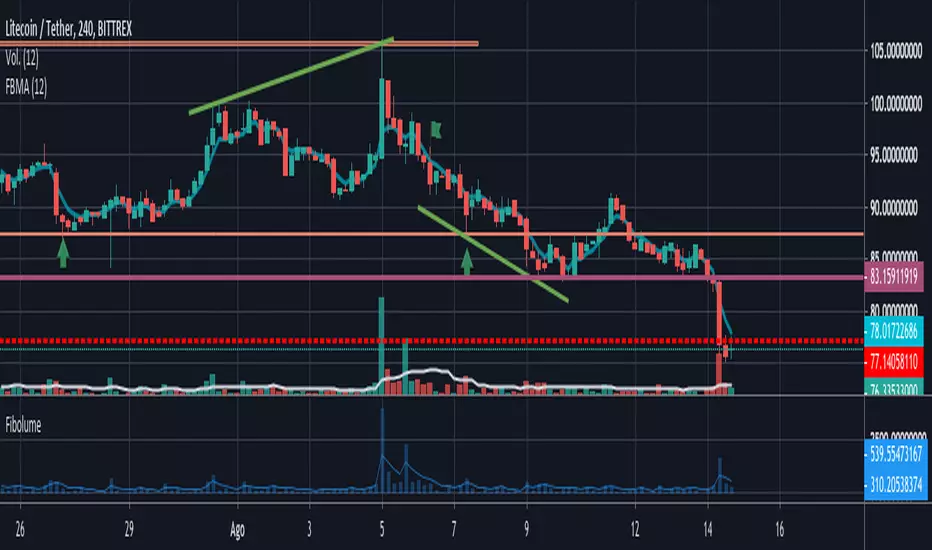
Fibonacci Volume Average FIBOLUMEEl gráfico de volumen por defecto determina el promedio del volumen asignando el mismo peso o importancia a los volúmenes del rango de días, con FIBOLUME se asigna un peso o importancia mayor y de forma incremental a los últimos precios y asignando menos pesos o importancia a los mas antiguos. en algunos casos un gran volumen de un día afecta mucho el promedio de otros días con un volumen menor no devolviendo un dato real del comportamiento del mercado a lo largo del rango de fechas
Volume Adaptive BandsIntroduction
I have been asked by @Coppermine and @Verbena to make bands that use volume to provide adaptive results. My first approach was to use exponential averaging, in order to do so i needed to quantify volume movement using rescaling with the objective to make the bands go away from each others when there is low volume, this approach is efficient and can work on any time frame, however i decided at the end to use another method which rely on recursive weighting, cleaner but more parametric. Those bands aim to highlight great breakouts point to go with the trend.
The Indicator
length control the period of the moving averages used in the script, however low length's don't necessarily provide indications for shorter terms breakouts as shown here :
As i said the bands are close to each others when there is high volume and away when there is low volumes.
Low volume period, bands will avoid to cross price
High volume, bands will be close to generate signals.
Correction Factor
Higher time frames will lower the distance between each band, this is because volume is higher during higher time frames, remember that the indicator bands are close to each others when volume is high.
1h chart eurusd.
This is why i added a correction factor, this factor can help you control the distance between each bands, when the correction factor is greater than 1 the bands will be closer to each others, this is useful for low time frames where the average volume is lower. When the time frame is high, use values between 0 and 1 to increase distance between each bands.
Correction factor = 0.2
Conclusion
I presented a new adaptive band indicator that adapt to trading volume by using recursive weighting, volume can be replaced by other indicators but you can have results going nuts, at the end its about experimentation. I hope you will find an use to it, thanks to @Coppermine and @Verbena for the request :)
Thanks for reading !

Highest Volume Index by ParaticaIt's an algorithm used in Paratica. It shows volume based volatility.

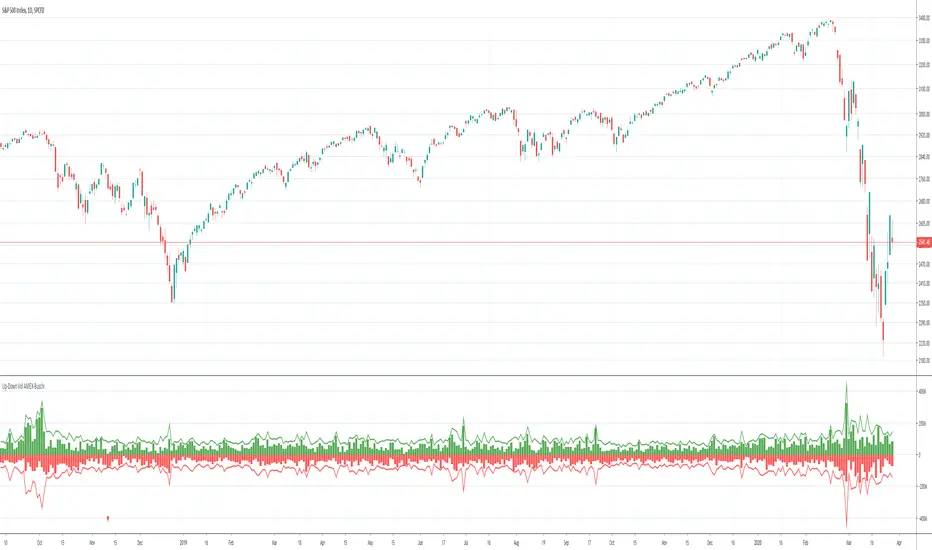
Up-Down Volume AMEX-Buschi
English:
This indicator shows the AMEX's up volume (green) and down volume (red).
Extreme trading days with more than 90 % up or down volume are marked via lines (theoretically values) and triangles (breaches).
Deutsch:
Dieser Indikator zeigt das Aufwärts- (grün) und Abwärts-Volumen (rot) der AMEX.
Extreme Handelstage mit mehr als 90 % Aufwärts- oder Abwärts-Volumen ist gekennzeichnet über Linien (theoretische Werte) und Dreiecke (Überschreitungen).
Up-Down Volume NASDAQ-Buschi
English:
This indicator shows the NASDAQ's up volume (green) and down volume (red).
Extreme trading days with more than 90 % up or down volume are marked via lines (theoretically values) and triangles (breaches).
Deutsch:
Dieser Indikator zeigt das Aufwärts- (grün) und Abwärts-Volumen (rot) der NASDAQ.
Extreme Handelstage mit mehr als 90 % Aufwärts- oder Abwärts-Volumen ist gekennzeichnet über Linien (theoretische Werte) und Dreiecke (Überschreitungen).

Up-Down Volume NYSE-Buschi
English:
This indicator shows the NYSE's up volume (green) and down volume (red).
Extreme trading days with more than 90 % up or down volume are marked via lines (theoretically values) and triangles (breaches).
Deutsch:
Dieser Indikator zeigt das Aufwärts- (grün) und Abwärts-Volumen (rot) der NYSE.
Extreme Handelstage mit mehr als 90 % Aufwärts- oder Abwärts-Volumen ist gekennzeichnet über Linien (theoretische Werte) und Dreiecke (Überschreitungen).

Accumulation/Distribution Volume (ADV) [cI8DH]This is the simplified and optimized version of my original ADV indicator. It shows both regular volume bars and the accumulated/distributed (A/D) portion of them. The equation is elegant and intuitive. It calculates candle body to candle height ratio and multiplies it by volume: volume*(close-open)/(high-low). This is the building block of my three other indicators, ADL, ADP and ADMF.
- The volume bars has two shades of green and red. The dark shade shows amount of A/D and the light shade shows total volume (what you see on a regular volume indicator).
When money volume is enabled, volume is multiplied by price. As you can see in the chart below, trade volume in terms of USD was growing over the past years.
- Blue line is the moving average of A/D and the orange line is for total volume. When "Baseline Chart" option is enabled, this moving average is identical to ADMF indicator which can be a powerful indicator for assessing buy/sell pressure as well as money flow and volume divergences. You can turn off volume bars (from style menu) for better visibility or you can use the below indicators.
Please note that ADMF is now available as a part of ADP indicator as well and I recommend using the latter since ADP can also replace CMF and MFI indicators.
- If you change the aggregation to cumulative (while having money volume disabled), the gray line becomes identical to On Balance Volume (OBV) and the blue line identical to my ADL indicator. The latter I would argue is more accurate than Chaikin's ADL, William's A/D and OBV.

Multiple Moving Averages+TransientZones+Volumes///////////////////////////////////////////////////////////////////////////////////////////
//// MULTIPLE_MA+TRANSIENT_ZONES+VOLUMES ////
/////////////////////////////////////////////////////////////////////////////////////////
// @author GianlucaBezziccheri
// A simple script including:
// 1) 4x Simple Moving Averages
// 2) 4x Exponential Moving Averages
// 3) 4x Weighted Moving Averages
// 4) 4x Volume Weighted Moving Averages
// 5) 4x Hull Moving Averages
// 6) Transient Zones v1.1 (by Jurij)
// 7) Volumes
// You can choose MA type you prefer and even to activate all of them at the same time,
// though i don't recommend doing this.
// For more details about 6) check the original script

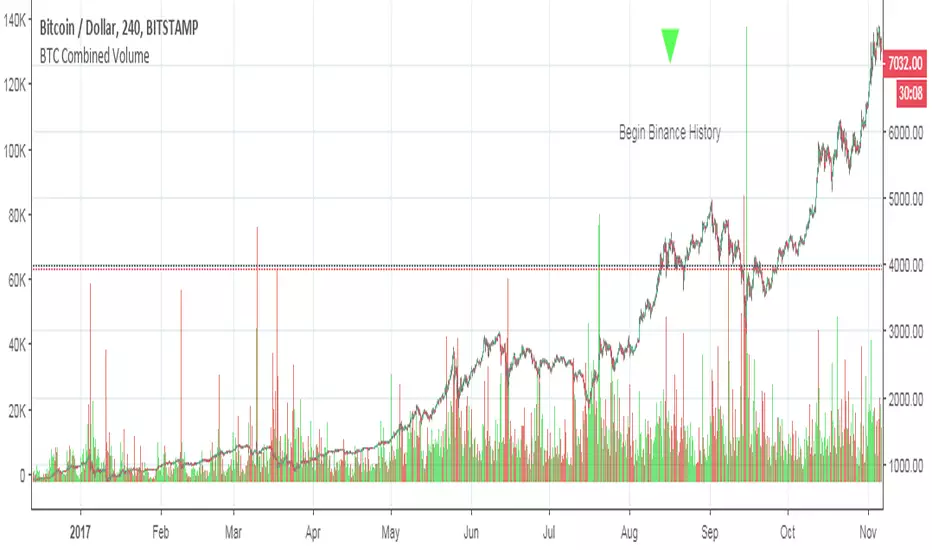
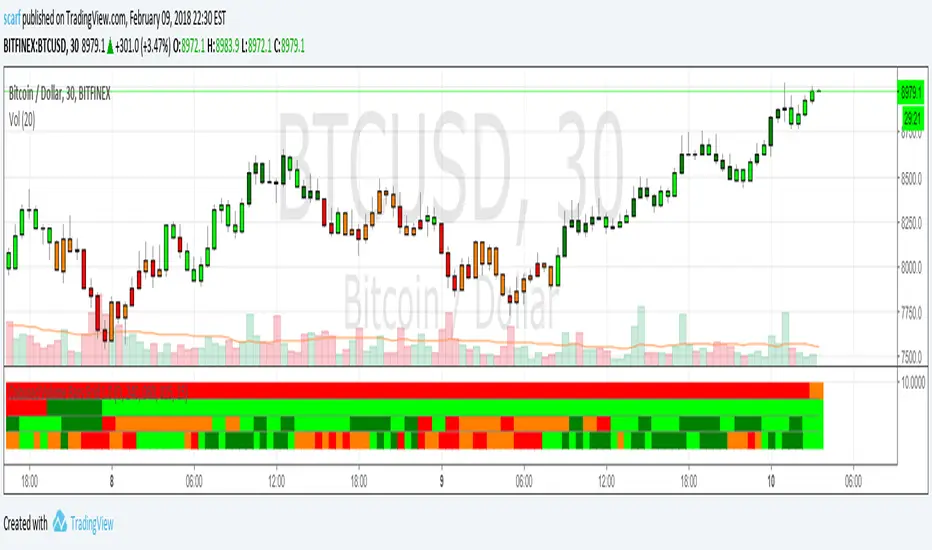
BTCUSD Combined VolumeThis script sums the volume for BTCUSD across several popular exchanges. I share it not so much as an indicator as a tool to use in other indicators (i.e. those that rely on volume, which often do not work very well for crypto due to the low volumes). Similar sums could easily be created for other currency, and with a little thought I could probably add the ability to parameterize the currency (e.g. type "BTCUSD" or "ETHBTC" or "LTCUSD" or whatever as an input).
I got the idea from seeing someone asking in chat whether it is possible to combine volumes across multiple exchanges, so kudos to oh92 and paaax for the neat idea.
Please feel free to incorporate this in your own indicators as you like...and of course if you're feeling generous, tips are appreciated. Thank you!
BTC
3KmFchJ18QvMzAJKDcFQXvyK9p1EHWQdhP
BCH
qqtrw64ptuwprk5vtj3z8qwkvh3v0jawxq7khqng7x
ETH
0x9b51361A278910Ba3945C7519C9f0FA8a77df18d
LTC
MDeWWsP7XCG2zQuZ2dYALZXQ52u2qkc8fh
Coloured Volume Grid 1.0Candles are coloured based on relative price and volume:
- If today’s closing price and volume are greater than (n) bars ago, color today’s volume bar green.
- If today’s closing price is greater than (n) bars ago but volume is not, color today’s volume bar lime.
- Similarly, if today’s closing price and volume is less than (n) bars ago, color today’s volume bar orange.
- If today’s closing price is less than (n) bars ago but volume is not, color today’s volume bar red.
The above logic in itself gives pretty remarkable considering how simple the idea is. I have added a multi-timeframe feature where the same logic is applied to 4 other timeframes. This way you can quickly be aware without having to check. There are four layers and the default settings show (from top to bottom) daily, 4h, 1h and 15m
All timeframes are adjustable in the settings.
Smart Volume (beta)This script distinguishes up/down volume based on lower resolution.
It's important to set correct inputs. Second - affects detalisation/loading speed. Third one needs to be set according to your chart resolution. 1440 for 'D', 30 for '30'.

Volume Channel Flow [ChartPrime]⯁ OVERVIEW — Volume Channel Flow
The Volume Channel Flow indicator dynamically tracks evolving trend channels while simultaneously analyzing volume distribution within each channel segment.
By combining adaptive volatility-based channel boundaries with real-time volume profiling, the tool highlights directional bias, structural breakouts, and zones where buy/sell pressure is concentrated.
This makes it a powerful hybrid of a trend-tracking system and a miniature volume-profile engine that updates live as the market moves.
⯁ CONCEPTS
Dynamic Volatility Channel:
Upper and lower channel levels are continuously recalculated using ATR. These levels shift only when price breaks outside the previous channel, signaling a trend transition.
Channel Segmentation:
When a channel shift occurs, the previous segment is closed and visually plotted as its own range — allowing traders to inspect each discrete “flow phase” of the market.
Embedded Volume Profile:
Inside each channel segment, the indicator builds a mini volume histogram using user-defined binning. This creates a quick visual read of how volume was distributed within that price range.
Point of Control (PoC):
The price level with the highest traded volume inside each completed segment is detected and plotted as a dashed horizontal PoC line.
Flow Bias (Bullish/Bearish):
The volume profile color adapts depending on whether cumulative delta volume (buy minus sell pressure) is positive or negative for the segment.
Breakout Labels:
When a new channel is formed, arrows mark whether the breakout occurred upward or downward.
⯁ FEATURES
Adaptive Trend Channel Construction
Channels update only when price closes beyond upper or lower volatility thresholds. This isolates trend shifts with minimal noise.
Channel Visualization Options
Choose to display full channel boxes or only trend lines using customizable styling.
Real-Time Volume Profiling
As long as the channel remains active, volume distribution is recalculated live on every bar.
PoC Projection
The PoC is drawn across the channel range, marking the highest-volume price level for each segment.
Directional Delta Coloring
Volume profiles automatically shift to bullish or bearish colors based on cumulative delta inside the channel.
Breakout Detection
Arrows highlight each transition into a new channel regime.
⯁ HOW TO USE
Spot trend changes using breakout arrows and the creation of new trend channels.
Gauge strength of a channel by examining the density and shape of the internal volume profile.
Use PoC levels as potential support/resistance interaction zones.
Validate momentum by checking whether volume delta shows bullish or bearish dominance.
Monitor channel edges to anticipate continuation or reversal setups.
⯁ CONCLUSION
The Volume Channel Flow indicator merges trend structure with volume analytics, providing a continuously adaptive picture of market flow.
It not only detects where trend phases begin and end, but also reveals what type of volume behavior shaped each segment, offering a deeper understanding of trend strength and directional pressure.

Volume Cluster Profile [VCP] (Zeiierman)█ Overview
Volume Cluster Profile (Zeiierman) is a volume profile tool that builds cluster-enhanced volume-by-price maps for both the current market window and prior swing segments.
Instead of treating the profile as a raw histogram only, VCP detects the dominant volume peaks (clusters) inside the profile, then uses a Gaussian spread model to “radiate” those peaks into surrounding price bins. This produces a smoother, more context-aware profile that highlights where volume is most meaningfully concentrated, not just where it happened to print.
On top of the live profile, VCP automatically records historical swing profiles between pivots, wraps each segment for clarity, and can project the most recent segment’s High/Low Value extensions (VA/LV) forward to the current bar to keep key structure visible as price evolves.
█ How It Works
⚪ 1) Profile Construction (Volume-by-Price)
VCP builds a volume profile histogram over a chosen window (current lookback, or a swing segment):
Range Scan
The script finds the full min → max price range inside the window.
Bin the Range
That range is divided into a user-defined number of Price Bins (rows). More bins = finer detail, but heavier computation.
Accumulate Volume into Bins
For each bar inside the window, the script takes the bar’s close price, determines which price bin it belongs to, and adds the bar’s volume to that bin.
float step = (maxPrice - minPrice) / binsCount
for i = 0 to barsToUse - 1
int b = f_clamp(int(math.floor((close - minPrice) / step)), 0, binsCount - 1)
volBins += volume
Result: volBins becomes a standard volume-by-price histogram (close-based binning).
⚪ 2) Cluster Detection (Finding Dominant Peaks)
Once the raw histogram is built, VCP identifies cluster centers as the most meaningful volume “hills”:
Local Peak Test
A bin becomes a cluster candidate if its volume is greater than or equal to its immediate neighbors (left/right).
Filter Weak Peaks
Peaks must also be above a basic activity threshold (relative to the average bin volume) to avoid noise.
bool isPeak = v >= left and v >= right
if isPeak and v > avgVol
array.push(clusterIdxs, b)
Keep the Best Peaks Only
If too many peaks exist, the script keeps only the strongest ones, capped by: Max Cluster Centers
Result: clusterIdxs = the set of dominant profile peaks (cluster centers).
⚪ 3) Cluster Enhancement (Gaussian Spread Model)
This is what makes VCP different from a raw profile.
Instead of using volBins directly, the script builds an enhanced profile where each cluster center influences nearby price bins using a Gaussian curve:
Distance from each bin to each cluster center is computed in “bin units”
A Gaussian weight is applied so that bins near the center receive stronger influence, while bins farther away decay smoothly.
Cluster Spread (sigma) controls how wide this influence reaches: low sigma produces tight, sharp clusters, while high sigma results in wider, smoother structure zones.
enhanced += centerV * math.exp(-(dist*dist) / (2.0 * clusterSigma * clusterSigma))
volBinsAI := enhanced / szClFinal
Result: volBinsAI = the cluster-enhanced volume value for each bin.
In practice, VCP turns the profile into a structure map of dominant volume concentrations, rather than a simple “where volume printed” histogram.
⚪ 4) POC from the Enhanced Profile
After enhancement:
The bin with the highest volBinsAI becomes the POC (Point of Control)
POC is plotted at the midpoint price of that bin
if volBinsAI > maxVol
maxVol := volBinsAI , pocBin := b
So the POC reflects the cluster-enhanced profile rather than the raw histogram.
█ How to Use
⚪ Read Cluster Structure (Default = 2 Clusters)
By default, the Volume Cluster Profile (VCP) is configured to detect up to 2 dominant volume clusters within the profile. These clusters represent price zones where the market accepted trading activity, not just where volume printed randomly.
⚪ When TWO Clusters Appear
When VCP detects two distinct clusters, it usually indicates:
Two competing areas of value
Ongoing auction between higher and lower acceptance zones
Treat each cluster as an acceptance zone
Expect slower price action and rotation inside clusters
Expect faster movement in the low-volume space between clusters
Use cluster-to-cluster movement as:
rotation targets
range boundaries
acceptance vs rejection tests
Typical behavior:
Price enters a cluster → stalls, consolidates, rotates
Price rejects at cluster edge → moves toward the opposite cluster
⚪ When ONLY ONE Cluster Appears
If VCP detects only one cluster, or if two clusters visually merge into one:
Volume is no longer split
The market has formed a single dominant value area
Price consensus is strong
Treat the cluster as the primary value anchor
Expect pullbacks and reactions around this zone
Bias becomes directional:
Above the cluster → bullish context
Below the cluster → bearish context
Inside the cluster → balance/chop
This structure often appears during clean trends or stable equilibria.
⚪ VA/LV Extensions
VCP projects two zones from the end of the most recent swing segment:
VA extension = the segment’s highest enhanced-volume bin (dominant zone)
LV extension = the segment’s lowest enhanced-volume bin (thin/weak zone)
A breakout of the VA extension signals acceptance and potential continuation. A retest of the VA or LV extension is used to confirm acceptance or rejection, while rejection from either zone often leads to rotation back toward value.
█ Settings
Cluster Volume Profile
Lookback Bars – how many recent bars build the current profile
Price Bins – profile resolution (more bins = more detail, heavier CPU)
Cluster Spread – Gaussian sigma; higher values widen/smooth cluster influence
Max Cluster Centers – cap on detected peaks used in enhancement
Historical Swing Cluster Volume Profile
Pivot Length – swing sensitivity (larger = fewer, broader segments)
Max Profiles – how many historical segments to retain
Profile Width – thickness of each historical profile
High & Low Value Area
Profile VA/LV – extend the last segment’s top-bin and low-bin zones forward
-----------------
Disclaimer
The content provided in my scripts, indicators, ideas, algorithms, and systems is for educational and informational purposes only. It does not constitute financial advice, investment recommendations, or a solicitation to buy or sell any financial instruments. I will not accept liability for any loss or damage, including without limitation any loss of profit, which may arise directly or indirectly from the use of or reliance on such information.
All investments involve risk, and the past performance of a security, industry, sector, market, financial product, trading strategy, backtest, or individual's trading does not guarantee future results or returns. Investors are fully responsible for any investment decisions they make. Such decisions should be based solely on an evaluation of their financial circumstances, investment objectives, risk tolerance, and liquidity needs.
