Wyckoff Trend Tracking Volatility StopWyckoff Trend Tracking Volatility Stop该指标为您提示小时、日与周的周期波动幅度,在无序的震荡中提示未来可能的波动幅度。
Buscar en scripts para "Volatility"

Current volatilityHello everyone.
Today an other small indicator that show the current volatility .
It works on all tickers ( crypto-currencies / others ) .
Method :
- ((high-low) * 100) / open
Hope it will be useful for you :)

Historical Volatility RankSame formulation of IVR but based on Historical Volatility instead.
Serves the same purpose as IV rank.

Volatility after Momentum/SMA crossChanged default value of average true range, to make changes in volatility more distinct.

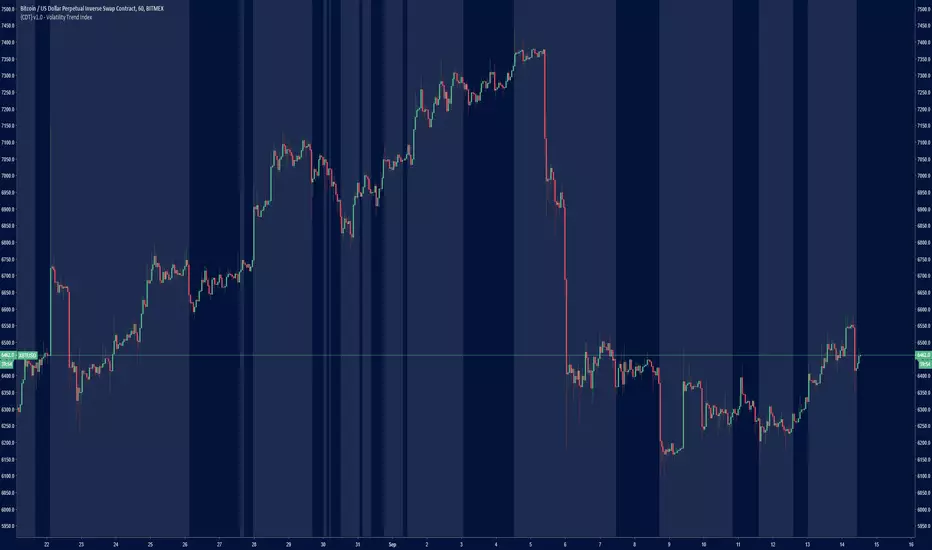
{CDT} v1.0 - Volatility Trend IndexHighlights areas where there is an increase in volatility and trend.
Does not determine direction, just good times to trade.
XBT Volatility Weighted Bottom Finder. [For Daily Charts]An update to:
Made it into and indicator.
v. 0.0.1
DESIGNED FOR DAILY CHARTS

SMART4TRADER-VOLATILITY ZONENEW !!! The indicator of "marginal" zones for the LOT market is calculated on the basis of volatility
НОВИНКА!!! Индикатор "маржинальных" зон для ЛОБОГО рынка рассчитывается на основе волатильности

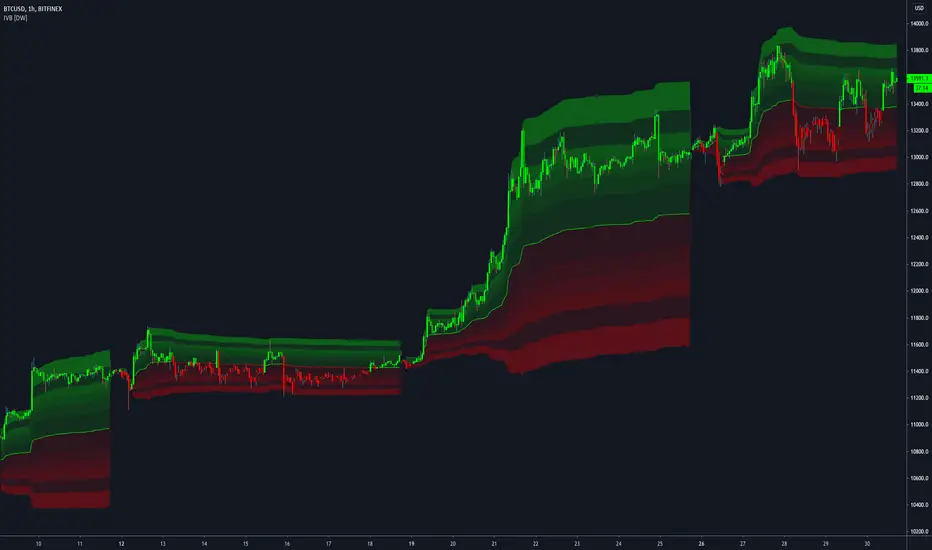
Interval Volatility Bands [DW]This is an experimental study that utilizes Volume Weighted Average Price or Time Weighted Average Price calculations, Bollinger Bands, and Fibonacci numbers to estimate volatility over a specified interval.
First, the basis is calculated by selecting:
-VWAP, which has the option to be calculated using real volume or tick volume
-TWAP, which has the option to be calculated using the standard method or exponential method
Next, standard deviation from the basis is calculated and multiplied by a specified expansion coefficient. The result is then added to and subtracted from the basis to calculate the high and low bands.
There are three band calculation methods to chosse from in this script:
-Standard, which uses the default calculations
-Average, which takes a cumulative average of standard deviation
-Hybrid, which takes the maximum of the standard and average standard deviation methods
Lastly, the high and low band ranges are multiplied by Fibonacci Percentages 23.6 - 78.6.
A custom color scheme with eight default presets to choose from is included.
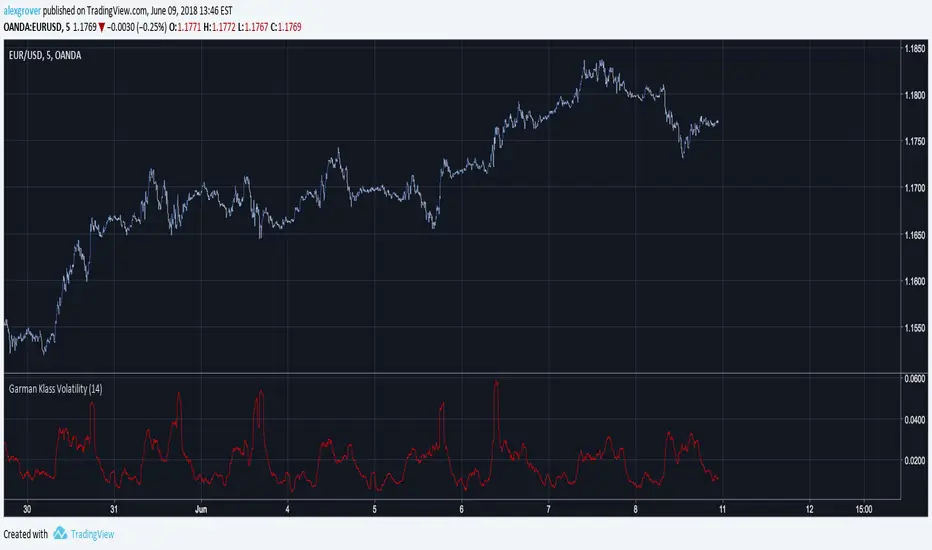
Garman Klass VolatilityThe Garman and Klass estimator for estimating historical volatility assumes Brownian motion with zero drift and no opening jumps (i.e. the opening = close of the previous period). This estimator is 7.4 times more efficient than the close-to-close estimator.
Periodic Volatility Channels [DW]This is an experimental study in which a geometric moving average is taken of price, then the range is multiplied by average annualized volatility based on the current trading timeframe and specified lookback, and by Fibonacci numbers 1 through 21.

Compression Bar - alphatradingdotin Volatility trading is the term used to describe trading the volatility of the price of an underlying instrument rather than the price itself. Volatility trading is simply buying and selling the expected future volatility of the instrument. There are many ways or rather innumerable ways to measure volatility one of the easiest is - a range of the price bars.
Volatility is often thought of as measuring risk or uncertainty. We are never sure where an asset is going to be at some point in the future, but a more volatile asset or underlying will have a wider spread of likely ending values, compared to a less volatile asset for the same time period.

Vol ROC Indicator [ASM]Volatility crush indy
TL;DR: Vol Crush = market up.
Fundamental theory:
1) Vol must rise to be crushed. Why does it rise? Big guys expect “risk event” and buy insurance (put options). They are smart ok, they may see risk that we don’t. Then supply / demand law (or just put-seller rises prices) –> puts get expensive -> VIX go up = SPY usually down because of that risk event looming.
2) If risk event doesn’t happen (off the table)… Insurance no longer needed right? AMEX:SPY bravely goes up = puts cheap again = VIX go down.
Technicals:
Option market makers’ (MM’s) mechanical flows. Gamm, GEX,VEX, etc.
When investor buys puts = VIX goes up -> MM shorts $SPY.
Then if Vol crushes, puts decrease in value -> MM buys back AMEX:SPY that he shorted earlier.
Specifics:
In this example instead of VIX, we use Nations taildex index. It shows price crash protection put options.
Green triangle. If TDEX > 20 puts expensive and market expects risk event. When TDEX falls below 20 then risk event cancelled or not so scary anymore. Green trianlge signals.
Green background. Again if TDEX > 20, then falls -15% within 2 days, you get a background signal.
Other variants.
You can change TDEX to VIX, VOLI. Use another overbought levels or use another vol change percentages.

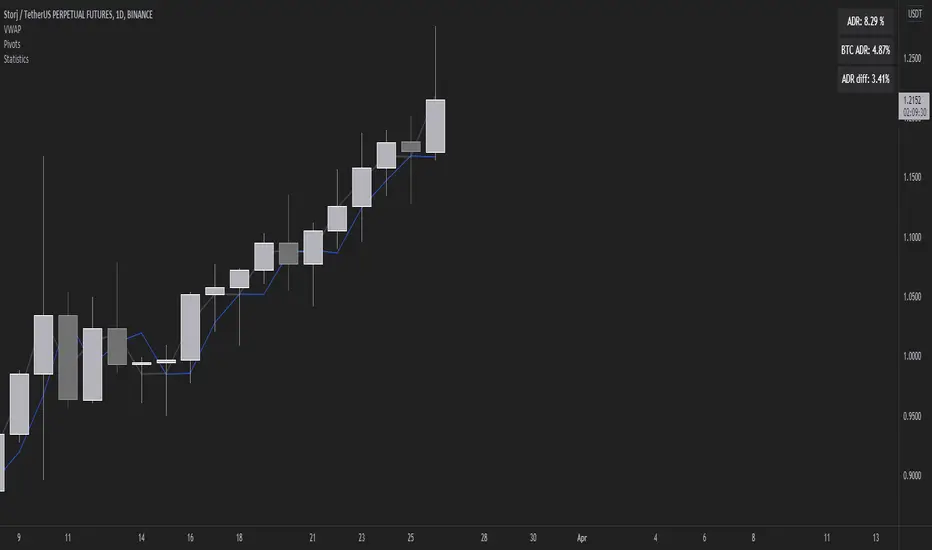
Volatility Stats compared to BTCMeasuring ADR we can find the difference between the daily range of BTC and the daily range of altcoins in order to find something more volatile (in percentage terms) to trade.


X:6Volatility Theory made easy. Bands are auto selecting based on the current trend. This is a work in progress.


