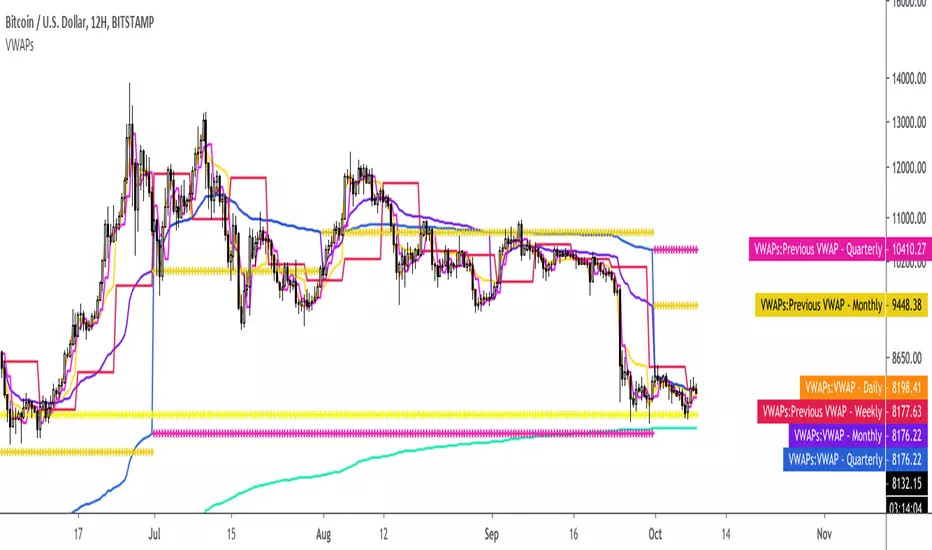
Institutional Rolling VWAPs • 3 lines + editable σ bands3 rolling vwaps, time stamped, same on htf and lft for high level execution
Buscar en scripts para "VWAP"

Anchored VWAPs + DeviationsAnchored VWAPS
*6 anchors to play with
*Pre-defined anchors from pivot points (May need manual adjustment due to timezone difference)
*Drag each anchor right from the screen instead of manually going to the settings>inputs
Deviations:
*Select from which anchor should the deviations start from
*Manually input the desired deviation value/ratio, can be customised
**Tips: To avoid clicking on the AVWAPS to enable the dragging line, just click on the title of the indicator.
***Work in progress


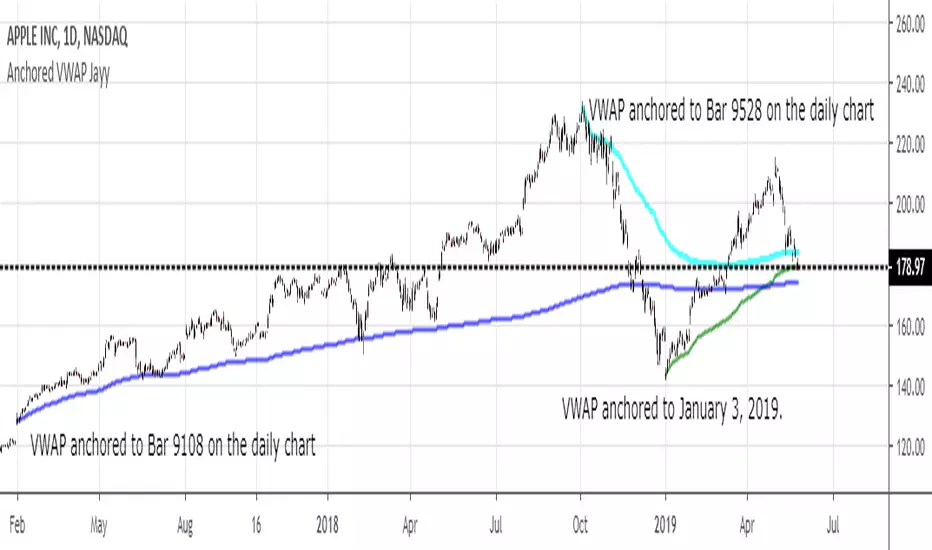
MIDAS VWAP Jayy his is just a bash together of two MIDAS VWAP scripts particularly AkifTokuz and drshoe.
I added the ability to show more MIDAS curves from the same script.
The algorithm primarily uses the "n" number but the date can be used for the 8th VWAP
I have not converted the script to version 3.
To find bar number go into "Chart Properties" select " "background" then select Indicator Titles and "Indicator values". When you place your cursor over a bar the first number you see adjacent to the script title is the bar number. Put that in the dialogue box midline is MIDAS VWAP . The resistance is a MIDAS VWAP using bar highs. The resistance is MIDAS VWAP using bar lows.
In most case using N will suffice. However, if you are flipping around charts inputting a specific date can be handy. In this way, you can compare the same point in time across multiple instruments eg first trading day of the year or an election date.
Adding dates into the dialogue box is a bit cumbersome so in this version, it is enabled for only one curve. I have called it VWAP and it follows the typical VWAP algorithm. (Does that make a difference? Read below re my opinion on the Difference between MIDAS VWAP and VWAP ).
I have added the ability to start from the bottom or top of the initiating bar.
In theory in a probable uptrend pick a low of a bar for a low pivot and start the MIDAS VWAP there using the support.
For a downtrend use the high pivot bar and select resistance. The way to see is to play with these values.
Difference between MIDAS VWAP and the regular VWAP
MIDAS itself as described by Levine uses a time anchored On-Balance Volume (OBV) plotted on a graph where the horizontal (abscissa) arm of the graph is cumulative volume not time. He called his VWAP curves Support/Resistance VWAP or S/R curves. These S/R curves are often referred to as "MIDAS curves".
These are the main components of the MIDAS chart. A third algorithm called the Top-Bottom Finder was also described. (Separate script).
Additional tools have been described in "MIDAS_Technical_Analysis"
Midas Technical Analysis: A VWAP Approach to Trading and Investing in Today’s Markets by Andrew Coles, David G. Hawkins
Copyright © 2011 by Andrew Coles and David G. Hawkins.
Denoting the different way in which Levine approached the calculation.
The difference between "MIDAS" VWAP and VWAP is, in my opinion, much ado about nothing. The algorithms generate identical curves albeit the MIDAS algorithm launches the curve one bar later than the VWAP algorithm which can be a pain in the neck. All of the algorithms that I looked at on Tradingview step back one bar in time to initiate the MIDAS curve. As such the plotted curves are identical to traditional VWAP assuming the initiation is from the candle/bar midpoint.
How did Levine intend the curves to be drawn?
On a reversal, he suggested the initiation of the Support and Resistance VVWAP (S/R curve) to be started after a reversal.
It is clear in his examples this happens occasionally but in many cases he initiates the so-called MIDAS S/R VWAP right at the reversal point. In any case, the algorithm is problematic if you wish to start a curve on the first bar of an IPO .
You will get nothing. That is a pain. Also in Levine's writings, he describes simply clicking on the point where a
S/R VWAP is to be drawn from. As such, the generally accepted method of initiating the curve at N-1 is a practical and sensible method. The only issue is that you cannot draw the curve from the first bar on any security, as mentioned without resorting to the typical VWAP algorithm. There is another difference. VWAP is launched from the middle of the bar (as per AlphaTrends), You can also launch from the top of the bar or the bottom (or anywhere for that matter). The calculation proceeds using the top or bottom for each new bar.
The potential applications are discussed in the MIDAS Technical Analysis book.
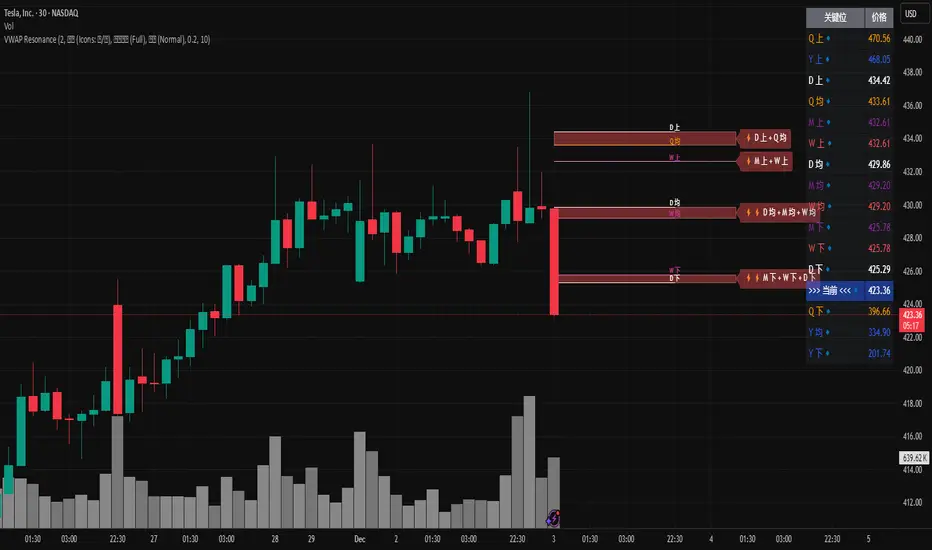
MTF VWAP Resonance [By Testeded]📈 MTF VWAP Resonance Hunter
(多级别 VWAP 共振捕猎者 - 终极版)
🇬🇧 English Description
1. Design Philosophy: The Institutional Edge
While typical indicators measure simple price action, VWAP (Volume Weighted Average Price) measures Value and Institutional Cost.
Professional traders and algorithms anchor their decisions to time-based benchmarks: Daily, Weekly, Monthly, and Quarterly. When prices return to these levels, they are testing the average cost basis of the market participants from that period.
The Logic of "Multi-Level Resonance" (MTF): A single VWAP line can be broken. However, when the Daily VWAP, Weekly Upper Band, and Quarterly Basis all overlap at the exact same price level, a "Market Consensus" is formed. This tool uses a background algorithm to detect these overlaps across 6 Timeframes (4H to Year) and visualizes them as "Resonance Boxes" instead of cluttering your chart with lines.
2. Key Features
⚓ Anchored VWAP Engine: Calculates VWAP + Standard Deviation Bands for 4H, Daily, Weekly, Monthly, Quarterly, and Yearly cycles simultaneously.
⚡ Smart Resonance Radar: Automatically detects when levels from different timeframes cluster together.
2-Line Confluence: ⚡ (Watch)
3-Line Confluence: ⚡⚡ (Strong)
4+ Line Confluence: ⚡⚡⚡ (Iron Wall)
🧘 Visual Modes (Zen / Focus):
Full Mode: Shows lines, dashboard, and resonance boxes.
Focus Mode: Hides lines, keeps dashboard and boxes.
Zen Mode: Hides EVERYTHING except the Resonance Boxes. Pure price action.
🏢 The Quarterly Line: Specifically designed to track the Quarterly VWAP, a critical level for institutional rebalancing and earnings cycles.
🎨 Customizable UI: Adjustable table text size (Small to Huge) and display styles.
3. How to Trade
Identify the Wall: Look for Red Boxes (Resistance) or Green Boxes (Support) with high star ratings (⚡⚡).
Read the Dashboard: Check the label (e.g., Q VWAP + W Lower). This tells you exactly who is defending this level (e.g., "Quarterly Buyers defending cost").
Sniper Entry: Wait for price to touch the Resonance Box. These levels often trigger sharp reversals or major breakouts.
🇨🇳 中文说明 (Chinese Description)
1. 设计哲学:多级别的全局视角
布林带反映的是波动率,而 VWAP(成交量加权平均价) 反映的是**“真金白银的持仓成本”**。
机构交易者和算法通常会锚定特定的时间周期进行交易:日内、周线、月线以及季度线。 “多级别共振”的逻辑: 单一周期的 VWAP 很容易失效。但是,当 日线 VWAP、周线上轨 和 季度线成本 在同一个价格位置重叠时,意味着短线、中线和长线资金在此处达成了**“价值共识”。 本指标通过后台算法,同时监控 6个时间周期 (4H - 年线),将这些重叠的价位转化为可视化的“共振框”**,提供一个多级别的全局视角。
2. 核心功能
⚓ 全周期锚定 VWAP:后台实时计算 4H, 日线, 周线, 月线, 季度线, 年线 的 VWAP 及其标准差轨道。
⚡ 智能共振雷达:自动检测不同周期的关键位重叠。
2线共振:⚡ (关注)
3线共振:⚡⚡ (强力支撑/阻力)
4线以上:⚡⚡⚡ (核弹级/铁壁共振)
🧘 显示模式 (Zen / Focus):
全面模式:显示所有线条 + 表格 + 共振框。
专注模式:隐藏线条,保留表格 + 共振框。
极简模式 (Zen):隐藏一切干扰,只显示共振框。像狙击手一样只看目标。
🏢 季度线增强:特别加入了 Quarterly VWAP (季度线),这是机构季末调仓和财报周期的重要防守线。
🎨 高度客制化:支持调整表格文字大小(从“小”到“巨大”),适配各种分辨率屏幕。
3. 实战用法
寻找“墙壁”:关注图表上的 红色共振框 (阻力) 或 绿色共振框 (支撑),尤其是带有 ⚡⚡ 标志的区域。
解读筹码:看一眼右上角的仪表盘标签(例如 Q VWAP + W Lower)。这意味着“季度级别的平均成本”与“周线级别的超卖线”重合,支撑力度极强。
警报交易:开启警报功能。不需要盯着屏幕,当价格撞上共振框时,指标会自动通知你。
Dual TF VWAP + ATR BandsDual TF VWAP + EMA (3×3 Outer Shells)
A precision volatility framework combining institutional VWAP structure with trend-anchored EMA logic.
🔍 Overview
Dual TF VWAP + EMA is a multi-layer trend and volatility system designed for traders who want clean directional context, controlled volatility boundaries, and a reliable method to spot pivots, expansions, compressions, and exhaustion points across any timeframe.
This tool blends:
Higher-Timeframe VWAP (50-period rolling)
Local EMA Midline (configurable)
3×3 ATR Outer Shells
Directional Color Coding
Signal-Ready Interaction Zones
Unlike traditional Bollinger Bands, Keltner channels, or static envelopes, this indicator adapts dynamically with both price and volume, giving deeper insight into how institutions accumulate, distribute, or expand trends.
🎯 What It Shows
1. Higher-Timeframe VWAP Midline
A 50-period Rolling VWAP that reflects where real volume-weighted control sits.
Perfect for reading:
Institutional trend bias
Value area reclaims
High-confidence mean reversions
High-probability trend continuations
2. Local EMA Trendline (Configurable)
A flexible EMA that acts as your local “risk-on/off” trend gauge.
You can use:
12 EMA for aggression
20 EMA for balanced trending
50 EMA for slower institutional rhythm
This EMA + VWAP pairing creates a powerful trend confirmation system.
3. Outer ATR Shells (U1–U3 / L1–L3)
Three upper and three lower ATR-based shells form a volatility map showing:
U1/L1: First reaction zones
U2/L2: Overextension zones
U3/L3: Exhaustion / blow-off tops / panic bottoms
The 3×3 shells tell you instantly whether price is:
Expanding
Compressing
Overextended
Reversing
Trending cleanly
📘 How To Use It — Practical Trading Logic
1. Trend Confirmation
Bullish: Price above VWAP + EMA rising + 12 EMA above U1
Bearish: Price below VWAP + EMA falling + 12 EMA under L1
2. Reversals
U3/L3 taps signal exhaustion
EMA rejection at U1/U2 confirms fading momentum
VWAP reclaim confirms the reversal
Trend resumes once EMA crosses back above/below VWAP
3. Momentum Acceleration
When price floats above the EMA without touching it and rides between:
EMA → U1 → U2
trend acceleration is underway (trip-wire continuation signal).
4. Safe Entries
EMA reclaim
VWAP reclaim after sweep
EMA → VWAP “compression and release”
Price floating above EMA with U1 break
5. Safe Exits
U2/U3 spikes
EMA flattening
EMA cross back under VWAP
Shell compression before trend shift
---Why This Tool Works---
Traditional bands are one-dimensional:
They react to price only.
This tool uses price + volatility + volume, so it shows:
Real trend strength
Institutional control zones
High-probability reversal points
Low-risk entry pockets
It performs exceptionally well across:
SPY / QQQ
Tech momentum
Small caps
Crypto
High-beta growth names
Summary
Dual TF VWAP + EMA (3×3 Outer Shells) is built for traders who want:
Clear trend direction
Accurate expansion/reversal signals
Dynamic institutional value zones
Multi-timeframe confidence
Clean volatility boundaries
A powerful companion for confirmation systems, breakout strategies, and liquidity-based execution.

Kalman VWAP Filter [BackQuant]Kalman VWAP Filter
A precision-engineered price estimator that fuses Kalman filtering with the Volume-Weighted Average Price (VWAP) to create a smooth, adaptive representation of fair value. This hybrid model intelligently balances responsiveness and stability, tracking trend shifts with minimal noise while maintaining a statistically grounded link to volume distribution.
If you would like to see my original Kalman Filter, please find it here:
Concept overview
The Kalman VWAP Filter is built on two core ideas from quantitative finance and control theory:
Kalman filtering — a recursive Bayesian estimator used to infer the true underlying state of a noisy system (in this case, fair price).
VWAP anchoring — a dynamic reference that weights price by traded volume, representing where the majority of transactions have occurred.
By merging these concepts, the filter produces a line that behaves like a "smart moving average": smooth when noise is high, fast when markets trend, and self-adjusting based on both market structure and user-defined noise parameters.
How it works
Measurement blend : Combines the chosen Price Source (e.g., close or hlc3) with either a Session VWAP or a Rolling VWAP baseline. The VWAP Weight input controls how much the filter trusts traded volume versus price movement.
Kalman recursion : Each bar updates an internal "state estimate" using the Kalman gain, which determines how much to trust new observations vs. the prior state.
Noise parameters :
Process Noise controls agility — higher values make the filter more responsive but also more volatile.
Measurement Noise controls smoothness — higher values make it steadier but slower to adapt.
Filter order (N) : Defines how many parallel state estimates are used. Larger orders yield smoother output by layering multiple one-dimensional Kalman passes.
Final output : A refined price trajectory that captures VWAP-adjusted fair value while dynamically adjusting to real-time volatility and order flow.
Why this matters
Most smoothing techniques (EMA, SMA, Hull) trade off lag for smoothness. Kalman filtering, however, adaptively rebalances that tradeoff each bar using probabilistic weighting, allowing it to follow market state changes more efficiently. Anchoring it to VWAP integrates microstructure context — capturing where liquidity truly lies rather than only where price moves.
Use cases
Trend tracking : Color-coded candle painting highlights shifts in slope direction, revealing early trend transitions.
Fair value mapping : The line represents a continuously updated equilibrium price between raw price action and VWAP flow.
Adaptive moving average replacement : Outperforms static MAs in variable volatility regimes by self-adjusting smoothness.
Execution & reversion logic : When price diverges from the Kalman VWAP, it may indicate short-term imbalance or overextension relative to volume-adjusted fair value.
Cross-signal framework : Use with standard VWAP or other filters to identify convergence or divergence between liquidity-weighted and state-estimated prices.
Parameter guidance
Process Noise : 0.01–0.05 for swing traders, 0.1–0.2 for intraday scalping.
Measurement Noise : 2–5 for normal use, 8+ for very smooth tracking.
VWAP Weight : 0.2–0.4 balances both price and VWAP influence; 1.0 locks output directly to VWAP dynamics.
Filter Order (N) : 3–5 for reactive short-term filters; 8–10 for smoother institutional-style baselines.
Interpretation
When price > Kalman VWAP and slope is positive → bullish pressure; buyers dominate above fair value.
When price < Kalman VWAP and slope is negative → bearish pressure; sellers dominate below fair value.
Convergence of price and Kalman VWAP often signals equilibrium; strong divergence suggests imbalance.
Crosses between Kalman VWAP and the base VWAP can hint at shifts in short-term vs. long-term liquidity control.
Summary
The Kalman VWAP Filter blends statistical estimation with market microstructure awareness, offering a refined alternative to static smoothing indicators. It adapts in real time to volatility and order flow, helping traders visualize balance, transition, and momentum through a lens of probabilistic fair value rather than simple price averaging.

Technical Summary VWAP | RSI | VolatilityTechnical Summary VWAP | RSI | Volatility
The Quantum Trading Matrix is a multi-dimensional market-analysis dashboard designed as an educational and idea-generation tool to help traders read price structure, participation, momentum and volatility in one compact view. It is not an automated execution system; rather, it aggregates lightweight “quantum” signals — VWAP position, momentum oscillator behaviour, multi-EMA trend scoring, volume flow and institutional activity heuristics, market microstructure pivots and volatility measures — and synthesizes them into a single, transparent score and signal recommendation. The primary goal is to make explicit why a given market looks favourable or unfavourable by showing the individual ingredients and how they combine, enabling traders to learn, test and form rules based on observable market mechanics.
Each module of the matrix answers a distinct market question. VWAP and its percentage distance indicate whether the current price is trading above or below the intraday volume-weighted average — a proxy for intraday institutional control and value. The quantum momentum oscillator (fast and slow EMA difference scaled to percent) captures short-to-intermediate momentum shifts, providing a quickly responsive view of directional pressure. Multi-EMA trend scoring (8/21/50) produces a simple, transparent trend score by counting conditions such as price above EMAs and cross-EMAs ordering; this score is used to categorize market trend into descriptive buckets (e.g., STRONG UP, WEAK UP, NEUTRAL, DOWN). Volume analysis compares current volume to a recent moving average and computes a Z-score to detect spikes and unusual participation; additional buy/sell pressure heuristics (buyingPressure, sellingPressure, flowRatio) estimate whether upside or downside participation dominates the bar. Institutional activity is approximated by flagging large orders relative to volume baseline (e.g., volume > 2.5× MA) and estimating a dark pool proxy; this is a heuristic to highlight bars that likely had large players involved.
The dashboard also performs market-structure detection with small pivot windows to identify recent local support/resistance areas and computes price position relative to the daily high/low (dailyMid, pricePosition). Volatility is measured via ATR divided by price and bucketed into LOW/NORMAL/HIGH/EXTREME categories to help you adapt stop sizing and expectational horizons. Finally, all these pieces feed an interpretable scoring function that rewards alignment: VWAP above, strong flow ratio, bullish trend score, bullish momentum, and favorable RSI zone add to the overall score which is presented as a 0–100 metric and a colored emoji indicator for at-a-glance assessment.
The mashup is purposeful: each indicator covers a failure mode of the other. For example, momentum readings can be misleading during volatility spikes; VWAP informs whether institutions are on the bid or offer; volume Z-score detects abnormal participation that can validate a breakout; multi-EMA score mitigates single-EMA whipsaws by requiring a combination of price/EMA conditions. Combining these signals increases information content while keeping each component explainable — a key compliance requirement. The script intentionally emphasizes transparency: when it shows a BUY/SELL/HOLD recommendation, the dashboard shows the underlying sub-components so a trader can see whether VWAP, momentum, volume, trend or structure primarily drove the score.
For practical use, adopt a clear workflow: (1) check the matrix score and read the component tiles (VWAP position, momentum, trend and volume) to understand the drivers; (2) confirm market-structure support/resistance and pricePosition relative to the daily range; (3) require at least two corroborating components (for example, VWAP ABOVE + Momentum BULLISH or Volume spike + Trend STRONG UP) before considering entries; (4) use ATR-based stops or daily pivot distance for stop placement and size positions such that the trade risks a small, pre-defined percent of capital; (5) for intraday scalps shorten holding time and tighten stops, for swing trades increase lookback lengths and require multi-timeframe (higher TF) agreement. Treat the matrix as an idea filter and replay lab: when an alert triggers, replay the bars and observe which components anticipated the move and which lagged.
Parameter tuning matters. Shortening the momentum length makes the oscillator more sensitive (useful for scalping), while lengthening it reduces noise for swing contexts. Volume profile bars and MA length should match the instrument’s liquidity — increase the MA for low-liquidity stocks to reduce false institutional flags. The trend multiplier and signal sensitivity parameters let you calibrate how aggressively the matrix counts micro evidence into the score. Always backtest parameter sets across multiple periods and instruments; run walk-forward tests and keep a simple out-of-sample validation window to reduce overfitting risk.
Limitations and failure modes are explicit: institutional flags and dark-pool estimates are heuristics and cannot substitute for true tape or broker-level order flow; volume split by price range is an approximation and will not perfectly reflect signed volume; pivot detection with small windows may miss larger structural swings; VWAP is typically intraday-centric and less meaningful across multi-day swing contexts; the score is additive and may not capture non-linear relationships between features in extreme market regimes (e.g., flash crashes, circuit breaker events, or overnight gaps). The matrix is also susceptible to false signals during major news releases when price and volume behavior dislocate from typical patterns. Users should explicitly test behavior around earnings, macro data and low-liquidity periods.
To learn with the matrix, perform these experiments: (A) collect all BUY/SELL alerts over a 6-month period and measure median outcome at 5, 20 and 60 bars; (B) require additional gating conditions (e.g., only accept BUY when flowRatio>60 and trendScore≥4) and compare expectancy; (C) vary the institutional threshold (2×, 2.5×, 3× volumeMA) to see how many true positive spikes remain; (D) perform multi-instrument tests to ensure parameters are not tuned to a single ticker. Document every test and prefer robust, slightly lower returns with clearer logic rather than tuned “optimal” results that fail out of sample.
Originality statement: This script’s originality lies in the curated combination of intraday value (VWAP), multi-EMA trend scoring, momentum percent oscillator, volume Z-score plus buy/sell flow heuristics and a compact, interpretable scoring system. The script is not a simple indicator mashup; it is a didactic ensemble specifically designed to make internal rationale visible so traders can learn how each market characteristic contributes to actionable probability. The tool’s novelty is its emphasis on interpretability — showing the exact contributing signals behind a composite score — enabling reproducible testing and educational value.
Finally, for TradingView publication, include a clear description listing the modules, a short non-technical summary of how they interact, the tunable inputs, limitations and a risk disclaimer. Remove any promotional content or external contact links. If you used trademark symbols, either provide registration details or remove them. This transparent documentation satisfies TradingView’s requirement that mashups justify their composition and teach users how to use them.
Quantum Trading Matrix — multi-factor intraday dashboard (educational use only).
Purpose: Combines intraday VWAP position, a fast/slow EMA momentum percent oscillator, multi-EMA trend scoring (8/21/50), volume Z-score and buy/sell flow heuristics, pivot-based microstructure detection, and ATR-based volatility buckets to produce a transparent, componentized market score and trade-idea indicator. The mashup is intentional: VWAP identifies intraday value, momentum detects short bursts, EMAs provide structural trend bias, and volume/flow confirm participation. Signals require alignment of at least two components (for example, VWAP ABOVE + Momentum BULLISH + positive flow) for higher confidence.
Inputs: momentum period, volume MA/profile length, EMA configuration (8/21/50), trend multiplier, signal sensitivity, color and display options. Use shorter momentum lengths for scalps and longer for swing analysis. Increase volume MA for thinly traded instruments.
Limitations: Institutional/dark-pool estimates and flow heuristics are approximations, not actual exchange tape. VWAP is intraday-focused. Expect false signals during major news or low-liquidity sessions. Backtest and paper-trade before applying real capital.
Risk Disclaimer: For education and analysis only. Not financial advice. Use proper risk management. The author is not responsible for trading losses.
________________________________________
Risk & Misuse Disclaimer
This indicator is provided for education, analysis and idea generation only. It is not investment or financial advice and does not guarantee profits. Institutional activity flags, dark-pool estimates and flow heuristics are approximations and should not be treated as exchange tape. Backtest thoroughly and use demo/paper accounts before trading real capital. Always apply appropriate position sizing and stop-loss rules. The author is not responsible for any trading losses resulting from the use or misuse of this tool.
________________________________________
Risk Disclaimer: This tool is provided for education and analysis only. It is not financial advice and does not guarantee returns. Users assume all risk for trades made based on this script. Back test thoroughly and use proper risk management.

NY Anchored VWAP and Auto SMANY Anchored VWAP and Auto SMA
This script is a versatile trading indicator for the TradingView platform that combines two powerful components: a New York-anchored Volume-Weighted Average Price (VWAP) and a dynamic Simple Moving Average (SMA). Designed for traders who utilize VWAP for intraday trend analysis, this tool provides a clear visual representation of average price and volatility-adjusted moving averages, generating automated alerts for key crossover signals.
Indicator Components
1. NY Anchored VWAP
The VWAP is a crucial tool that represents the average price of a security adjusted for volume. This version is "anchored" to the start of the New York trading session, resetting at the beginning of each new session. This provides a clean, session-specific anchor point to gauge market sentiment and trend. The VWAP line changes color to reflect its slope:
Green: When the VWAP is trending upwards, indicating a bullish bias.
Red: When the VWAP is trending downwards, indicating a bearish bias.
2. Auto SMA
The Auto SMA is a moving average with a unique twist: its lookback period is not fixed. Instead, it dynamically adjusts based on market volatility. The script measures volatility using the Average True Range (ATR) and a Z-Score calculation.
When volatility is expanding, the SMA's length shortens, making it more sensitive to recent price changes.
When volatility is contracting, the SMA's length lengthens, smoothing out the price action to filter out noise.
This adaptive approach allows the SMA to react appropriately to different market conditions.
Suggested Trading Strategy
This indicator is particularly effective when used on a one-minute chart for identifying high-probability trade entries. The core of the strategy is to trade the crossover between the VWAP and the Auto SMA, with confirmation from a candle close.
The strategy works best when the entry signal aligns with the overall bias of the higher timeframe market structure. For example, if the daily or 4-hour chart is in an uptrend, you would look for bullish signals on the one-minute chart.
Bullish Entry Signal: A potential entry is signaled when the VWAP crosses above the Auto SMA, and is confirmed when the one-minute candle closes above both the VWAP and the SMA. This indicates a potential continuation of the bullish momentum.
Bearish Entry Signal: A potential entry is signaled when the VWAP crosses below the Auto SMA, and is confirmed when the one-minute candle closes below both the VWAP and the SMA. This indicates a potential continuation of the bearish momentum.
The built-in alerts for these crossovers allow you to receive notifications without having to constantly monitor the charts, ensuring you don't miss a potential setup.

Advanced VWAP Position SizerBelow is a TradingView description for the "Advanced VWAP Position Sizer" script, written in a clear and concise manner suitable for the platform's indicator description field. The description highlights the script's purpose, features, and usage instructions, tailored to its functionality based on the provided code.
---
### Advanced VWAP Position Sizer
**Category:** Custom Indicators
**Type:** Overlay
The **Advanced VWAP Position Sizer** is a powerful trading tool that combines the Volume Weighted Average Price (VWAP) with dynamic position sizing based on your portfolio risk tolerance. This indicator calculates the VWAP with customizable anchor periods and band levels, then determines the optimal trade size to ensure the full distance between the VWAP centerline and a selected band does not exceed 0.3% of your daily portfolio balance. Ideal for day traders seeking to manage risk effectively while leveraging VWAP-based strategies.
#### Key Features:
- **Customizable VWAP**: Adjust the anchor period (Session, Week, Month, Quarter, Year, Decade, Century, Earnings, Dividends, Splits) to reset the VWAP calculation based on your preferred timeframe.
- **Band Calculations**: Displays upper and lower bands using Standard Deviation or Percentage-based multipliers (1.0, 2.0, 3.0), with options to show/hide each band level.
- **Percentage Difference**: Calculates the percentage difference between the VWAP centerline and the selected band (Upper or Lower), automatically chosen based on trade direction (Long/Short).
- **Position Sizing**: Determines the number of shares to trade based on a user-defined portfolio balance and a 0.3% risk limit, accounting for stop loss distance, commissions, and slippage.
- **Interactive Table**: Displays real-time data including Risk per Trade, VWAP-to-Band Distance, Band % Difference, Risk per Share, Shares, and Position Value, with black text for readability.
- **Flexible Entry**: Supports manual entry price or uses the current price, with customizable stop levels relative to the band distance.
#### How to Use:
1. **Input Your Settings**:
- Set your daily **Portfolio Balance** (e.g., $50,000) to reflect your current capital.
- Adjust the **Risk % of Portfolio** (default 0.3%) to define your risk tolerance.
- Choose your **Direction** (Long or Short) and **Band** (Upper, Lower, or Auto by Direction).
- Select **Entry Price** mode (Current Price or Manual) and set a manual entry if needed.
- Configure **VWAP Settings** (Anchor Period, Source, Offset) and **Bands Settings** (Calculation Mode, Multipliers).
- Add **Commission** and **Slippage** per share, and enable **Fractional Shares** if desired.
- Position the table (Top Right, Bottom Right, Top Left, Bottom Left).
2. **Interpret the Table**:
- **Risk / Trade**: Total risk amount based on your portfolio and risk percentage.
- **VWAP→Band Dist**: Dollar distance from VWAP to the selected band.
- **Band % Diff**: Percentage difference between VWAP and the band, ensuring it stays within 0.3% of your portfolio.
- **Risk / Share**: Risk per share including stop distance and costs.
- **Shares**: Recommended number of shares to trade.
- **Position $**: Total position value based on shares and entry price.
3. **Trading Strategy**:
- Use the VWAP as a trend indicator and the bands for potential entry/exit points.
- Adjust your position size to align with the calculated shares, ensuring your risk does not exceed 0.3% of your portfolio balance.
- Monitor the **Entry** and **Stop** plots for trade execution and risk management.
#### Notes:
- This indicator overlays on the price chart and requires volume data to function correctly.
- The table updates on the last bar and may not display on timeframes (1D or above) if "Hide VWAP on 1D or Above" is enabled.
- Ensure your portfolio balance is updated daily to reflect accurate risk calculations.
- Compatible with Pine Script v6; adjust to v5 if compatibility issues arise.
**Disclaimer**: This is not financial advice. Consult a financial advisor and avoid sharing personal identifiable information.

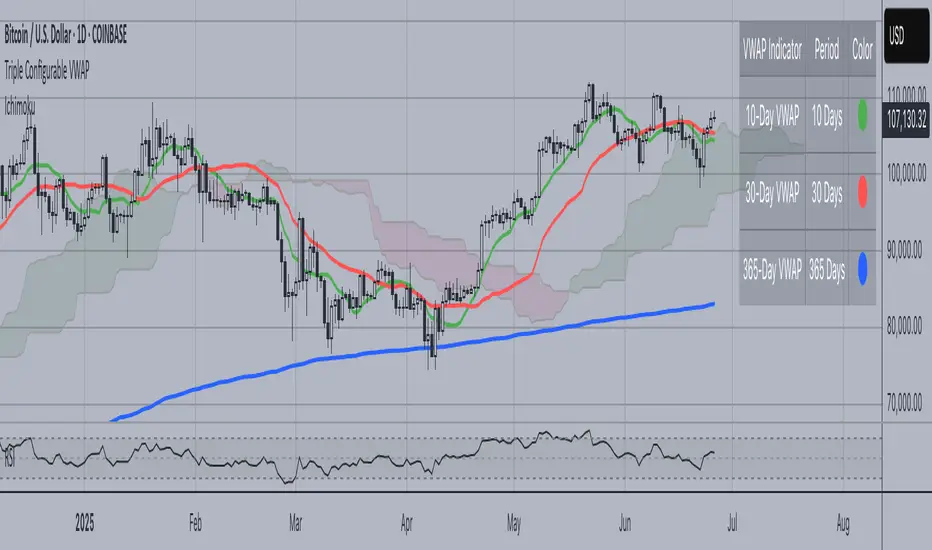
Triple Configurable VWAPTriple Configurable VWAP Indicator
This advanced VWAP (Volume Weighted Average Price) indicator displays three independently configurable VWAP lines on your chart, providing multiple timeframe perspectives for better trading decisions.
Key Features:
• Three Customizable VWAP Periods: Configure each VWAP independently with periods ranging from 1 to 365 days
Default: 10-day (Green), 30-day (Red), 365-day (Blue)
• Dynamic Visual Elements:
Color-coded lines for easy identification
Smart labels at the current price level with matching colors
Contrasting text colors for optimal readability
• Interactive Information Table:
Toggle on/off display
Repositionable to any corner or side of the chart
Shows each VWAP period with corresponding color indicators
Larger, easy-to-read font size
• Professional Calculation Method:
Uses daily timeframe data for accurate VWAP calculations
Anchored VWAP starting from your specified lookback periods
Proper volume weighting for institutional-grade accuracy
Use Cases:
Short-term Trading: 10-day VWAP for recent price action analysis
Medium-term Analysis: 30-day VWAP for monthly trend assessment
Long-term Perspective: 365-day VWAP for yearly institutional levels
Perfect for traders who need multiple VWAP timeframes simultaneously to identify key support/resistance levels, trend direction, and institutional price points across different time horizons.
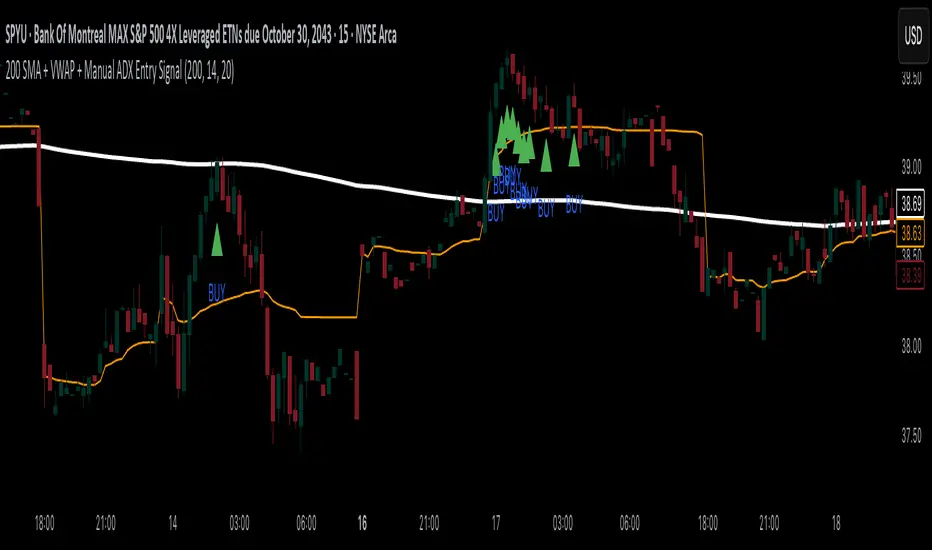
200 SMA + VWAP + Manual ADX Entry Signal200 SMA + VWAP + Manual ADX Entry Signal – Indicator Description
This custom indicator is designed for trend-following intraday traders who want a powerful, rules-based entry confirmation system. It combines three proven tools—the 200-period Simple Moving Average (SMA), Volume-Weighted Average Price (VWAP), and a manually coded ADX (Average Directional Index)—to identify high-probability long entries in strong, directional markets.
By filtering trades through a combination of trend direction, mean-reversion reference, and momentum strength, this indicator helps traders avoid false breakouts, whipsaws, and low-quality setups. It’s particularly well-suited for traders using 15-minute charts, leveraged ETFs, or high-beta stocks, where precision entries and trend confirmation are critical to consistent profitability.
⸻
✅ What This Indicator Does
This indicator visually displays:
• The 200-period SMA (orange line) – a long-term trend filter.
• The VWAP (blue line) – a dynamic intraday price average used by institutions.
• A buy signal triangle below the price bar – when all bullish criteria are met.
• It also includes an alert condition so traders can be notified when a new buy signal appears in real time.
Behind the scenes, the indicator calculates trend and strength conditions and plots a BUY signal only when all three tools agree that a bullish move is in play.
⸻
🔍 The Three-Pillar Entry System
1. 200 SMA Filter – Defining Market Bias
The 200 SMA is a widely used institutional benchmark that represents long-term trend direction. In this indicator:
• A trade is only considered valid if price is above the 200 SMA.
• This helps eliminate trades in downtrending or range-bound markets.
• It ensures that entries are aligned with broader directional bias.
By filtering out trades below the 200 SMA, you instantly remove a majority of low-probability setups and whipsaw environments.
⸻
2. VWAP – Institutional Mean Price Anchor
VWAP (Volume-Weighted Average Price) is often used by hedge funds and algorithmic systems to judge whether price is considered “expensive” or “cheap” within a given trading session.
• This version of VWAP is anchored to the current intraday session.
• Trades are only considered valid if price is above the VWAP, which shows market consensus is favoring the upside.
• VWAP provides both confirmation and support levels, helping ensure your entry isn’t into overextended territory.
By combining the 200 SMA and VWAP filters, the indicator ensures that trades are only taken when price is strong on both the macro and micro timeframes.
⸻
3. ADX – Confirming Momentum Strength
ADX (Average Directional Index) is used to measure trend strength without regard to direction. However, TradingView has limited functionality with the ta.adx() call in some environments, so this script includes a custom-coded version of ADX that follows standard Wilder’s smoothing and directional movement logic.
• A BUY signal only triggers if ADX is above a user-defined threshold (default is 20) and rising from the previous bar.
• This means not only is the market trending — but the trend is strengthening.
This final filter prevents entries in chop or decaying rallies, and ensures you’re catching the strongest part of a move, not the tail end.
⸻
⚙️ Logic Summary
A BUY signal is plotted when:
• Price > 200 SMA ✅
• Price > VWAP ✅
• ADX > 20 and rising ✅
Only when all three conditions are true does the indicator plot a green triangle below the price bar.
This visual simplicity makes it ideal for fast trade decisions, and the alert function allows hands-free monitoring during busy sessions.
⸻
🧠 Recommended Use
This indicator works best on:
• 15-minute to 1-hour charts
• Intraday leveraged ETFs (e.g., TQQQ, SPYU, SQQQ)
• Trend-following strategies
• Breakout continuation trades
⸻
📉 Limitations
• This is a long-only system by design. If you want to trade short, you’ll need to invert the logic (e.g., price < 200 SMA, price < VWAP, ADX > threshold).
• It doesn’t generate exit signals. You should pair this with your own take-profit or trailing stop strategy.
• While it works great for momentum entries, it may underperform in range-bound or news-driven chop markets.
⸻
🛠️ Settings Customization
• SMA Length: default is 200; adjust for faster or slower trend confirmation.
• ADX Length: default is 14; shorter periods = more sensitive, longer = smoother.
• ADX Threshold: default is 20; raise to 25 or 30 to only catch very strong moves.
These settings give you flexibility to match the indicator to your trading style.
⸻
🚀 Final Thoughts
The 200 SMA + VWAP + Manual ADX Entry Signal is a battle-tested, rule-based tool to help you:
• Enter only when the trend, mean, and momentum align
• Avoid fakeouts and poor risk-reward entries
• Automate part of your setup process without overcomplication
This is the kind of filter used by professional traders to reduce screen time and improve trade quality. If you’re looking to build confidence in your intraday trading with clear, logical entries — this indicator will help you stay consistent and systematic.
Happy trading!
WAVES II by WestmontWAVES II by Westmont is a next-generation evolution of the original WAVES indicator, designed to offer improved responsiveness , enhanced functionality , and clearer visual clarity . By incorporating advanced momentum filtering and smoother transitions in the VWAP (Volume Weighted Average Price) area , WAVES II provides users with a more dynamic and actionable tool for market analysis.
This indicator introduces new methodologies , visual enhancements , and advanced forecasting capabilities , making it an ideal tool for traders seeking faster insights and sharper reactions to market movements.
Key Features of WAVES II
WaveTrend Calculation
The core of WAVES II is the WaveTrend , which is calculated using the HLC3 (High + Low + Close) price .
The WaveTrend is smoothed through two processes:
EMA (Exponential Moving Average): Applied to the HLC3 to capture faster price movements .
SMA (Simple Moving Average): Applied to the first wave to smooth out shorter-term fluctuations.
VWAP Area Crossover
WAVES II calculates the VWAP area by subtracting the second wave from the first .
The indicator detects when this VWAP area crosses key levels :
Bullish Signal : When the VWAP area crosses upward with positive momentum.
Bearish Signal : When the VWAP area crosses downward with negative momentum.
Momentum Detection
Momentum is calculated by measuring the price change between bars and smoothing this change over a short period .
Positive momentum signals increasing price movement , while negative momentum indicates a slowing or reversing trend .
This momentum detection filters out weaker price movements , highlighting only the significant trend shifts and giving users confirmation of market movements.
Visual Enhancements
Glowing VWAP Lines : The VWAP area is plotted with multiple layers of colors, gradually fading in opacity. This highlights areas of strong price movement and reversals.
Fading Gradient Effect : The VWAP line is filled with a gradient that adjusts its opacity based on the distance from the center line, visually indicating market strength and reinforcing key levels.
VWAP Projection
WAVES II projects the VWAP area forward , based on its recent slope, to offer a forward-looking view of potential price movements. This projection helps traders anticipate short-term market direction and react faster to potential trend changes.
Key Differences Between WAVES and WAVES II
Smoothing and WaveTrend Calculation Adjustments
WAVES : Uses fixed smoothing parameters for WaveTrend calculation, resulting in a relatively stable and slower response to market changes.
The first smoothing (wavetrend1) uses an EMA with a fixed length.
The second smoothing (wavetrend2) uses a simple moving average (SMA) with a fixed length.
WAVES II : Introduces more responsive settings like smoothing_length, deviation_length, first_wave_length, and second_wave_length for faster reaction times to market movements. These adjustments make WAVES II ideal for traders who need quicker feedback and sharper market transitions.
Momentum Detection
WAVES : Does not incorporate momentum-based logic, relying only on the VWAP area and its relationship to historical values.
WAVES II : Adds momentum detection, which calculates the difference between current and previous price movements, smoothed over a defined period. This helps identify bullish and bearish trends more accurately, providing additional confirmation and improving signal reliability.
VWAP Area Cross Detection
WAVES : Detects VWAP area crossovers based on recent high and low values.
WAVES II : Refines cross detection by incorporating a momentum filter. A Bullish cross is confirmed when the VWAP area crosses upwards with positive momentum, while a Bearish cross is confirmed when it crosses down with negative momentum. This dual-condition approach enhances signal accuracy and offers better context for trade decisions.
Plotting and Visualization
WAVES : Plots the VWAP line, center line, and uses color transitions for VWAP area fills to represent market conditions.
WAVES II : Introduces a multi-layer glow effect for the VWAP line, with varying opacities, creating a visually dynamic experience. The gradient glow effect provides a clearer representation of market strength and proximity to the center line, making it easier to spot market shifts and interpret momentum at a glance.
Why WAVES II Was Created as a Separate Indicator
New Features and Functionality :
WAVES II introduces key features like momentum detection and VWAP projections , which significantly alter how the indicator operates. These are not minor updates but represent a shift in how the tool functions , providing faster and more detailed insights for traders. WAVES II gives traders sharper market feedback with improved responsiveness to price changes.
Targeted for Different Trading Styles :
WAVES II is aimed at traders who need faster reactions and more dynamic , reliable signals . While WAVES remains a solid choice for those who prefer a more stable, traditional approach, WAVES II caters to traders who require quicker feedback and more granular market insights. By offering both tools, traders can select the one that aligns with their style, whether that’s for faster decision-making or a more conservative approach .
Visual Clarity :
The enhanced visual effects in WAVES II, such as the multi-layer glow and gradient VWAP transitions , offer greater clarity and a more intuitive charting experience . These visual improvements allow traders to quickly interpret changes in the market, making WAVES II a more effective tool for detailed and actionable market analysis.
Clear Value for Traders :
WAVES II brings significant enhancements over the original WAVES, including more advanced features , faster momentum detection , and better visual representation of market dynamics . This makes WAVES II a more powerful tool for traders seeking dynamic market insights . It is an ideal choice for those who need quicker and more reliable feedback than traditional tools can provide.
How to Use WAVES II
Users can watch for WaveTrend crossovers (when the line crosses 0) and VWAP area dots (bullish or bearish) to spot potential buy or sell signals.
Users can use momentum to confirm signals, helping you identify whether the market is gaining or losing strength.
WAVES II offers advanced features , faster responsiveness , and clearer visuals compared to the original WAVES indicator. By introducing momentum detection and refining the handling of VWAP crossovers , WAVES II enhances the overall trading experience, providing more dynamic, actionable insights for traders. While WAVES remains an excellent tool for those who prefer a simpler, more stable approach, WAVES II is designed for traders who seek a more detailed , faster-reacting tool for market analysis.

WAVES by WestmontWAVES by Westmont is a trading indicator that combines WaveTrend analysis with VWAP dynamics to provide traders with insights into market momentum , volatility , and trends . Users can rely on this tool to help identify market shifts , potential trend reversals , and momentum changes . The script integrates custom logic with standard public domain functions to enhance signal accuracy and market analysis.
WAVES builds on familiar tools, such as the Exponential Moving Average ( EMA ), Simple Moving Average ( SMA ), and basic fractal analysis , to create a comprehensive view of price behavior. Users can interpret this indicator to gain a clearer picture of market conditions, utilizing both WaveTrend’s trend-following signals and VWAP’s volume-weighted price reference.
How the Components Work Together:
Divergence Functions
WAVES uses the bottom_fractal and bot_fractal functions to detect local highs and lows, helping identify potential reversal points in the market. These functions work alongside the WaveTrend and VWAP analysis to confirm or challenge potential turning points.
WaveTrend Calculation
ESA (Exponential Smoothing Average): Provides a smoothed base for price direction.
DE (Deviation): Measures volatility, indicating how much price is fluctuating.
CI (Commodity Channel Index): Tracks cycles between price and the smoothed ESA, identifying potential price shifts.
These values are smoothed using EMA and SMA for greater stability. Users can rely on these smoothed signals to reduce noise and improve trend clarity.
VWAP Area Calculation
Users can observe the VWAP area , calculated from the difference between two WaveTrend lines ( wavetrend1 and wavetrend2 ), to understand market equilibrium in relation to volume-weighted price action. The VWAP area provides a clearer picture of price movement relative to market volume.
Signal Dots and Visualization
Bullish Signals: Users can look for blue dots when the VWAP area crosses upwards , indicating that price is above the VWAP and suggesting upward momentum .
Bearish Signals: Users can look for purple dots when the VWAP area crosses downwards , indicating that price is below the VWAP and suggesting downward momentum .
Smooth VWAP Gradient Fill
Users can visually track momentum using the smooth gradient fill between the VWAP plot and the center line . The fill color changes from blue ( positive momentum ) to purple ( negative momentum ), and turquoise ( neutral ), helping traders quickly assess market sentiment and trend strength.
How to Use WAVES by Westmont :
Bullish Momentum : Users can look for blue dots when the VWAP area crosses upward . This suggests the market is in an uptrend as price moves above the VWAP , potentially indicating upward price action .
Bearish Momentum : Users can look for purple dots when the VWAP area crosses downward . This suggests the market is in a downtrend as price moves below the VWAP , indicating potential for downward price action .
Neutral Market Conditions : Users can observe when the VWAP area remains near the center line ( turquoise ), indicating market consolidation or indecision .
Code Usage :
The indicator uses TradingView’s built-in functions (EMA, SMA, and fractals), which are well-optimized for standard technical analysis. These functions serve as a foundation for the indicator’s calculations. Users can trust that the public domain functions ensure efficient performance, while the added customizations enhance signal quality by integrating WaveTrend and VWAP dynamics.

RVMM IndicatorRVMM Indicator
RVMM Indicator combines four indicators: RSI, VWAP, MFI, and Momentum to provide comprehensive technical analysis. This indicator helps traders identify potential market conditions based on the interaction of these indicators.
Components of the RVMM Indicator
1. RSI (Relative Strength Index)
RSI is a momentum indicator that measures the speed and change of price movements. RSI oscillates between 0 and 100 and is used to identify overbought and oversold conditions in the market.
Buy Level: Set at 30. When RSI falls below 30, the market is considered oversold, which may suggest a potential upward trend reversal.
Sell Level: Set at 70. When RSI rises above 70, the market is considered overbought, which may suggest a potential downward trend reversal.
2. VWAP (Volume Weighted Average Price)
VWAP is an indicator that combines price and volume to calculate the average price weighted by volume. VWAP is used to identify support and resistance areas and assess the strength of price movements.
Interpretation: If the price is above the VWAP line, the market is likely in an uptrend. If the price is below the VWAP line, the market is in a downtrend.
3. MFI (Money Flow Index)
MFI is a momentum indicator that considers both price and volume. MFI oscillates between 0 and 100 and is used to identify overbought and oversold conditions in the market.
Oversold Level: Set at 20. When MFI falls below 20, the market is considered oversold.
Overbought Level: Set at 80. When MFI rises above 80, the market is considered overbought.
4. Momentum
Momentum is an indicator that measures the speed of price changes. This indicator is used to identify the strength of a trend.
Interpretation: High momentum values indicate a strong uptrend, while low momentum values indicate a strong downtrend.
How to Use the RVMM Indicator
Interpreting Market Conditions:
RSI : Check RSI values below 30 to identify oversold conditions, and above 70 to identify overbought conditions.
VWAP : Observe whether the price is above or below the VWAP line to determine if the market is in an uptrend or downtrend.
MFI : Check if MFI is below 20 to identify oversold conditions, and above 80 to identify overbought conditions.
Momentum : Analyze momentum values to gauge the strength of the current trend.
Confirming Market Conditions:
Use VWAP, MFI, and Momentum to confirm market conditions identified by RSI.
If the price is above the VWAP line, and MFI and Momentum indicate the strength of the uptrend, the market may be in a bullish phase.
If the price is below the VWAP line, and MFI and Momentum indicate the strength of the downtrend, the market may be in a bearish phase.
Risk Management:
Set stop-loss and take-profit levels based on technical analysis and your trading preferences.
Monitor the market and adjust stop-loss and take-profit levels as market conditions change.
Example of Application
Here is an example of how to use the RVMM Indicator in practice:
Bullish Phase: When the price is above the VWAP line, RSI is below 30, and MFI and Momentum indicate the strength of the uptrend, the market is likely in a bullish phase.
Bearish Phase: When the price is below the VWAP line, RSI is above 70, and MFI and Momentum indicate the strength of the downtrend, the market is likely in a bearish phase.

Uptrick: Zero Lag HMA Trend Suite1. Name and Purpose
Uptrick: Zero Lag HMA Trend Suite is a Pine Version 6 script that builds upon the Hull Moving Average (HMA) to offer an advanced trend analysis tool. Its purpose is to help traders identify trend direction, potential reversals, and overall market momentum with reduced lag compared to traditional moving averages. By combining the HMA with Average True Range (ATR) thresholds, slope-dependent coloring, Volume Weighted Average Price (VWAP) ribbons, and optional reversal signals, the script aims to give a detailed view of price activity in various market environments.
2. Overview
This script begins with the calculation of a Hull Moving Average, a method that blends Weighted Moving Averages in a way designed to cut down on lag while still smoothing out price fluctuations. Next, several enhancements are applied. The script compares current HMA values to previous ones for slope-based coloring, which highlights uptrends and downtrends at a glance. It also plots buy and sell signals when price moves beyond or below thresholds determined by the ATR and the user’s chosen signal multiplier. An optional VWAP ribbon can be shown to confirm bullish or bearish conditions relative to a volume-weighted benchmark. Additionally, the script can plot reversal signals (labeled with B) at points where price crosses back toward the HMA from above or below. Taken together, these elements allow traders to visualize both the short-term momentum and the broader context of how price interacts with volatility and overall market direction.
3. Why These Indicators Have Been Linked Together
The reason the Hull Moving Average, the Average True Range, and the VWAP have been integrated into one script is to tackle multiple facets of market analysis in a single tool. The Zero Lag Hull Moving Average provides a responsive trend line, the ATR offers a measure of volatility that helps distinguish significant price shifts from typical fluctuations, and the VWAP acts as a reference for fair value based on traded volume. By layering all three, the script helps traders avoid the need to juggle multiple separate indicators and offers a holistic perspective. The slope-based coloring focuses on trend direction, the ATR-based thresholds refine possible buy and sell zones, and the VWAP ribbons provide insight into how price stands relative to an important volume-weighted level. The inclusion of up and down signals and reversal B labels further refines entries and exits.
4. Why Use Uptrick: Zero Lag HMA Trend Suite
The Hull Moving Average is already known for reacting more quickly to price changes compared to other moving averages while retaining a degree of smoothness. This suite enhances the basic HMA by showing colored gradients that make it easy to spot trend direction changes, highlighting potential entry or exit points based on volatility-driven thresholds, and optionally layering a volume-based measure of bullish or bearish market sentiment. By relying on a zero lag approach and additional data points, the script caters to those wanting a more responsive method of identifying shifts in market dynamics. The added reversal signals and up or down alerts give traders extra confirmation for potential turning points.
5. How This Extension Improves on the Basic HMA
This extension not only plots the Hull Moving Average but also includes data-driven alerts and visual cues that traditional HMA lines do not provide. First, it offers multi-layered slope coloring, making up or down trends quickly apparent. Second, it uses ATR-based thresholds to pinpoint moments when price may be extending beyond normal volatility, thus generating buy or sell signals. Third, the script introduces an optional VWAP ribbon to indicate whether the market is trading above or below this pivotal volume-weighted benchmark, adding a further confirmation step for bullish or bearish conditions. Finally, it incorporates optional reversal signals labeled with B, indicating points where price might swing back toward the main HMA line.
6. Core Components
The script can be broken down into several primary functions and features.
a. Zero Lag HMA Calculation
Uses two Weighted Moving Averages (half-length and full-length) combined through a smoothing step based on the square root of the chosen length. This approach is designed to reduce lag significantly compared to other moving averages.
b. Slope Detection
Compares current and prior HMA values to determine if the trend is up or down. The slope-based coloring changes between turquoise shades for upward movement and magenta shades for downward movement, making trend direction immediately visible.
c. ATR-Based Thresholding for Up and Down Signals
The script calculates an Average True Range over a user-defined period, then multiplies it by a signal factor to form two bands around the HMA. When price crosses below the lower band, an up (buy) signal appears; when it crosses above the upper band, a down (sell) signal is shown.
d. Reversal Signals (B Labels)
Tracks when price transitions back toward the main HMA from an extreme zone. When enabled, these reversal points are labeled with a B and can help traders see potential turning points or mean-reversion setups.
e. VWAP Bands
An optional Volume Weighted Average Price ribbon that plots above or below the HMA, indicating bullish or bearish conditions relative to a volume-weighted price benchmark. This can also act as a kind of support/ resistance.
7. User Inputs
a. HMA Length
Controls how quickly the moving average responds to price changes. Shorter lengths react faster but can lead to more frequent signals, whereas longer lengths produce smoother lines.
b. Source
Specifies the price input, such as close or an alternative source, for the calculation. This can help align the HMA with specific trading strategies.
c. ATR Length and Signal Multiplier
Defines how the script calculates average volatility and sets thresholds for buy or sell alerts. Adjusting these values can help filter out noise or highlight more aggressive signals.
d. Slope Index
Determines how many bars to look back for detecting slope direction, influencing how sensitive the slope coloring is to small fluctuations.
e. Show Buy and Sell Signals, Reversal Signals, and VWAP
Lets users toggle the display of these features. Turning off certain elements can reduce chart clutter if traders prefer a simpler layout.
8. Calculation Process
The script’s calculation follows a step-by-step approach. It first computes two Weighted Moving Averages of the selected price source, one over half the specified length and one over the full length. It then combines these using 2*wma1 minus wma2 to reduce lag, followed by applying another weighted average using the square root of the length. Simultaneously, it computes the ATR for a user-defined period. By multiplying ATR by the signal multiplier, it establishes upper and lower bands around the HMA, where crossovers generate buy (up) or sell (down) signals. The script can also plot reversal signals (B labels) when price crosses back from these bands in the opposite direction. For the optional VWAP feature, Pine Script’s ta.vwap function is used, and differences between the HMA and VWAP levels determine the color and opacity of the ribbon.
9. Signal Generation and Filtering
The ATR-based thresholds reduce the influence of small, inconsequential price swings. When price falls below the lower band, the script issues an up (buy) signal. If price breaks above the upper band, a down (sell) signal appears. These signals are visible through labels placed near the bars. Reversal signals, labeled with B, can be turned on to help detect when price retraces from an extended area back toward the main HMA line. Traders can disable or enable these signals to match their preferred level of chart detail or risk tolerance.
10. Visualization on the Chart
The Zero HMA Lag Trend Suite aims for visual clarity. The HMA line is plotted multiple times with increasing transparency to create a gradient effect. Turquoise gradients indicate upward slopes, and magenta gradients signify downward slopes. Bar coloring can be configured to align with the slope direction, providing quick insight into current momentum. When enabled, buy or sell labels are placed under or above the bars as price crosses the ATR-defined boundaries. If the reversal option is active, B labels appear around areas where price changes direction. The optional VWAP ribbons form background bands, using distinct coloration to signal whether price is above or below the volume-weighted metric.
11. Market Adaptability
Because the script’s parameters (HMA length, ATR length, signal multiplier, and slope index) are user-configurable, it can adapt to a wide range of markets and timeframes. Intraday traders may prefer a shorter HMA length for quick signals, while swing or position traders might use a longer HMA length to filter out short-lived price changes. The source setting can also be adjusted, allowing for specialized data inputs beyond just close or open values.
12. Risk Management Considerations
The script’s signals and labels are based on past price data and volatility readings, and they do not guarantee profitable outcomes. Sharp market reversals or unforeseen fundamental events can produce false signals. Traders should combine this tool with broader risk management strategies, including stop-loss placement, position sizing, and independent market analyses. The Zero HMA Lag Trend Suite can help highlight potential opportunities, but it should not be relied upon as the sole basis for trade decisions.
13. Combining with Other Tools
Many traders choose to verify signals from the Zero HMA Lag Trend Suite using popular indicators like the Relative Strength Index (RSI), Moving Average Convergence Divergence (MACD), or even simple volume-based metrics to confirm whether a price movement has sufficient momentum. Conventional techniques such as support and resistance levels, chart patterns, or candlestick analysis can also supplement signals generated by the script’s up, down, or reversal B labels.
14. Parameter Customization and Examples
a. Short-Term Day Trading
Using a shorter HMA length (for instance, 9 or 14) and a slightly higher ATR multiplier might provide timely buy and sell signals, though it may also produce more whipsaws in choppy markets.
b. Swing or Position Trading
Selecting a longer HMA length (such as 50 or 100) with a moderate ATR multiplier can help users track more significant and sustained market moves, potentially reducing the effect of minor fluctuations.
c. Multiple Timeframe Blends
Some traders load two versions of the indicator on the same chart, one for short-term signals (with frequent B label reversals) and another for the broader trend direction, aligning entry and exit decisions with the bigger picture.
15. Realistic Expectations
Even though the Hull Moving Average helps minimize lag and the script incorporates volatility-based filters and optional VWAP overlays, it cannot predict future market behavior with complete accuracy. Periods of low liquidity or sudden market shocks can still lead to signals that do not reflect longer-term trends. Frequent parameter review and manual confirmation are advised before executing trades based solely on the script’s outputs.
16. Theoretical Background
The Hull Moving Average formula aims to balance smoothness with reactivity, accomplished by combining Weighted Moving Averages at varying lengths. By subtracting a slower average from a faster one and then applying another smoothing step with the square root of the original length, the HMA is designed to respond more promptly to price changes than typical exponential or simple moving averages. The ATR component, introduced by J. Welles Wilder, calculates the average range of price movement over a user-defined period, allowing the script to assess volatility and adapt signals accordingly. VWAP provides a volume-weighted benchmark that many institutional traders track to gauge fair intraday value.
17. Originality and Uniqueness
Although multiple HMA-based indicators can be found, Uptrick: Zero Lag HMA Trend Suite sets itself apart by merging slope-based coloring, ATR thresholds, VWAP ribbons, up or down labels, and optional reversal signals all in one cohesive platform. This synergy aims to reduce chart clutter while still giving traders a comprehensive look at trend direction, volatility, and volume-based sentiment.
18. Summary
Uptrick: Zero Lag HMA Trend Suite is a specialized trading script designed to highlight potential market trends and reversals with minimal delay. It leverages the Hull Moving Average for an adaptive yet smooth price line, pairs ATR-based thresholds for detecting possible breakouts or dips, and provides VWAP-based ribbons for added volume-weighted context. Traders can further refine their entries and exits by enabling up or down signals and reversal labels (B) where price may revert toward the HMA. Suitable for a wide range of timeframes and instrument types, the script encourages a disciplined approach to trade management and risk control.
19. Disclaimer
This script is provided for informational and educational purposes only. Trading and investing involve significant financial risk, and no indicator can guarantee success under all conditions. Users should practice robust risk management, including the placement of stop losses and position sizing, and should confirm signals with additional analysis tools. The developer of this script assumes no liability for any trading decisions or outcomes resulting from its use.

BK Multiple MA, RMA, SMA, HMA, VWAP, Rolling VWAP **Indicator Description**
I’m incredibly proud to introduce my third indicator to the TradingView community: **BK Multiple MA with HMA, VWAP, and Rolling VWAP**! This tool has been a game-changer in my trading strategy, and I’m excited to share it with others who are navigating the markets.
This indicator holds a special place in my heart because it represents the first technical analysis concept introduced to me by my mentor when I began apprenticing under him. His wisdom, guidance, and passion for trading—and for life—left an indelible mark on my journey. I dedicate this work, and every indicator I introduce, to the foundation he helped me build, while giving glory first and foremost to God.
**Moving Averages (MAs)** are one of the most widely used tools in technical analysis, and this indicator takes them to the next level. It allows you to plot **six fully customizable moving averages simultaneously**, with options including:
- **Exponential Moving Average (EMA)**
- **Simple Moving Average (SMA)**
- **Relative Moving Average (RMA)**
- **Hull Moving Average (HMA)**
- **Volume Weighted Average Price (VWAP)**
- **Rolling VWAP**
This flexibility makes the indicator highly versatile, whether you’re a day trader, swing trader, or long-term investor. By customizing periods, colors, and line widths for each MA, you can tailor the indicator to perfectly suit your trading style.
**Key Features**
1. **Six Fully Customizable MAs**:
- Adjust periods, line colors, and widths to match your preferences.
- Select from EMA, SMA, RMA, HMA, VWAP, or Rolling VWAP for each line.
2. **Unique Rolling VWAP Option**:
- Rolling VWAP calculates the volume-weighted average price over a user-defined period, such as 200 candles.
- This feature is ideal for traders seeking volume-weighted levels that don’t reset with each session, making it invaluable for trend-following and swing trading.
3. **HMA for Smoother Trends**:
- The Hull Moving Average (HMA) is designed to reduce lag and provide a responsive, noise-free view of price trends.
- It’s a powerful tool for spotting reversals and confirming directional momentum.
4. **Session VWAP**:
- Traditional VWAP resets with each trading session, making it a reliable benchmark for intraday support and resistance levels.
**How It Works**
- **VWAP**: Reflects the average price weighted by volume for the current trading session, commonly used by institutional traders to identify key price levels.
- **Rolling VWAP**: Extends VWAP functionality by calculating over a user-defined period, allowing for flexible multi-timeframe analysis.
- **HMA**: A fast, smooth moving average that reacts quickly to price changes while filtering out noise.
The combination of these options provides traders with a comprehensive view of market dynamics, enabling better decision-making.
**Final Thoughts**
This indicator is deeply meaningful to me because it represents the first concept my mentor introduced when I began apprenticing under him. His wisdom, guidance, and passion for trading—and for life—left an indelible mark on my journey. I dedicate this work, and every indicator I introduce, to the foundation he helped me build, while giving glory first and foremost to God.
If this indicator helps you succeed, I humbly ask that you honor the blessings in your life by giving back—whether through acts of kindness, philanthropy, or helping others in need.
May the Almighty guide us all toward wisdom and success in our endeavors. All glory belongs to God!
MERCURY by DrAbhiramSivprasad"MERCURY by DrAbhiramSivprasad"
Developed from over 10 years of personal trading experience, the Mercury Indicator is a strategic tool designed to enhance accuracy in trading decisions. Think of it as a guiding light—a supportive tool that helps traders refine and build more robust strategies by integrating multiple powerful elements into a single indicator. I’ll be sharing some examples to illustrate how I use this indicator in my own trading journey, highlighting its potential to improve strategy accuracy.
Reason behind the combination of emas , cpr and vwap is it provides very good support and resistance in my trading carrier so now i brought them together in one plate
How It Works:
Mercury combines three essential elements—EMA, VWAP, and CPR—each of which plays a vital role in detecting support and resistance:
Exponential Moving Averages (EMAs): Known for their strength in providing dynamic support and resistance levels, EMAs help in identifying trends and shifts in momentum. This indicator includes a dashboard with up to nine customizable EMAs, showing whether each is acting as support or resistance based on real-time price movement.
Volume Weighted Average Price (VWAP): VWAP also provides valuable support and resistance, often regarded as a fair price level by institutional traders. Paired with EMAs, it forms a dual-layered support/resistance system, adding an additional level of confirmation.
Central Pivot Range (CPR): By combining CPR with EMAs and VWAP, Mercury highlights “traffic blocks” in your target journey. This means it identifies zones where price is likely to stall or reverse, providing additional guidance for navigating entries and exits.
Why This Combination Matters:
Using these three tools together gives you a more complete view of the market. VWAP and EMAs offer dynamic trend direction and support/resistance, while CPR pinpoints critical price zones. This combination helps you find high-probability trades, adding clarity to complex market situations and enabling stronger confirmation on trend or reversal decisions.
How to Use:
Trend Confirmation: Check if all EMAs are aligned (green for uptrend, red for downtrend), which is visible in the EMA dashboard. An alignment across VWAP, CPR, and EMAs signifies high confidence in trend direction.
Breakouts & Breakdowns: Mercury has an alert system to signal when a price breakout or breakdown occurs across VWAP, EMA1, and EMA2. This can help in spotting strong directional moves.
Example Application: In my trading, I use Mercury to identify support/resistance zones, confirming trends with EMA/VWAP alignment and using CPR as a checkpoint. I find this especially useful for day trading and swing setups.
Recommended Timeframes:
Day Trading: 5 to 15-minute charts for swift, actionable insights.
Swing Trading: 1-hour or 4-hour charts for broader trend analysis.
Note:
The Mercury Indicator should be used as a supportive tool rather than a standalone strategy, guiding you toward informed decisions in line with your trading style and goals.
EXAMPLE OF TRADE
you can see the cart of XAUUSD on 11th nov 2024
1.SHORT POSITION - TIME FRAME 15 MIN
So here for a short position you need to wait for a breakdown candle which will print in orange post the candle you need to check ema dashboard is completly red that indicates no traffic blocks in your journey to destiny target from ema's and you can take the target from nearest cpr support line
TAKEN IN XAUUSD you can see in chart of XAUUSD on 7th nov
2.LONG POSITION - TIME FRAME 15 MIN -
So here for long position you need to wait for a breakout candle from indicator thats here is blue and check all ema boxes are green and candle body should close above all the 3 lines here it is the both ema 1 and 2 and the vwap line then you can take and entry and your target will be the nearest resistance from the daily cpr
3. STOP LOSS CRITERIA
After the entry any candle close below any of the last line from entry for example we have 3 lines vwap and ema 1 and 2 lines and u have made an entry and the last line before the entry is vwap then if any candle closes below vwap can be considered as stoploss like wise in any lines
The MERCURY indicator is a comprehensive trading tool designed to enhance traders' ability to identify trends, breakouts, and reversals effectively. Created by Dr. Abhiram Sivprasad, this indicator integrates several technical elements, including Central Pivot Range (CPR), EMA crossovers, VWAP levels, and a table-based EMA dashboard, to offer a holistic trading view.
Core Components and Functionality:
Central Pivot Range (CPR):
The CPR in MERCURY provides a central pivot level along with Below Central (BC) and Top Central (TC) pivots. These levels act as potential support and resistance, useful for identifying reversal points and zones where price may consolidate.
Exponential Moving Averages (EMAs):
MERCURY includes up to nine EMAs, with a customizable EMA crossover alert system. This feature enables traders to see shifts in trend direction, especially when shorter EMAs cross longer ones.
VWAP (Volume-Weighted Average Price):
VWAP is incorporated as a dynamic support/resistance level and, combined with EMA crossovers, helps refine entry and exit points for higher probability trades.
Breakout and Breakdown Alerts:
MERCURY monitors conditions for upside and downside breakouts. For an upside breakout, all EMAs turn green and a candle closes above VWAP, EMA1, and EMA2. Similarly, all EMAs turning red, combined with a close below VWAP and EMA1/EMA2, signals a downside breakdown. Continuous alerts are available until the trend shifts.
Real-Time EMA Dashboard:
A table displays each EMA’s relative position (Above or Below), helping traders quickly gauge trend direction. Colors in the table adjust to long/short conditions based on EMA alignment.
Usage Recommendations:
Trend Confirmation:
Use the CPR, EMA alignments, and VWAP to confirm uptrends and downtrends. The table highlights trends, making it easy to spot long or short setups at a glance.
Breakout and Breakdown Alerts:
The alert system is customizable for continuous notifications on critical price levels. When all EMAs align in one direction (green for long, red for short) and the close is above or below VWAP and key EMAs, the indicator confirms a breakout/breakdown.
Adaptable for Different Styles:
Day Trading: Traders can set shorter EMAs for quick insights.
Swing Trading: Longer EMAs combined with CPR offer insights into sustained trends.
Recommended Settings:
Timeframes: MERCURY is suitable for timeframes as low as 5 minutes for intraday traders, up to daily charts for trend analysis.
Symbols: Works across forex, stocks, and crypto. Adjust EMA lengths for asset volatility.
Example Strategy:
Long Entry: When the price crosses above CPR and closes above both EMA1 and EMA2.
Short Entry: When the price falls below CPR with a close below both EMA1 and EMA2.

RSI from Rolling VWAP [CHE]Introducing the RSI from Rolling VWAP Indicator
Elevate your trading strategy with the RSI from Rolling VWAP —a cutting-edge indicator designed to provide unparalleled insights and enhance your decision-making on TradingView. This advanced tool seamlessly integrates the Relative Strength Index (RSI) with a Rolling Volume-Weighted Average Price (VWAP) to deliver precise and actionable trading signals.
Why Choose RSI from Rolling VWAP ?
- Clear Trend Detection: Our enhanced algorithms ensure accurate identification of bullish and bearish trends, allowing you to capitalize on market movements with confidence.
- Customizable Time Settings: Tailor the time window in days, hours, and minutes to align perfectly with your unique trading strategy and market conditions.
- Flexible Moving Averages: Select from a variety of moving average types—including SMA, EMA, WMA, and more—to smooth the RSI, providing clearer trend analysis and reducing market noise.
- Threshold Alerts: Define upper and lower RSI thresholds to effortlessly spot overbought or oversold conditions, enabling timely and informed trading decisions.
- Visual Enhancements: Enjoy a visually intuitive interface with color-coded RSI lines, moving averages, and background fills that make interpreting market data straightforward and efficient.
- Automatic Signal Labels: Receive immediate bullish and bearish labels directly on your chart, signaling potential trading opportunities without the need for constant monitoring.
Key Features
- Inspired by Proven Tools: Building upon the robust foundation of TradingView's Rolling VWAP, our indicator offers enhanced functionality and greater precision.
- Volume-Weighted Insights: By incorporating volume into the VWAP calculation, gain a deeper understanding of price movements and market strength.
- User-Friendly Configuration: Easily adjust settings to match your trading preferences, whether you're a novice trader or an experienced professional.
- Hypothesis-Driven Analysis: Utilize hypothetical results to backtest strategies, understanding that past performance does not guarantee future outcomes.
How It Works
1. Data Integration: Utilizes the `hlc3` (average of high, low, and close) as the default data source, with customization options available to suit your trading needs.
2. Dynamic Time Window: Automatically calculates the optimal time window based on an auto timeframe or allows for fixed time periods, ensuring flexibility and adaptability.
3. Rolling VWAP Calculation: Accurately computes the Rolling VWAP by balancing price and volume over the specified time window, providing a reliable benchmark for price action.
4. RSI Analysis: Measures momentum through RSI based on Rolling VWAP changes, smoothed with your chosen moving average for enhanced trend clarity.
5. Actionable Signals: Detects and labels bullish and bearish conditions when RSI crosses predefined thresholds, offering clear indicators for potential market entries and exits.
Seamless Integration with Your TradingView Experience
Adding the RSI from Rolling VWAP to your TradingView charts is straightforward:
1. Add to Chart: Simply copy the Pine Script code into TradingView's Pine Editor and apply it to your desired chart.
2. Customize Settings: Adjust the Source Settings, Time Settings, RSI Settings, MA Settings, and Color Settings to align with your trading strategy.
3. Monitor Signals: Watch for RSI crossings above or below your set thresholds, accompanied by clear labels indicating bullish or bearish trends.
4. Optimize Your Trades: Leverage the visual and analytical strengths of the indicator to make informed buy or sell decisions, maximizing your trading potential.
Disclaimer:
The content provided, including all code and materials, is strictly for educational and informational purposes only. It is not intended as, and should not be interpreted as, financial advice, a recommendation to buy or sell any financial instrument, or an offer of any financial product or service. All strategies, tools, and examples discussed are provided for illustrative purposes to demonstrate coding techniques and the functionality of Pine Script within a trading context.
Any results from strategies or tools provided are hypothetical, and past performance is not indicative of future results. Trading and investing involve high risk, including the potential loss of principal, and may not be suitable for all individuals. Before making any trading decisions, please consult with a qualified financial professional to understand the risks involved.
By using this script, you acknowledge and agree that any trading decisions are made solely at your discretion and risk.
Get Started Today
Transform your trading approach with the RSI from Rolling VWAP indicator. Experience the synergy of momentum and volume-based analysis, and unlock the potential for more accurate and profitable trades.
Download now and take the first step towards a more informed and strategic trading journey!
For further inquiries or support, feel free to contact
Best regards
Chervolino
Inspired by the acclaimed Rolling VWAP by TradingView

Multiple SMA, EMA, and VWAP CrossoversMultiple SMA, EMA, and VWAP Crossovers with Alerts
Overview : The "Multiple SMA, EMA, and VWAP Crossovers" script is designed for traders who want to monitor various simple moving averages (SMAs), exponential moving averages (EMAs), and the volume-weighted average price (VWAP) to identify potential buy and sell opportunities. This script allows you to visualize key moving averages on your chart and create custom alerts for specific crossover events.
Detail s: This script plots the following moving averages:
Simple Moving Averages (SMA): 5, 10, 20, 50, 100, 200, and 325 periods
Exponential Moving Average (EMA): 9 periods
Volume-Weighted Average Price (VWAP)
It includes options to display these moving averages and set alerts for their crossovers.
Available Crossovers:
20/50 SMA, 20/100 SMA, 20/200 SMA, 20/325 SMA
50/100 SMA, 50/200 SMA, 50/325 SMA
100/200 SMA, 100/325 SMA
200/325 SMA
VWAP/20 SMA, VWAP/50 SMA, VWAP/100 SMA, VWAP/200 SMA, VWAP/325 SMA
Optional Lines to Add to the Chart:
9 EMA, 5 SMA, 10 SMA, 20 SMA, 50 SMA, 100 SMA, 200 SMA, 325 SMA, VWAP
How to Use:
Enable Indicators: Use the input options to select which SMAs, EMA, and VWAP you want to display on your chart.
Set Alerts: Choose the specific crossover events you want to monitor. For example, you can set an alert for the 20/50 SMA crossover or the VWAP/100 SMA crossover.
Monitor the Chart: The script will plot the selected moving averages on your chart. When a selected crossover event occurs, an alert will be triggered, notifying you of the potential trade opportunity.
Usage Tips:
Trending Market: Use the buy and sell alerts in trending markets where the moving averages can help confirm the direction of the trend.
Key Support and Resistance Levels: Combine crossover alerts with key support and resistance levels for more reliable trading signals.
Volume Confirmation: Ensure there is sufficient volume to support the crossover signals, indicating stronger momentum behind the move.
When NOT to Use Buy and Sell Alerts:
Low Volume: Avoid using buy and sell alerts during periods of low trading volume, as the signals may be less reliable.
Market Noise: Be cautious in highly volatile markets where frequent crossovers might generate false signals.
Sideways Market: In a sideways or range-bound market, crossover signals can result in multiple whipsaws, leading to potential losses.
Why Use This Script? This script provides a comprehensive tool for traders to monitor multiple moving averages and VWAP crossovers efficiently. It allows you to customize alerts based on your trading strategy and helps you make informed decisions by visualizing key technical indicators on your chart.
Legal Disclaimer: The information provided by this script is for educational and informational purposes only and should not be considered financial advice. The developer of this script is not responsible for any financial losses incurred from using this script.

Adaptive VWAP [QuantAlgo]Introducing the Adaptive VWAP by QuantAlgo 📈🧬
Enhance your trading and investing strategies with the Adaptive VWAP , a versatile tool designed to provide dynamic insights into market trends and price behavior. This indicator offers a flexible approach to VWAP calculations by allowing users to adapt it based on lookback periods or fixed timeframes, making it suitable for a wide range of market conditions.
🌟 Key Features:
🛠 Customizable VWAP Settings: Choose between an adaptive VWAP that adjusts based on a rolling lookback period, or switch to a fixed timeframe (e.g., daily, weekly, monthly) for a more structured approach. Adjust the VWAP to suit your trading or investing style.
💫 Dynamic Bands and ATR Filter: Configurable deviation bands with multipliers allow you to visualize price movement around VWAP, while an ATR-based noise filter helps reduce false signals during periods of market fluctuation.
🎨 Trend Visualization: Color-coded trend identification helps you easily spot uptrends and downtrends based on VWAP positioning. The indicator fills the areas between the bands for clearer visual representation of price volatility and trend strength.
🔔 Custom Alerts: Set up alerts for when price crosses above or below the VWAP, signaling potential uptrend or downtrend opportunities. Stay informed without needing to monitor the charts constantly.
✍️ How to Use:
✅ Add the Indicator: Add the Adaptive VWAP to your favourites and apply to your chart. Choose between adaptive or timeframe-based VWAP calculation, adjust the lookback period, and configure the deviation bands to your preferred settings.
👀 Monitor Bands and Trends: Watch for price interaction with the VWAP and its deviation bands. The color-coded signals and band fills help identify potential trend shifts or price extremes.
🔔 Set Alerts: Configure alerts for uptrend and downtrend signals based on price crossing the VWAP, so you’re always informed of significant market movements.
⚙️ How It Works:
The Adaptive VWAP adjusts its calculation based on the user’s chosen configuration, allowing for a flexible approach to market analysis. The adaptive setting uses a rolling lookback period to continuously adjust the VWAP, while the fixed timeframe option anchors VWAP to key timeframes like daily, weekly, or monthly periods. This flexibility enables traders and investors to use the tool in various market environments.
Deviation bands, calculated with customizable multipliers, provide a clear visual of how far the price has moved from the VWAP, helping you gauge potential overbought or oversold conditions. To reduce false signals, an ATR-based filter can be applied, ensuring that only significant price movements trigger trend confirmations.
The tool also includes a fast exponential smoothing function for the VWAP, helping smooth out price fluctuations without sacrificing responsiveness. Trend confirmation is reinforced by the number of bars that price stays above or below the VWAP, ensuring a more consistent trend identification process.
Disclaimer:
The Adaptive VWAP is designed to enhance your market analysis but should not be relied upon as the sole basis for trading or investing decisions. Always combine it with other analytical tools and practices. No statements or signals from this indicator constitute financial advice. Past performance is not indicative of future results.

ORB - Alerts, VWAP and MACD Checks, Extended Fib Levels
ORB Range Alerter with Shading, VWAP Check, MACD Check, and Extended Fibonacci Levels for TP – Fully Customizable
This indicator is designed to give you a comprehensive analysis of the Opening Range Breakout (ORB) combined with advanced conditions based on VWAP and MACD indicators, along with Extended Fibonacci Levels for both long and short TP positions.
Key Features:
Opening Range Breakout (ORB):
Defines the opening range at the market open (9:30 AM by default) based on your chart timeframe and shades it for visibility.
The high and low of the first candle after the open are plotted on the chart, creating a breakout range that traders can use to identify potential long or short positions.
VWAP Condition (Optional):
This indicator includes the option to enforce the VWAP (Volume-Weighted Average Price) as a condition for entering trades.
- Longs will only trigger if the price is above VWAP (when enabled).
- Shorts will only trigger if the price is below VWAP (when enabled).
Customizable : You can enable or disable the VWAP condition through a simple checkbox in the indicator’s settings.
MACD Condition (Optional):
Includes an optional MACD (Moving Average Convergence Divergence) condition.
- Longs will only trigger if the MACD line is above 0 and the signal line, providing confirmation of bullish momentum.
- Shorts will only trigger if the MACD line is below 0 and the signal line, indicating bearish momentum.
Customizable : You can enable or disable the MACD condition through a checkbox in the indicator’s settings, allowing you to trade with or without the MACD confirmation.
Fibonacci Extensions for Profit Targets:
Automatically calculates Fibonacci extension levels based on the ORB range for TP levels.
These levels provide key areas for potential profit-taking or reversal points.
Fibonacci extensions are plotted only after a confirmed breakout, either long or short.
The extensions include 127.2%, 161.8%, 200%, 261.8%, 423.6%, and 685.4%, offering a comprehensive set of targets for different trading strategies.
Shading of ORB Range:
The ORB high and low are visually emphasized on the chart with a shaded area for easy identification.
The shading is semi-transparent to help keep your chart clean and easy to read.
Customizable Timeframe:
The ORB range is defined based on the time of day (default is 9:30 AM to 4:00 PM), but you can adjust the timeframe to suit different trading sessions or markets.
Alerts for Breakouts:
Built-in alerts notify you when price crosses above or below the ORB high or low, along with the optional VWAP and MACD conditions.
Alerts can be used to create automated notifications or even execute automated trades based on your chosen settings.
How to Use:
Long Trade Example: When the price crosses above the ORB high, VWAP is above the price, and MACD shows bullish momentum (if these conditions are enabled), a potential long entry is triggered. You can use the Fibonacci extensions for profit targets.
Short Trade Example: When the price crosses below the ORB low, VWAP is below the price, and MACD confirms bearish momentum (if these conditions are enabled), a short entry is triggered. Fibonacci levels for the short position can guide your exit strategy.
Flexibility: You can enable or disable both VWAP and MACD conditions based on your trading style. This flexibility allows the indicator to adapt to different market conditions and strategies.
Customization Options:
Enable/Disable VWAP Condition: Decide if you want to include VWAP as a trade filter.
Enable/Disable MACD Condition: Choose whether to require MACD as confirmation for trade entries.
Adjust ORB Timeframe: Customize the time range for defining the ORB based on the market you're trading.
Fibonacci Extensions: Visualize key profit targets using Fibonacci extensions, which are automatically calculated and displayed after a breakout.
