Automatic Swing AVWAPsUnique VWAP anchoring technique
The VWAP indicator is one of the most popular tools in trading, used by millions of traders daily, including institutional traders. KV's Anchored VWAP system is specifically designed to deliver more precise entry points. This toolkit also includes traditional anchored VWAPs, such as the Daily VWAP, Previous Day VWAP, and more.
Automated key levels
Support and resistance levels are a must in every trader's toolbox, including KV's. However, only the most critical levels are effective, and this toolkit is built on KV's years of experience to include only the most relevant ones for accurate trading zones.
Buscar en scripts para "VWAP"

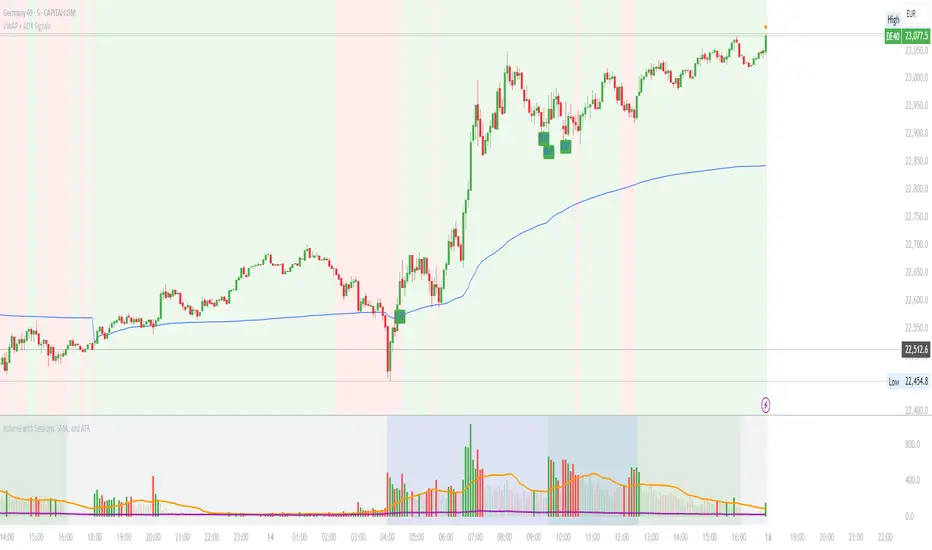
VWAP with ADX Buy/Sell Signals and 50 MA BackgroundThis Pine Script combines several technical indicators to create a comprehensive chart with buy and sell signals based on the ADX and VWAP, as well as background color changes depending on the price relative to the 50-period simple moving average (SMA). Here's a breakdown of what each part of the code does:
1. VWAP Settings
Anchor Period: You can select different periods such as "Session", "Week", "Month", etc. to define the anchor period for the VWAP.
Source: The source for VWAP is set to the typical price (hlc3).
Offset: Allows for shifting the VWAP by a specified amount.
2. ADX Settings
ADX Length: The period used to calculate the ADX.
ADX Smoothing: Used to smooth the ADX for better clarity.
ADX Threshold: Used to filter out weak trends (i.e., signals when ADX > 20).
3. ADX and VWAP Calculation
The ADX values are calculated using ta.dmi(), which returns the +DI, -DI, and ADX lines.
VWAP is calculated using ta.vwap(), based on the selected price source.
4. Buy/Sell Conditions
Buy Signal: A buy signal is generated when:
The +DI crosses above the -DI (indicating an uptrend).
The ADX is above 20 (indicating a strong trend).
The closing price is above the VWAP (indicating bullish market sentiment).
Sell Signal: A sell signal occurs when:
The -DI crosses above the +DI (indicating a downtrend).
The ADX is above 20 (indicating a strong trend).
The closing price is below the VWAP (indicating bearish market sentiment).
5. VWAP Bands
The standard deviation of the price is calculated using ta.stdev(), and the bands are plotted at multiples of the standard deviation (1, 2, and 3).
These bands are used to highlight possible overbought or oversold conditions.
6. 50-period SMA and Background Color
The script calculates a 50-period Simple Moving Average (SMA).
The background color is then changed based on whether the price is above or below the 50-period SMA. If the price is above the SMA, the background is green (bullish), and if it’s below, it’s red (bearish).
7. Plots
The script includes plots for the VWAP line, the ADX and DI lines (optional), and the upper and lower bands.
The buy and sell signals are plotted as shapes with text labels ("BUY" and "SELL") that appear below or above the price bars.
Final Notes:
Band Plots: Three levels of bands (green, olive, teal) are plotted using standard deviation multipliers (1, 2, and 3 times the standard deviation).
Background Color: The background color changes depending on whether the price is above or below the 50 SMA, giving a visual cue for bullish or bearish market conditions.
This indicator aims to offer a multi-faceted view of the market with trend-following signals (via ADX), VWAP for intraday support/resistance, and background coloring to indicate the current trend strength based on the 50 SMA.
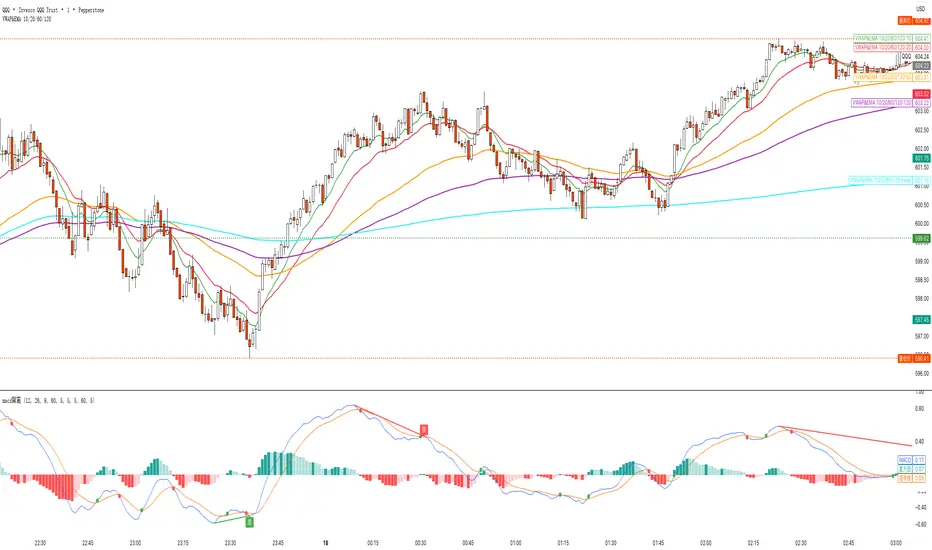
VWAP&EMA 10/20/60/120his script is a clean and straightforward technical analysis tool designed to provide traders with a clear view of market trends and key price levels by overlaying five essential moving averages onto your chart:
Volume Weighted Average Price (VWAP)
Four (4) Exponential Moving Averages (EMAs) at lengths 10, 20, 60, and 120.
By combining these indicators, traders can quickly assess short-term momentum, medium-term trends, and long-term direction, all while referencing the volume-weighted average price as a key benchmark for institutional activity.
Features & Components
This indicator plots five distinct lines on your chart, each color-coded for easy identification:
VWAP (Volume Weighted Average Price)
Plot: Plotted as a bright blue line.
Purpose: The VWAP represents the true average price of an asset for the day (or session), weighted by volume. It is a critical level for many day traders and institutions.
Prices above VWAP are often considered bullish.
Prices below VWAP are often considered bearish.
It frequently acts as a dynamic level of support or resistance.
EMA 10 (Short-Term Momentum)
Plot: Plotted as a green line.
Purpose: This is the fastest-moving average, reflecting the most recent price action and short-term momentum.
EMA 20 (Short-Term Trend)
Plot: Plotted as a red line.
Purpose: Often used in conjunction with the EMA 10, this average helps confirm the immediate trend. Crossovers between the 10 and 20 EMAs can signal potential entry or exit points.
EMA 60 (Medium-Term Trend)
Plot: Plotted as an orange line.
Purpose: This average provides a clearer picture of the medium-term trend, filtering out much of the short-term noise. It often serves as a significant dynamic support or resistance level.
EMA 120 (Long-Term Trend)
Plot: Plotted as a purple line.
Purpose: This is the slowest-moving average in the script, defining the major underlying trend. As long as the price remains above the EMA 120, the long-term bias is generally considered bullish, and vice-versa.
How to Use This Indicator
This indicator is versatile and can be adapted to various trading strategies:
Trend Confirmation: Use the alignment of the EMAs to determine the trend.
Strong Bullish Trend: Price > EMA 10 > EMA 20 > EMA 60 > EMA 120.
Strong Bearish Trend: Price < EMA 10 < EMA 20 < EMA 60 < EMA 120.
Dynamic Support & Resistance: Watch how the price reacts to each of the five lines. In an uptrend, the EMAs and VWAP will often act as "bounces" or support levels for pullbacks. In a downtrend, they will act as resistance.
Entry & Exit Signals (Crossovers):
A bullish crossover (e.g., EMA 10 crossing above EMA 20) can signal buying interest.
A bearish crossover (e.g., EMA 10 crossing below EMA 20) can signal selling pressure.
VWAP Confluence: Pay special attention to areas where an EMA (like the 20 or 60) crosses or travels close to the VWAP. This "confluence" can create a very strong and significant price level. For example, if the price pulls back to the VWAP and also finds support at the EMA 60, it can be a high-probability trade setup.
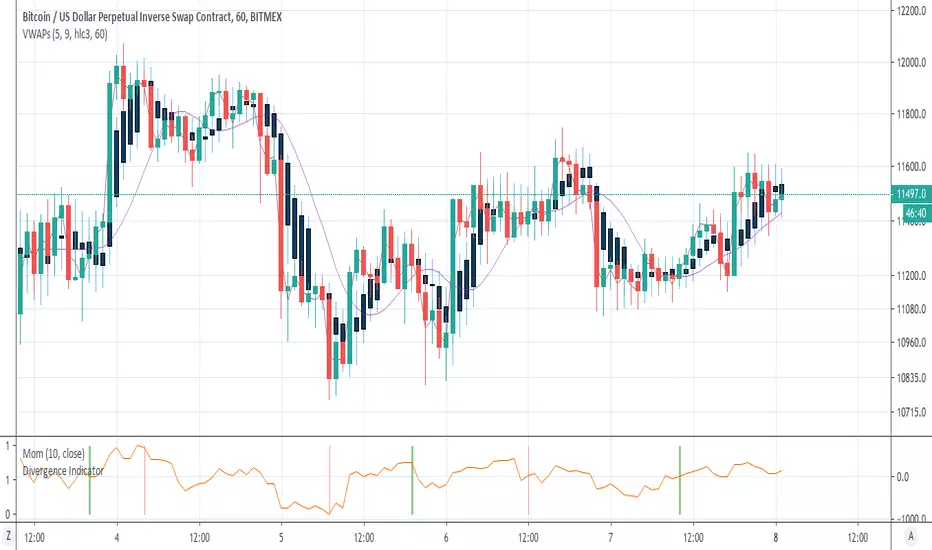
Vwap and MvwapDay Trading - Made Easy
Vwap (Volume weighted avergae price) is an excellent day trader's tool which comprises of two vital elements ( volume and Price).
and a 50 period vwap based MVWAP provides a baseline for the day trading strategy..
Green bars = price above both vwap and Mvwap.. (for long positions)
Red bars = price below both vwap and Mvwap .. (for short positons)
Gray bars = price in between both vwaps
* One has to apply this strategy along with momentum, major supports and resistances.
* add other confirmations for better trades.

Volume Weighted Average PriceThis indicator provides an implementation of the Volume Weighted Average Price (VWAP), extended with layered standard deviation bands that decompose total market volatility relative to the VWAP anchor period.
Key Features:
Volatility Decomposition: The indicator's primary feature is its ability to separate volatility, controlled by the 'Estimate Bar Statistics' option.
Standard Mode (Estimate Bar Statistics = OFF): Plots a single set of bands representing the standard deviation of the Source price relative to the VWAP.
Decomposition Mode (Estimate Bar Statistics = ON): The indicator uses a statistical model ('Estimator') to calculate within-bar volatility. (Assumption: In this mode, the Source input is ignored, and an estimated mean for each bar is used instead). This mode displays two sets of bands:
Inner Bands: Show only the contribution of the 'between-bar' volatility.
Outer Bands: Show the total volatility (the sum of between-bar and within-bar components).
Periodic & Customizable Anchor: The VWAP calculation is session-based and resets at the beginning of a new period. The anchor timeframe (Anchor Timeframe) can be detected automatically (e.g., 'Session', 'Week') or specified manually.
Weighting Mechanism: The indicator has two levels of weighting:
The baseline is always a VWAP (Volume-Weighted Average Price).
The Volume weighted input additionally applies volume weighting to the volatility (standard deviation) calculation for the bands.
Multi-Timeframe (MTF) Engine: The indicator includes an MTF conversion block. When a Higher Timeframe (HTF) is selected, advanced options become available: Fill Gaps handles data gaps, and Wait for timeframe to close prevents repainting by ensuring the indicator only updates when the HTF bar closes.
Integrated Alerts: Includes a full set of built-in alerts for the source price crossing over or under the central VWAP line and the outermost calculated volatility band.
DISCLAIMER
For Informational/Educational Use Only: This indicator is provided for informational and educational purposes only. It does not constitute financial, investment, or trading advice, nor is it a recommendation to buy or sell any asset.
Use at Your Own Risk: All trading decisions you make based on the information or signals generated by this indicator are made solely at your own risk.
No Guarantee of Performance: Past performance is not an indicator of future results. The author makes no guarantee regarding the accuracy of the signals or future profitability.
No Liability: The author shall not be held liable for any financial losses or damages incurred directly or indirectly from the use of this indicator.
Signals Are Not Recommendations: The alerts and visual signals (e.g., crossovers) generated by this tool are not direct recommendations to buy or sell. They are technical observations for your own analysis and consideration.

VWAP Trio: Continuous + London-anchored + NY-anchoredThis indicator plots three different VWAPs at once so you can see how price behaves against:
Continuous VWAP
Starts from the beginning of the whole chart / instrument history and keeps going.
Acts like a long-term “fair value” line.
London-anchored VWAP
Resets (anchors) at the London session open (usually 08:00 London).
Shows the average price paid during the current London session.
Day traders use it to see if price is trending or mean-reverting during the EU morning.
NY-anchored VWAP
Resets at the New York session open (usually 08:00 NY / 13:00–14:30 London depending on DST).
Shows the average price for the U.S. session.

SnipeSquad NQ-Survival SniperRapid-fire scalping toolkit for the 1-minute CME Nasdaq-100 futures chart (NQ/MNQ) that stacks a higher-time-frame trend bias, intraday VWAP, and momentum/RSI triggers, then auto-maps stop & target levels so $nipeSquad members can drop OCO orders in a click.
What the script does
• Context filter – Pulls a 34-EMA from a higher time-frame (default 15 min) and checks where price sits versus that EMA and the current-session VWAP.
o Price > EMA and VWAP ⇒ bullish context
o Price < EMA and VWAP ⇒ bearish context
• Entry trigger – On the 1-minute chart it waits for:
o an 8/21 EMA crossover / cross-under, plus
o an RSI sanity check (RSI < 60 for longs, > 40 for shorts).
• Risk template – You define the risk per trade in ticks (default 20).
o Script instantly projects a stop and a target at your chosen Reward-to-Risk multiple (default 2 R).
o Each new trade is tagged with an ID label that shows direction and tick target so you can fire an OCO order fast.
• Visual outputs
o VWAP line (session-reset) and Higher-TF EMA line
o Green/red triangles for entries
o Up/down labels that display the projected target price
• Alerts ready – alertcondition() lines fire the moment a long or short signal prints, so you can route them to a broker, Discord, or wherever the $nipeSquad hangs out.
Adjustable inputs
Input Default Purpose
Context TF 15 (min) Higher-time-frame used for trend bias
Risk (ticks) 20 Size of the stop in ticks
Reward-to-Risk 2.0 Multiplier that sets the profit target
VWAP session / UTC 1800-1600 / UTC-4 Lets you anchor VWAP to your preferred trading session
How to use
1. Add the script on a 1-minute NQ or MNQ chart.
2. Set your risk ticks so the dollar value lines up with your prop-firm rules or personal risk limits.
3. Wait for a triangle that aligns with your bias; the label shows stop & target prices.
4. Place an OCO order (or link an automation) using those levels.
5. Repeat until daily goal is hit, or your risk plan says stop.
(The “$2 K” idea is purely an illustrative target—there is no guarantee this script will produce that, or any, profit.)
Educational & Risk Disclaimer 📚⚠️
This indicator is provided solely for educational purposes. It is not financial advice, a trading signal service, or a promise of profit. Futures trading involves substantial risk and can result in losses exceeding your initial investment.
By using this script you acknowledge that you alone are responsible for your trading decisions. Past performance—real or simulated—does not guarantee future results. The author accepts no liability for any loss or damage arising from the use of this code or the information herein. Always do your own research and consult a qualified financial professional before trading.

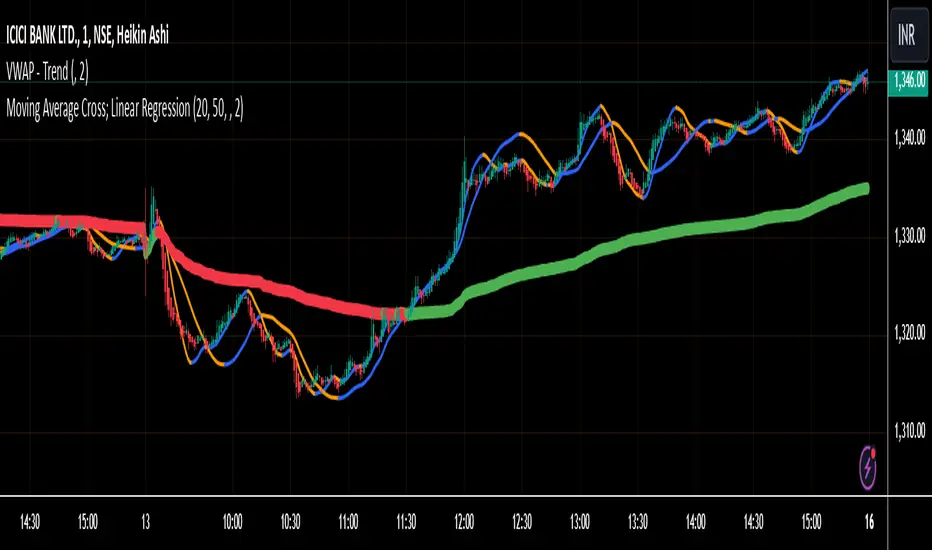
VWAP - TrendThis Pine Script calculates the Volume Weighted Average Price (VWAP) for a specified timeframe and plots its Linear Regression over a user-defined lookback period . The regression line is color-coded: green indicates an uptrend and red indicates a downtrend. The line is broken at the end of each day to prevent it from extending into the next day, ensuring clarity on a daily basis.
Key Features:
VWAP Calculation: The VWAP is calculated based on a selected timeframe, providing a smoothed average price considering volume.
Linear Regression: The script calculates a linear regression of the VWAP over a custom lookback period to capture the underlying trend.
Color-Coding: The regression line is color-coded to easily identify trends—green for an uptrend and red for a downtrend.
Day-End Break: The regression line breaks at the end of each day to prevent continuous plotting across days, which helps keep the analysis focused within daily intervals.
User Inputs: The user can adjust the VWAP timeframe and the linear regression lookback period to tailor the indicator to their preferences.
This script provides a visual representation of the VWAP trend, helping traders identify potential market directions and turning points based on the linear regression of the VWAP.
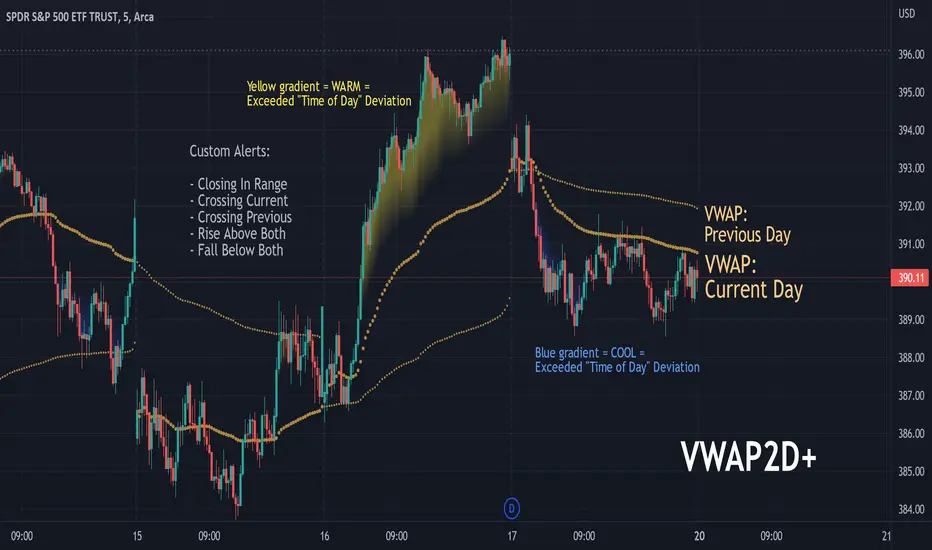
VWAP2D+Displays the current and previous days' VWAP. A useful tool for intraday VWAP traders or to optimize longer term entries or exits.
Features:
Shows levels exceeding the average deviation for the time of day as either warm or cool gradients.
Custom alerts including "Closing In Range" which uses the ATR to determine if the closing value in in the vicinity of the current day's VWAP.
VWAP Candles & MVWAPI was getting sick of the useless VWAP indicator on Trading View and wrote something that is more comprehensive and quite interesting, in fact: candles for VWAP.
It uses the original open/high/low/close and combines them as you would the original hlc3 calculation, but separately, to draw the candles as a shadow of the current price.
There are a few parameters to make it more flexible: source, resolution timeframe, volume length, and moving average length.
Volume Length (default: 5) will determine the candle calculations, cumulative sum of the past X bars.
Moving Average Length (default: 9) will determine the simple moving average (sma) length for the true VWAP (hlc3*volume/cumulative volume)
Source will change the Moving Average VWAP from hlc3 to whatever you want.
Resolution will attune the candles and Moving Average VWAP line to a different periodicity.
Just to be a pain, I also included the old VWAP from Trading View, as a comparison. You can disable it from the Style settings.
Enjoy and happy trading!
VWAP deviation rateInstitutional investors use VWAP to trade in stocks.
We assume that institutional investors do not trade at prices that deviate from VWAP.
I thought that the deviation rate with VWAP draws a normal distribution.
I created an indicator that shows the standard deviation, the moving average of the deviation rate, and the current deviation rate.
The blue line is the current rate.
The red line is a moving average.
Bands have standard deviations 1σ and 2σ.
When the blue line is above the red line, it is a rising trend. The reverse is the downtrend.
It is an outlier if the blue line is outside the band.
Use this indicator in under 15 minutes.
Available in stock trading.
This is especially effective for stocks that institutional investors are participating in.
関投資家は株式の取引にVWAPを使用します。
機関投資家はVWAPから逸脱した価格で取引しないと仮定します。
VWAPとの乖離率は正規分布を描くと思いました。
標準偏差、偏差率の移動平均、および現在の偏差率を示す指標を作成しました。
青い線は現在のレートです。
赤い線は移動平均です。
バンドの標準偏差は1σと2σです。
青い線が赤い線の上にあるとき、それは上昇傾向です。逆は、下降傾向です。
青い線がバンドの外側にある場合、それは異常値です。
15分以下のチャートで利用できます。
株のトレードで利用します。
機関投資家が参加していそうな株式に特に有効です。

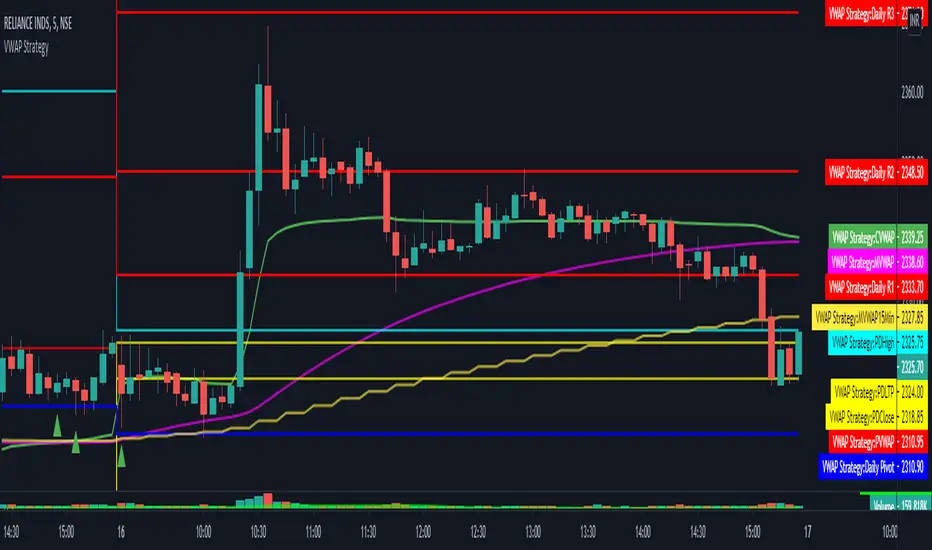
VWAP Strategy by RPThis scrip will help to trade with VWAP strategy.
This is build with following components:
VWAP (Volume Weighted Average Price)
MVWAP (Moving Average of VWAP of 50 period by Default)
Previous Day VWAP.
Pivot Points.
Previous Day High.
Previous Day Low.
Previous Day Close.
For multi time frame analysis this indicator will indicate 15 minutes MVWAP (50 period) in any timeframe chosen by the user.
This will also indicate crossover and crossunder of VWAP over MVWAP, which will help in deciding BUY/SELL.
Hope this helps trader community.
Thanks. Please post your feedback.
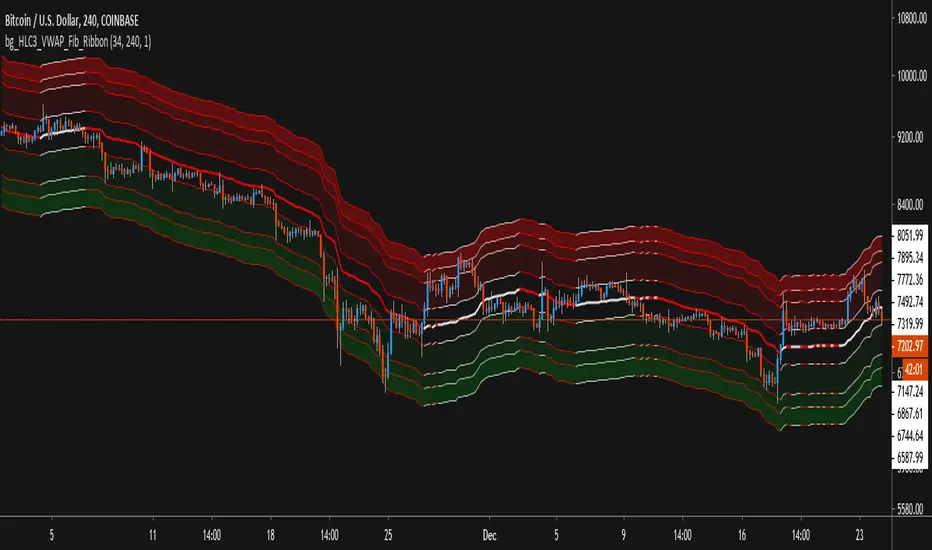
HLC3_VWAP_Fib_RibbonThis Script use Volume Weighted Average Price (VWAP) combined with Fibonacci Deviations of that value as Ribbons to show Support and Resistance levels, as well as estimate good Buy and Sell areas based on the extremity of distance from the central VWAP.
Features:
- Alerts exist for price crossover / crossunder the VWAP value, as well as any of the Fib Ribbon levels.
- Ribbons & Fills can be toggled on/off, leaving just the VWAP as a single line if desired.
- Using the Amplification setting, you can expand or contract the ribbons while maintaining the Fib Ratio, to fit different time-frames and volatility.
- Time-Frame and Length of VWAP can be changed while staying on the same Time-Frame chart view.
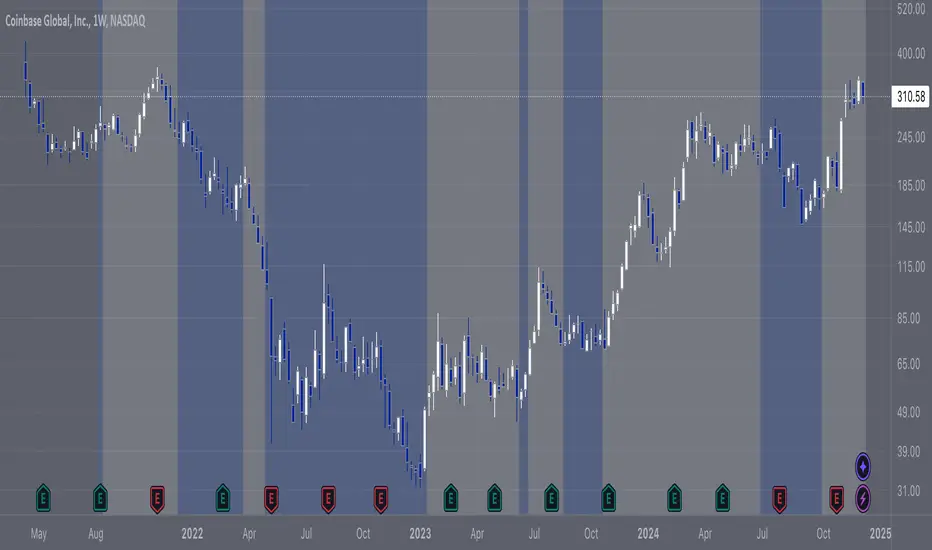
COIN/BTC Trend OscillatorThe COIN/BTC Trend Oscillator is a versatile tool designed to measure and visualize momentum divergences between Coinbase stock ( NASDAQ:COIN ) and Bitcoin ( CRYPTOCAP:BTC ). It helps identify overbought and oversold conditions, while also highlighting potential trend reversals.
Key Features:
VWAP-Based Divergence Analysis:
• Tracks the difference between NASDAQ:COIN and CRYPTOCAP:BTC relative to their respective VWAPs.
• Highlights shifts in momentum between the two assets.
Normalized Oscillator:
• Uses ATR normalization to adapt to different volatility conditions.
• Displays momentum shifts on a standardized scale for better comparability.
Overbought and Oversold Conditions:
• Identifies extremes using customizable thresholds (default: ±80).
• Dynamic background colors for quick visual identification:
• Blue for overbought zones (potential sell).
• White for oversold zones (potential buy).
Rolling Highs and Lows Detection:
• Tracks turning points in the oscillator to identify possible trend reversals.
• Useful for spotting exhaustion or accumulation phases.
Use Case:
This indicator is ideal for trading Coinbase stock relative to Bitcoin’s momentum. It’s especially useful during strong market trends, helping traders time entries and exits based on extremes in relative performance.
Limitations:
• Performance may degrade in choppy or sideways markets.
• Assumes a strong correlation between NASDAQ:COIN and CRYPTOCAP:BTC , which may not hold during independent events.
Pro Tip: Use this oscillator with broader trend confirmation tools like moving averages or RSI to improve reliability. For macro strategies, consider combining with higher timeframes for alignment.
VWAP, AVWAP and MVWAP - Omkar BanneThis indicator plots the VWAP, MVWAP and Anchored VWAP.
AVWAP: Anchored VWAP sometimes doesn't work the way it should. In such times, trades can use the default AVWAP on the right ribbon.
MVWAP: Moving average length can be changed; the default is 10.

Axe and ShieldAxe and Shield measures the distance between the selected Moving Average (T3, EMA, SMA) or Volume Weighted Average Price (VWAP) and high or low of the current bar. It remembers the highest distance over the selected period of time.
It will use a candle's high if the price is above the level.
It will use a candle's low if the price is below it.
Distance is always positive. If it is measured above, the axe will be green. If it is below, it will be red.
The lookback period is how far in the past you want to look for the extreme distance. By default, it is set 24h to the past on always-open markets.
I recommend using with low-period moving averages or VWAP. Sometimes, you might even see double tops on the indicator and reversal price action, which can lead to opening a position. You might as well look for divergences. When the price moves higher but remains closer to MA/VWAP, momentum might be disappearing.
Do a proper backtest to see how useful Axe and Shield's information would be to you.

Volume Weighted Average Range Bands [DW]This is an experimental study designed to identify the underlying trend bias and volatility of an instrument over any custom interval TradingView supports.
First, reset points are established at points where the opening price of the interval changes.
Next, Volume Weighted Average Price (VWAP) is calculated. It is the cumulative sum of typical price times volume divided by the cumulative volume. The cumulation starts over upon each reset point.
After that, Volume Weighted Average Range (VWAR) is calculated. The formula structure is the same as VWAP, except using range rather than typical price.
Lastly, the bands are calculated by multiplying the VWAR by the specified multiplier (approximate Golden Ratio by default) and by 1 through 5, then adding to and subtracting from the VWAP.
Custom Bar Colors are included.

VWAP Diario + VWAP 08:00-12:00 (sin fantasmas) con colorDos vwap. Uno desde el principio del dia. y otro desde las 8 am

VWAP + Candle-Rating SELL (close, robust)This multi‐timeframe setup first scans the 15-minute chart for strong bearish candles (body position in the bottom 40% of their range, i.e. rating 4 or 5) that close below the session VWAP. When it finds the first such “setup” of a trading period, it pins the low of that 15-minute candle as a trigger level and draws a persistent red line there. On the 5-minute chart, the strategy then waits for a similarly strong bearish candle (rating 4 or 5) to close below that marked low—at which point it emits a one‐time SELL signal. The trigger level remains in place (and additional sell signals are locked out) until the market “rescues” the price: a 15-minute bullish candle (rating 1 or 2) closing back above VWAP clears the old setup and allows the next valid bearish 15-minute candle to form a new trigger. This design ensures you only trade the most significant breakdowns after a clear bearish bias and avoids repeated signals until a genuine bullish reversal resets the system.

Key Levels// How it Works \\
Calculating Previous Days, Weeks and Monthly open, high, low, close and vwaps
Plots these levels on your chart
// Settings \\
You can enable/disable any of the levels you want to see
You can also change the amount of bars back the levels are plotted back to
// Use Case \\
These levels are often used in different methods of Technical analysis for support and resistance.
// Suggestions \\
Happy for anyone to make any suggestions on changes which could improve the script,
// Terms \\
Feel free to use the script, If you do use the script could you please just tag me as I am interested to see how people are using it. Good Luck!

Rolling EMAVWAP with Standard Deviation BandsThis is experimental code trying to implement exponentially decreasing weights over time in a simple VWAP.
Also i applied EMA rules when calculating the Standard Deviation Bands.
The script produces results from 1 candle.
There is an "log space" option to neutralize bands shifts when charting in log space - this gives the correct geometrically equal distances on both sides of the emaVWAP.

