Forecast PriceTime Oracle [CHE] Forecast PriceTime Oracle — Prioritizes quality over quantity by using Power Pivots via RSI %B metric to forecast future pivot highs/lows in price and time
Summary
This indicator identifies potential pivot highs and lows based on out-of-bounds conditions in a modified RSI %B metric, then projects future occurrences by estimating time intervals and price changes from historical medians. It provides visual forecasts via diagonal and horizontal lines, tracks achievement with color changes and symbols, and displays a dashboard for statistical overview including hit rates. Signals are robust due to median-based aggregation, which reduces outlier influence, and optional tolerance settings for near-misses, making it suitable for anticipating reversals in ranging or trending markets.
Motivation: Why this design?
Standard pivot detection often lags or generates false signals in volatile conditions, missing the timing of true extrema. This design leverages out-of-bounds excursions in RSI %B to capture "Power Pivots" early—focusing on quality over quantity by prioritizing significant extrema rather than every minor swing—then uses historical deltas in time and price to forecast the next ones, addressing the need for proactive rather than reactive analysis. It assumes that pivot spacing follows statistical patterns, allowing users to prepare entries or exits ahead of confirmation.
What’s different vs. standard approaches?
- Reference baseline: Diverges from traditional ta.pivothigh/low, which require fixed left/right lengths and confirm only after bars close, often too late for dynamic markets.
- Architecture differences:
- Detects extrema during OOB runs rather than post-bar symmetry.
- Aggregates deltas via medians (or alternatives) over a user-defined history, capping arrays to manage resources.
- Applies tolerance thresholds for hit detection, with options for percentage, absolute, or volatility-adjusted (ATR) flexibility.
- Freezes achieved forecasts with visual states to avoid clutter.
- Practical effect: Charts show proactive dashed projections instead of retrospective dots; the dashboard reveals evolving hit rates, helping users gauge reliability over time without manual calculation.
How it works (technical)
The indicator first computes a smoothed RSI over a specified length, then applies Bollinger Bands to derive %B, flagging out-of-bounds below zero or above one hundred as potential run starts. During these runs, it tracks the extreme high or low price and bar index. Upon exit from the OOB state, it confirms the Power Pivot at that extreme and records the time delta (bars since prior) and price change percentage to rolling arrays.
For forecasts, it calculates the median (or selected statistic) of recent deltas, subtracts the confirmation delay (bars from apex to exit), and projects ahead by that adjusted amount. Price targets use the median change applied to the origin pivot value. Lines are drawn from the apex to the target bar and price, with a short horizontal at the endpoint. Arrays store up to five active forecasts, pruning oldest on overflow.
Tolerance adjusts hit checks: for highs, if the high reaches or exceeds the target (adjusted by tolerance); for lows, if the low drops to or below. Once hit, the forecast freezes, changing colors and symbols, and extends the horizontal to the hit bar. Persistent variables maintain last pivot states across bars; arrays initialize empty and grow until capped at history length.
Parameter Guide
Source: Specifies the data input for the RSI computation, influencing how price action is captured. Default is close. For conservative signals in noisy environments, switch to high; using low boosts responsiveness but may increase false positives.
RSI Length: Sets the smoothing period for the RSI calculation, with longer values helping to filter out whipsaws. Default is 32. Opt for shorter lengths like 14 to 21 on faster timeframes for quicker reactions, or extend to 50 or more in strong trends to enhance stability at the cost of some lag.
BB Length: Defines the period for the Bollinger Bands applied to %B, directly affecting how often out-of-bounds conditions are triggered. Default is 20. Align it with the RSI length: shorter periods detect more potential runs but risk added noise, while longer ones provide better filtering yet might overlook emerging extrema.
BB StdDev: Controls the multiplier for the standard deviation in the bands, where wider settings reduce false out-of-bounds alerts. Default is 2.0. Narrow it to 1.5 for highly volatile assets to catch more signals, or broaden to 2.5 or higher to emphasize only major movements.
Show Price Forecast: Enables or disables the display of diagonal and target lines along with their updates. Default is true. Turn it off for simpler chart views, or keep it on to aid in trade planning.
History Length: Determines the number of recent pivot samples used for median-based statistics, where more history leads to smoother but potentially less current estimates. Default is 50. Start with a minimum of 5 to build data; limit to 100 to 200 to prevent outdated regimes from skewing results.
Max Lookahead: Limits the number of bars projected forward to avoid overly extended lines. Default is 500. Reduce to 100 to 200 for intraday focus, or increase for longer swing horizons.
Stat Method: Selects the aggregation technique for time and price deltas: Median for robustness against outliers, Trimmed Mean (20%) for a balanced trim of extremes, or 75th Percentile for a conservative upward tilt. Default is Median. Use Median for even distributions; switch to Percentile when emphasizing potential upside in trending conditions.
Tolerance Type: Chooses the approach for flexible hit detection: None for exact matches, Percentage for relative adjustments, Absolute for fixed point offsets, or ATR for scaling with volatility. Default is None. Begin with Percentage at 0.5 percent for currency pairs, or ATR for adapting to cryptocurrency swings.
Tolerance %: Provides the relative buffer when using Percentage mode, forgiving small deviations. Default is 0.5. Set between 0.2 and 1.0 percent; higher values accommodate gaps but can overstate hit counts.
Tolerance Points: Establishes a fixed offset in price units for Absolute mode. Default is 0.0010. Tailor to the asset, such as 0.0001 for forex pairs, and validate against past wick behavior.
ATR Length: Specifies the period for the Average True Range in dynamic tolerance calculations. Default is 14. This is the standard setting; shorten to 10 to reflect more recent volatility.
ATR Multiplier: Adjusts the ATR scale for tolerance width in ATR mode. Default is 0.5. Range from 0.3 for tighter precision to 0.8 for greater leniency.
Dashboard Location: Positions the summary table on the chart. Default is Bottom Right. Consider Top Left for better visibility on mobile devices.
Dashboard Size: Controls the text scaling for dashboard readability. Default is Normal. Choose Tiny for dense overlays or Large for detailed review sessions.
Text/Frame Color: Sets the color scheme for dashboard text and borders. Default is gray. Align with your chart theme, opting for lighter shades on dark backgrounds.
Reading & Interpretation
Forecast lines appear as dashed diagonals from confirmed pivots to projected targets, with solid horizontals at endpoints marking price levels. Open targets show a target symbol (🎯); achieved ones switch to a trophy symbol (🏆) in gray, with lines fading to gray. The dashboard summarizes median time/price deltas, sample counts, and hit rates—rising rates indicate improving forecast alignment. Colors differentiate highs (red) from lows (lime); frozen states signal validated projections.
Practical Workflows & Combinations
- Trend following: Enter long on low forecast hits during uptrends (higher highs/lower lows structure); filter with EMA crossovers to ignore counter-trend signals.
- Reversal setups: Short above high projections in overextended rallies; use volume spikes as confirmation to reduce false breaks.
- Exits/Stops: Trail stops to prior pivot lows; conservative on low hit rates (below 50%), aggressive above 70% with tight tolerance.
- Multi-TF: Apply on 1H for entries, 4H for time projections; combine with Ichimoku clouds for confluence on targets.
- Risk management: Position size inversely to delta uncertainty (wider history = smaller bets); avoid low-liquidity sessions.
Behavior, Constraints & Performance
Confirmation occurs on OOB exit, so live-bar pivots may adjust until close, but projections update only on events to minimize repaint. No security or HTF calls, so no external lookahead issues. Arrays cap at history length with shifts; forecasts limited to five active, pruning FIFO. Loops iterate over small fixed sizes (e.g., up to 50 for stats), efficient on most hardware. Max lines/labels at 500 prevent overflow.
Known limits: Sensitive to OOB parameter tuning—too tight misses runs; assumes stationary pivot stats, which may shift in regime changes like low vol. Gaps or holidays distort time deltas.
Sensible Defaults & Quick Tuning
Defaults suit forex/crypto on 1H–4H: RSI 32/BB 20 for balanced detection, Median stats over 50 samples, None tolerance for exactness.
- Too many false runs: Increase BB StdDev to 2.5 or RSI Length to 50 for filtering.
- Lagging forecasts: Shorten History Length to 20; switch to 75th Percentile for forward bias.
- Missed near-hits: Enable Percentage tolerance at 0.3% to capture wicks without overcounting.
- Cluttered charts: Reduce Max Lookahead to 200; disable dashboard on lower TFs.
What this indicator is—and isn’t
This is a forecasting visualization layer for pivot-based analysis, highlighting statistical projections from historical patterns. It is not a standalone system—pair with price action, volume, and risk rules. Not predictive of all turns; focuses on OOB-derived extrema, ignoring volume or news impacts.
Disclaimer
The content provided, including all code and materials, is strictly for educational and informational purposes only. It is not intended as, and should not be interpreted as, financial advice, a recommendation to buy or sell any financial instrument, or an offer of any financial product or service. All strategies, tools, and examples discussed are provided for illustrative purposes to demonstrate coding techniques and the functionality of Pine Script within a trading context.
Any results from strategies or tools provided are hypothetical, and past performance is not indicative of future results. Trading and investing involve high risk, including the potential loss of principal, and may not be suitable for all individuals. Before making any trading decisions, please consult with a qualified financial professional to understand the risks involved.
By using this script, you acknowledge and agree that any trading decisions are made solely at your discretion and risk.
Do not use this indicator on Heikin-Ashi, Renko, Kagi, Point-and-Figure, or Range charts, as these chart types can produce unrealistic results for signal markers and alerts.
Best regards and happy trading
Chervolino
Buscar en scripts para "Trailing stop"

Adaptive Trend Breaks Adaptive Trend Breaks
## WHAT IT DOES
This script is a modified and enhanced version of "Trendline Breakouts With Targets" concept by ChartPrime.
Adaptive Trend Breaks (ATB) is a trendline breakout system optimized for scalping liquid futures contracts. The indicator automatically draws dynamic support and resistance trendlines based on pivot points, then generates trade signals when price breaks through these levels with confirmation filters. It includes automated target and stop-loss placement with real-time P&L tracking in dollars.
## HOW IT WORKS
**Trendline Detection Method:**
The indicator uses pivot high/low detection to identify significant price turning points. When a new pivot forms, it calculates the slope between consecutive pivots to draw dynamic trendlines. These lines extend forward based on the established trend angle, creating actionable support and resistance zones.
**Band System:**
Around each trendline, the script creates a "band" using a volatility-adjusted calculation: `ATR(14) * 0.2 * bandwidth multiplier / 2`. This adaptive band accounts for current market conditions - wider during volatile periods, tighter during quiet markets.
**Breakout Logic:**
A breakout signal triggers when:
1. Price closes beyond the trendline + band zone
2. Volume exceeds the 20-period moving average by your set multiplier (default 1.2x)
3. Price is within Regular Trading Hours (9:30-16:00 EST) if session filter enabled
4. Current ATR meets minimum volatility threshold (prevents trading dead markets)
**Target & Stop Calculation:**
Upon breakout confirmation:
- **Entry**: Trendline breach point
- **Target**: Entry ± (bandwidth × target multiplier) - default 8x for quick scalps
- **Stop**: Entry ± (bandwidth × stop multiplier) - default 8x for 1:1 risk/reward
- Multipliers adjust automatically to market volatility through the ATR-based band
**P&L Conversion:**
The script converts point movements to dollars using:
```
Dollar P&L = (Price Points × Contract Point Value × Quantity)
```
For example, a 10-point NQ move with 2 contracts = 10 × $20 × 2 = $400
## HOW TO USE IT
**Setup:**
1. Select your instrument (NQ/ES/YM/RTY) - point values auto-configure
2. Set contract quantity for accurate dollar P&L
3. Choose pivot period (lower = more signals but more noise, default 5 for scalping)
4. Adjust bandwidth multiplier if trendlines are too tight/loose (1-5 range)
**Filters Configuration:**
- **Volume Filter**: Requires breakout volume > moving average × multiplier. Increase multiplier (1.5-2.0) for higher conviction trades
- **Session Filter**: Enable to trade only RTH. Disable for 24-hour trading
- **ATR Filter**: Prevents signals during low volatility. Increase minimum % for more active markets only
**Risk Management:**
- Set target/stop multipliers based on your risk tolerance
- 8x bandwidth = approximately 1:1 risk/reward for most liquid futures
- Enable trailing stops for trend-following approach (moves stop to protect profits)
- Adjust line length to see targets further into the future
**Statistics Table:**
- Choose timeframe to analyze: all-time, today, this week, custom days
- Monitor win rate, profit factor, and net P&L in dollars
- Track long vs short performance separately
- See real-time unrealized P&L on active trades
**Reading Signals:**
- **Green triangle below bar** = Long breakout (resistance broken)
- **Red triangle above bar** = Short breakout (support broken)
- **White dashed line** = Entry price
- **Orange line** = Take profit target with dollar value
- **Red line** = Stop loss with dollar value
- **Green checkmark (✓)** = Target hit, winning trade
- **Red X (✗)** = Stop hit, losing trade
## WHAT IT DOES NOT DO
**Limitations to Understand:**
- Does not predict future trendline formations - it reacts to breakouts after they occur
- Historical trendlines disappear after breakout (not kept on chart for clarity)
- Requires sufficient volatility - may not signal in extremely quiet markets
- Volume filter requires exchange volume data (not available on all symbols)
- Statistics are indicator-based simulations, not actual trading results
- Does not account for slippage, commissions, or order fills
## BEST PRACTICES
**Recommended Settings by Market:**
- **NQ (Nasdaq)**: Default settings work well, consider volume multiplier 1.3-1.5
- **ES (S&P 500)**: Slightly slower, try period 7-8, volume 1.2
- **YM (Dow)**: Lower volatility, reduce bandwidth to 1.5-2
- **RTY (Russell)**: Higher volatility, increase bandwidth to 3-4
**Risk Management:**
- Never risk more than 2-3% of account per trade
- Use contract quantity calculator: Max Risk $ ÷ (Stop Distance × Point Value)
- Start with 1 contract while learning the system
- Backtest your specific timeframe and instrument before live trading
**Optimization Tips:**
- Increase pivot period (7-10) for fewer but higher-quality signals
- Raise volume multiplier (1.5-2.0) in choppy markets
- Lower target/stop multipliers (5-6x) for tighter profit taking
- Use trailing stops in strong trending conditions
- Disable session filter for overnight gaps and Asia session moves
## TECHNICAL DETAILS
**Key Calculations:**
- Pivot Detection: `ta.pivothigh(high, period, period/2)` and `ta.pivotlow(low, period, period/2)`
- Slope Calculation: `(newPivot - oldPivot) / (newTime - oldTime)`
- Adaptive Band: `min(ATR(14) * 0.2, close * 0.002) * multiplier / 2`
- Breakout Confirmation: Price crosses trendline + 10% of band threshold
**Data Requirements:**
- Minimum bars in view: 500 for proper pivot calculation
- Volume data required for volume filter accuracy
- Intraday timeframes recommended (1min - 15min) for scalping
- Works on any timeframe but optimized for fast execution
**Performance Metrics:**
All statistics calculate based on indicator signals:
- Tracks every signal as a trade from entry to TP/SL
- P&L in actual contract dollar values
- Win rate = (Winning trades / Total trades) × 100
- Profit factor = Gross profit / Gross loss
- Separates long/short performance for bias analysis
## IDEAL FOR
- Futures scalpers and day traders
- Traders who prefer visual trendline breakouts
- Those wanting automated TP/SL placement
- Traders tracking performance in dollar terms
- Multiple timeframe analysis (compare 1min vs 5min signals)
## NOT SUITABLE FOR
- Swing trading (targets too close)
- Stocks/forex without modifying point values
- Extremely low timeframes (<30 seconds) - too much noise
- Markets without volume data if using volume filter
- Illiquid contracts (signals may not execute at shown prices)
---
**Settings Summary:**
- Core: Period, bandwidth, extension, trendline style
- Filters: Volume, RTH session, ATR volatility
- Risk: R:R ratio, target/stop multipliers, trailing stop
- Display: Stats table position, size, colors
- Stats: Timeframe selection (all-time to custom days)
**License:** This indicator is published open-source under Mozilla Public License 2.0. You may use and modify the code with proper attribution.
**Disclaimer:** This indicator is for educational purposes. Past performance does not guarantee future results. Always practice proper risk management and test thoroughly before live trading.
---
## CREDITS & ATTRIBUTION
This script builds upon the "Trendline Breakouts With Targets" concept by ChartPrime with significant enhancements:
**Major Improvements Added:**
- **Futures-Specific Calculations**: Automated dollar P&L conversion using actual contract point values (NQ=$20, ES=$50, YM=$5, RTY=$50)
- **Advanced Statistics Engine**: Comprehensive performance tracking with customizable timeframe analysis (today, week, month, custom ranges)
- **Multi-Layer Filtering System**: Volume confirmation, RTH session filter, and ATR volatility filter to reduce false signals
- **Professional Trade Management**: Enhanced visual trade tracking with separate TP/SL lines, dollar value labels, and optional trailing stops
- **Optimized for Scalping**: Faster pivot periods (5 vs 10), tighter bands, and reduced extension bars for quick entries
Original trendline detection methodology by ChartPrime - used with modification under Mozilla Public License 2.0.

RSI Donchian Channel [DCAUT]█ RSI Donchian Channel
📊 ORIGINALITY & INNOVATION
The RSI Donchian Channel represents an important synthesis of two complementary analytical frameworks: momentum oscillators and breakout detection systems. This indicator addresses a common limitation in traditional RSI analysis by replacing fixed overbought/oversold thresholds with adaptive zones derived from historical RSI extremes.
Key Enhancement:
Traditional RSI analysis relies on static threshold levels (typically 30/70), which may not adequately reflect changing market volatility regimes. This indicator adapts the reference zones dynamically based on the actual RSI behavior over the lookback period, helping traders identify meaningful momentum extremes relative to recent price action rather than arbitrary fixed levels.
The implementation combines the proven momentum measurement capabilities of RSI with Donchian Channel's breakout detection methodology, creating a framework that identifies both momentum exhaustion points and potential continuation signals through the same analytical lens.
📐 MATHEMATICAL FOUNDATION
Core Calculation Process:
Step 1: RSI Calculation
The Relative Strength Index measures momentum by comparing the magnitude of recent gains to recent losses:
Calculate price changes between consecutive periods
Separate positive changes (gains) from negative changes (losses)
Apply selected smoothing method (RMA standard, also supports SMA, EMA, WMA) to both gain and loss series
Compute Relative Strength (RS) as the ratio of smoothed gains to smoothed losses
Transform RS into bounded 0-100 scale using the formula: RSI = 100 - (100 / (1 + RS))
Step 2: Donchian Channel Application
The Donchian Channel identifies the highest and lowest RSI values within the specified lookback period:
Upper Channel: Highest RSI value over the lookback period, represents the recent momentum peak
Lower Channel: Lowest RSI value over the lookback period, represents the recent momentum trough
Middle Channel (Basis): Average of upper and lower channels, serves as equilibrium reference
Channel Width Dynamics:
The distance between upper and lower channels reflects RSI volatility. Wide channels indicate high momentum variability, while narrow channels suggest momentum consolidation and potential breakout preparation. The indicator monitors channel width over a 100-period window to identify squeeze conditions that often precede significant momentum shifts.
📊 COMPREHENSIVE SIGNAL ANALYSIS
Primary Signal Categories:
Breakout Signals:
Upper Breakout: RSI crosses above the upper channel, indicates momentum reaching new relative highs and potential trend continuation, particularly significant when accompanied by price confirmation
Lower Breakout: RSI crosses below the lower channel, suggests momentum reaching new relative lows and potential trend exhaustion or reversal setup
Breakout strength is enhanced when the channel is narrow prior to the breakout, indicating a transition from consolidation to directional movement
Mean Reversion Signals:
Upper Touch Without Breakout: RSI reaches the upper channel but fails to break through, may indicate momentum exhaustion and potential reversal opportunity
Lower Touch Without Breakout: RSI reaches the lower channel without breakdown, suggests potential bounce as momentum reaches oversold extremes
Return to Basis: RSI moving back toward the middle channel after touching extremes signals momentum normalization
Trend Strength Assessment:
Sustained Upper Channel Riding: RSI consistently remains near or above the upper channel during strong uptrends, indicates persistent bullish momentum
Sustained Lower Channel Riding: RSI stays near or below the lower channel during strong downtrends, reflects persistent bearish pressure
Basis Line Position: RSI position relative to the middle channel helps identify the prevailing momentum bias
Channel Compression Patterns:
Squeeze Detection: Channel width narrowing to 100-period lows indicates momentum consolidation, often precedes significant directional moves
Expansion Phase: Channel widening after a squeeze confirms the initiation of a new momentum regime
Persistent Narrow Channels: Extended periods of tight channels suggest market indecision and accumulation/distribution phases
🎯 STRATEGIC APPLICATIONS
Trend Continuation Strategy:
This approach focuses on identifying and trading momentum breakouts that confirm established trends:
Identify the prevailing price trend using higher timeframe analysis or trend-following indicators
Wait for RSI to break above the upper channel in uptrends (or below the lower channel in downtrends)
Enter positions in the direction of the breakout when price action confirms the momentum shift
Place protective stops below the recent swing low (long positions) or above swing high (short positions)
Target profit levels based on prior swing extremes or use trailing stops to capture extended moves
Exit when RSI crosses back through the basis line in the opposite direction
Mean Reversion Strategy:
This method capitalizes on momentum extremes and subsequent corrections toward equilibrium:
Monitor for RSI reaching the upper or lower channel boundaries
Look for rejection signals (price reversal patterns, volume divergence) when RSI touches the channels
Enter counter-trend positions when RSI begins moving back toward the basis line
Use the basis line as the initial profit target for mean reversion trades
Implement tight stops beyond the channel extremes to limit risk on failed reversals
Scale out of positions as RSI approaches the basis line and closes the position when RSI crosses the basis
Breakout Preparation Strategy:
This approach positions traders ahead of potential volatility expansion from consolidation phases:
Identify squeeze conditions when channel width reaches 100-period lows
Monitor price action for consolidation patterns (triangles, rectangles, flags) during the squeeze
Prepare conditional orders for breakouts in both directions from the consolidation
Enter positions when RSI breaks out of the narrow channel with expanding width
Use the channel width expansion as a confirmation signal for the breakout's validity
Manage risk with stops just inside the opposite channel boundary
Multi-Timeframe Confluence Strategy:
Combining RSI Donchian Channel analysis across multiple timeframes can improve signal reliability:
Identify the primary trend direction using a higher timeframe RSI Donchian Channel (e.g., daily or weekly)
Use a lower timeframe (e.g., 4-hour or hourly) to time precise entry points
Enter long positions when both timeframes show RSI above their respective basis lines
Enter short positions when both timeframes show RSI below their respective basis lines
Avoid trades when timeframes provide conflicting signals (e.g., higher timeframe below basis, lower timeframe above)
Exit when the higher timeframe RSI crosses its basis line in the opposite direction
Risk Management Guidelines:
Effective risk management is essential for all RSI Donchian Channel strategies:
Position Sizing: Calculate position sizes based on the distance between entry point and stop loss, limiting risk to 1-2% of capital per trade
Stop Loss Placement: For breakout trades, place stops just inside the opposite channel boundary; for mean reversion trades, use stops beyond the channel extremes
Profit Targets: Use the basis line as a minimum target for mean reversion trades; for trend trades, target prior swing extremes or use trailing stops
Channel Width Context: Increase position sizes during narrow channels (lower volatility) and reduce sizes during wide channels (higher volatility)
Correlation Awareness: Monitor correlations between traded instruments to avoid over-concentration in similar setups
📋 DETAILED PARAMETER CONFIGURATION
RSI Source:
Defines the price data series used for RSI calculation:
Close (Default): Standard choice providing end-of-period momentum assessment, suitable for most trading styles and timeframes
High-Low Average (HL2): Reduces the impact of closing auction dynamics, useful for markets with significant end-of-day volatility
High-Low-Close Average (HLC3): Provides a more balanced view incorporating the entire period's range
Open-High-Low-Close Average (OHLC4): Offers the most comprehensive price representation, helpful for identifying overall period sentiment
Strategy Consideration: Use Close for end-of-period signals, HL2 or HLC3 for intraday volatility reduction, OHLC4 for capturing full period dynamics
RSI Length:
Controls the number of periods used for RSI calculation:
Short Periods (5-9): Highly responsive to recent price changes, produces more frequent signals with increased false signal risk, suitable for short-term trading and volatile markets
Standard Period (14): Widely accepted default balancing responsiveness with stability, appropriate for swing trading and intermediate-term analysis
Long Periods (21-28): Produces smoother RSI with fewer signals but more reliable trend identification, better for position trading and reducing noise in choppy markets
Optimization Approach: Test different lengths against historical data for your specific market and timeframe, consider using longer periods in ranging markets and shorter periods in trending markets
RSI MA Type:
Determines the smoothing method applied to price changes in RSI calculation:
RMA (Relative Moving Average - Default): Wilder's original smoothing method providing stable momentum measurement with gradual response to changes, maintains consistency with classical RSI interpretation
SMA (Simple Moving Average): Treats all periods equally, responds more quickly to changes than RMA but may produce more whipsaws in volatile conditions
EMA (Exponential Moving Average): Weights recent periods more heavily, increases responsiveness at the cost of potential noise, suitable for traders prioritizing early signal generation
WMA (Weighted Moving Average): Applies linear weighting favoring recent data, offers a middle ground between SMA and EMA responsiveness
Selection Guidance: Maintain RMA for consistency with traditional RSI analysis, use EMA or WMA for more responsive signals in fast-moving markets, apply SMA for maximum simplicity and transparency
DC Length:
Specifies the lookback period for Donchian Channel calculation on RSI values:
Short Periods (10-14): Creates tight channels that adapt quickly to changing momentum conditions, generates more frequent trading signals but increases sensitivity to short-term RSI fluctuations
Standard Period (20): Balances channel responsiveness with stability, aligns with traditional Bollinger Bands and moving average periods, suitable for most trading styles
Long Periods (30-50): Produces wider, more stable channels that better represent sustained momentum extremes, reduces signal frequency while improving reliability, appropriate for position traders and higher timeframes
Calibration Strategy: Match DC length to your trading timeframe (shorter for day trading, longer for swing trading), test channel width behavior during different market regimes, consider using adaptive periods that adjust to volatility conditions
Market Adaptation: Use shorter DC lengths in trending markets to capture momentum shifts earlier, apply longer periods in ranging markets to filter noise and focus on significant extremes
Parameter Combination Recommendations:
Scalping/Day Trading: RSI Length 5-9, DC Length 10-14, EMA or WMA smoothing for maximum responsiveness
Swing Trading: RSI Length 14, DC Length 20, RMA smoothing for balanced analysis (default configuration)
Position Trading: RSI Length 21-28, DC Length 30-50, RMA or SMA smoothing for stable signals
High Volatility Markets: Longer RSI periods (21+) with standard DC length (20) to reduce noise
Low Volatility Markets: Standard RSI length (14) with shorter DC length (10-14) to capture subtle momentum shifts
📈 PERFORMANCE ANALYSIS & COMPETITIVE ADVANTAGES
Adaptive Threshold Mechanism:
Unlike traditional RSI analysis with fixed 30/70 thresholds, this indicator's Donchian Channel approach provides several improvements:
Context-Aware Extremes: Overbought/oversold levels adjust automatically based on recent momentum behavior rather than arbitrary fixed values
Volatility Adaptation: In low volatility periods, channels narrow to reflect tighter momentum ranges; in high volatility, channels widen appropriately
Market Regime Recognition: The indicator implicitly adapts to different market conditions without manual threshold adjustments
False Signal Reduction: Adaptive channels help reduce premature reversal signals that often occur with fixed thresholds during strong trends
Signal Quality Characteristics:
The indicator's dual-purpose design provides distinct advantages for different trading objectives:
Breakout Trading: Channel boundaries offer clear, objective breakout levels that update dynamically, eliminating the ambiguity of when momentum becomes "too high" or "too low"
Mean Reversion: The basis line provides a natural profit target for reversion trades, representing the midpoint of recent momentum extremes
Trend Strength: Persistent channel boundary riding offers an objective measure of trend strength without additional indicators
Consolidation Detection: Channel width analysis provides early warning of potential volatility expansion from compression phases
Comparative Analysis:
When compared to traditional RSI implementations and other momentum frameworks:
vs. Fixed Threshold RSI: Provides market-adaptive reference levels rather than static values, helping to reduce false signals during trending markets where RSI can remain "overbought" or "oversold" for extended periods
vs. RSI Bollinger Bands: Offers clearer breakout signals and more intuitive extreme identification through actual high/low boundaries rather than statistical standard deviations
vs. Stochastic Oscillator: Maintains RSI's momentum measurement advantages (unbounded calculation avoiding scale compression) while adding the breakout detection capabilities of Donchian Channels
vs. Standard Donchian Channels: Applies breakout methodology to momentum space rather than price, providing earlier signals of potential trend changes before price breakouts occur
Performance Characteristics:
The indicator exhibits specific behavioral patterns across different market conditions:
Trending Markets: Excels at identifying momentum continuation through channel breakouts, RSI tends to ride one channel boundary during strong trends, providing trend confirmation
Ranging Markets: Channel width narrows during consolidation, offering early preparation signals for potential breakout trading opportunities
High Volatility: Channels widen to reflect increased momentum variability, automatically adjusting signal sensitivity to match market conditions
Low Volatility: Channels contract, making the indicator more sensitive to subtle momentum shifts that may be significant in calm market environments
Transition Periods: Channel squeezes often precede major trend changes, offering advance warning of potential regime shifts
Limitations and Considerations:
Users should be aware of certain operational characteristics:
Lookback Dependency: Channel boundaries depend entirely on the lookback period, meaning the indicator has no predictive element beyond identifying current momentum relative to recent history
Lag Characteristics: As with all moving average-based indicators, RSI calculation introduces lag, and channel boundaries update only as new extremes occur within the lookback window
Range-Bound Sensitivity: In extremely tight ranges, channels may become very narrow, potentially generating excessive signals from minor momentum fluctuations
Trending Persistence: During very strong trends, RSI may remain at channel extremes for extended periods, requiring patience for mean reversion setups or commitment to trend-following approaches
No Absolute Levels: Unlike traditional RSI, this indicator provides no fixed reference points (like 50), making it less suitable for strategies that depend on absolute momentum readings
USAGE NOTES
This indicator is designed for technical analysis and educational purposes to help traders understand momentum dynamics and identify potential trading opportunities. The RSI Donchian Channel has limitations and should not be used as the sole basis for trading decisions.
Important considerations:
Performance varies significantly across different market conditions, timeframes, and instruments
Historical signal patterns do not guarantee future results, as market behavior continuously evolves
Effective use requires understanding of both RSI momentum principles and Donchian Channel breakout concepts
Risk management practices (stop losses, position sizing, diversification) are essential for any trading application
Consider combining with additional analytical tools such as volume analysis, price action patterns, or trend indicators for confirmation
Backtest thoroughly on your specific instruments and timeframes before live trading implementation
Be aware that optimization on historical data may lead to curve-fitting and poor forward performance
The indicator performs best when used as part of a comprehensive trading methodology that incorporates multiple forms of market analysis, sound risk management, and realistic expectations about win rates and drawdowns.

KCandle Strategy 1.0# KCandle Strategy 1.0 - Trading Strategy Description
## Overview
The **KCandle Strategy** is an advanced Pine Script trading system based on bullish and bearish engulfing candlestick patterns, enhanced with sophisticated risk management and position optimization features.
## Core Logic
### Entry Signal Generation
- **Pattern Recognition**: Detects bullish and bearish engulfing candlestick formations
- **EMA Filter**: Uses a customizable EMA (default 25) to filter trades in the direction of the trend
- **Entry Levels**:
- **Long entries** at 25% of the candlestick range from the low
- **Short entries** at 75% of the candlestick range from the low
- **Signal Validation**: Orange candlesticks indicate valid setup conditions
### Risk Management System
#### 1. **Stop Loss & Take Profit**
- Configurable stop loss in pips
- Risk-reward ratio setting (default 2:1)
- Visual representation with colored lines and labels
#### 2. **Break-Even Management**
- Automatically moves stop loss to break-even when specified R:R is reached
- Customizable break-even offset for added protection
- Prevents losing trades after reaching profitability
#### 3. **Trailing Stop System**
- **Activation Trigger**: Activates when position reaches specified R:R level
- **Distance Control**: Maintains trailing stop at defined distance from entry
- **Step Management**: Moves stop loss forward in incremental R steps
- **Dynamic Protection**: Locks in profits while allowing for continued upside
### Advanced Features
#### Position Management
- **Pyramiding Support**: Optional multiple position entries with size reduction
- **Order Expiration**: Pending orders automatically cancel after specified bars
- **Position Sizing**: Percentage-based allocation with pyramid level adjustments
#### Visual Interface
- **Real-time Monitoring**: Comprehensive information panel with all strategy metrics
- **Historical Tracking**: Visual representation of past trades and levels
- **Color-coded Indicators**: Different colors for break-even, trailing, and standard stops
- **Debug Options**: Optional labels for troubleshooting and optimization
## Key Parameters
### Basic Settings
- **EMA Length**: Trend filter period
- **Stop Loss**: Risk per trade in pips
- **Risk/Reward**: Target profit ratio
- **Order Validity**: Duration of pending orders
### Risk Management
- **Break-Even R:R**: Profit level to trigger break-even
- **Trailing Activation**: R:R level to start trailing
- **Trailing Distance**: Stop distance from entry when trailing
- **Trailing Step**: Increment for stop loss advancement
## Strategy Benefits
1. **Objective Entry Signals**: Based on proven candlestick patterns
2. **Trend Alignment**: EMA filter ensures trades align with market direction
3. **Robust Risk Control**: Multiple layers of protection (SL, BE, Trailing)
4. **Profit Optimization**: Trailing stops maximize winning trade potential
5. **Flexibility**: Extensive customization options for different market conditions
6. **Visual Clarity**: Complete visual feedback for trade management
## Ideal Use Cases
- **Swing Trading**: Medium-term positions with trend-following approach
- **Breakout Trading**: Capturing momentum from engulfing patterns
- **Risk-Conscious Trading**: Suitable for traders prioritizing capital preservation
- **Multi-Timeframe**: Adaptable to various timeframes and instruments
---
*The KCandle Strategy combines traditional technical analysis with modern risk management techniques, providing traders with a comprehensive tool for systematic market participation.*

Pullback & ATR Trailing Strategy※日本語は英文の次に記載あります。
Overview
This indicator combines short-term RSI pullback/rebound signals with long-term RSI divergence to visualize potential buy and sell opportunities.
It also plots ATR-based trailing stops and partial take-profit lines, making it suitable for day trading and short-term trading.
Alerts are triggered when signal conditions are met.
Key Features
Detect short-term RSI pullbacks/rebounds (default 6 periods)
Detect divergences on long-term RSI
Visualize buy/sell signals with labels
Display ATR-based trailing stop and partial take-profit lines
Trigger alerts when conditions are met
Settings Explanation
Short-term RSI Length (rsiShortLen) Period for short-term RSI used to detect pullbacks or rebounds
Pullback Threshold (levelLow) RSI level below which a buy signal is considered
Rebound Threshold (levelHigh) RSI level above which a sell signal is considered
Long-term Timeframe (longTF) Timeframe used for divergence detection
Long-term RSI Length (longRSILen) Period for RSI on the long-term timeframe, used for divergence detection
Pivot Width Left / Right (pivotLeft / pivotRight)
Determines how we detect swing highs/lows (peaks and valleys).
For example, with pivotLeft=3 and pivotRight=3, a bar is considered a swing high if it is higher than the 3 bars to its left and 3 bars to its right.
Larger numbers detect only bigger swings, smaller numbers also detect smaller swings.
ATR Length (atrLen) Period for ATR calculation for trailing stops
ATR Multiplier (atrMult) Multiplier for ATR to calculate trailing stop distance
Partial Take-Profit Multiplier (tpMult) Multiplier to calculate half-profit level based on swing amplitude
Green line (Long Trail / translucent green)
ATR-based trailing stop line for long positions.
Used as a stop-loss or trailing stop for open buy trades.
Dark green line shows partial take-profit (TP), translucent green shows trailing stop level.
Red line (Short Trail / translucent red)
ATR-based trailing stop line for short positions.
Used as a stop-loss or trailing stop for open sell trades.
Dark red line shows partial take-profit (TP), translucent red shows trailing stop level.
Note: TP lines indicate partial take-profit targets, while ATR trailing lines indicate stop-loss/trailing stop levels if the price moves against the position.
日本語説明ーーーーーーーーーーーーーーーーーーーーーーーーーーーー
概要
このインジケーターは、短期RSIの押し目/戻りシグナルと、長期足RSIによるダイバージェンスを組み合わせて、買い・売りのチャンスを可視化します。
さらに、ATRベースのトレールストップラインや半分利確ラインも表示し、デイトレードや短期トレードに最適化しています。
シグナル条件に一致した場合にアラートも作動します。
主な機能
短期RSI(デフォルト6期間)で押し目・戻りを検出
長期足RSIでのダイバージェンスを検出
BUY/SELLラベルでシグナルを視覚化
ATRベースのトレールライン・半分利確ラインを表示
条件一致時にアラート発動
各設定の説明
短期RSI期間 (rsiShortLen) デイトレ用の短期RSIの期間。押し目や戻りのシグナルに使用
押し目閾値 (levelLow) RSIが下回ったら買いシグナル判定に使用
戻り閾値 (levelHigh) RSIが上回ったら売りシグナル判定に使用
長期足 (longTF) ダイバージェンス判定用の長期足の時間軸
長期RSI期間 (longRSILen) 長期足で計算するRSIの期間。ダイバージェンス判定に使用
左右ピボット幅 (pivotLeft / pivotRight) 高値や安値を「スイングの山・谷」として判定する時に使う幅です。
例えば pivotLeft=3, pivotRight=3 の場合、「左に3本、右に3本のローソク足より高い/低い点」をスイングの頂点や底と見なします。
数値を大きくすると大きな波だけを拾い、小さくすると小さな波も拾いやすくなります。
ATR期間 (atrLen) トレールライン計算用ATRの期間
ATR倍率 (atrMult) トレールラインの距離をATRに掛ける倍率
半分利確倍率 (tpMult) 押し目/戻り幅に対して半分利確ラインを設定する倍率
緑の線(Long Trail / 半透明緑)
ATRベースのトレールストップラインです。
買いポジション中の損切り目安やトレーリングストップとして使います。
緑の濃い線は半分利確ライン(TP)、薄い緑の線はトレールストップの位置を示します。
赤い線(Short Trail / 半透明赤)
ATRベースのトレールストップラインです。
売りポジション中の損切り目安やトレーリングストップとして使います。
赤の濃い線は半分利確ライン(TP)、薄い赤の線はトレールストップの位置を示します。
補足:TP(Take Profit)線は半分利確の目安で、ATRトレールラインはポジションが逆行した時の損切り目安です。

Gann Fan Strategy [KedarArc Quant]Description
A single-concept, rule-based strategy that trades around a programmatic Gann Fan.
It anchors to a swing (or a manual point), builds 1×1 and related fan lines numerically, and triggers entries when price interacts with the 1×1 (breakout or bounce). Management is done entirely with the fan structure (next/previous line) plus optional ATR trailing.
What TV indicators are used
* Pivots: `ta.pivothigh/ta.pivotlow` to confirm swing highs/lows for anchor selection.
* ATR: `ta.atr` only to scale the 1×1 slope (optional) and for an optional trailing stop.
* EMA: `ta.ema` as a trend filter (e.g., only long above the EMA, short below).
No RSI/MACD/Stoch/Heikin/etc. The logic is one coherent framework: Gann price–time geometry, with ATR as a scale and EMA as a risk filter.
How it works
1. Anchor
* Auto: chooses the most recent *confirmed* pivot (you control Left/Right).
* Manual: set a price and bar index and the fan will hold that point (no re-anchoring).
* Optional Re-anchor when a newer pivot confirms.
2. 1×1 Slope (numeric, not cosmetic)
* ATR mode: `1×1 = ATR(Length) × Multiplier` (adapts to volatility).
* Fixed mode: `ticks per bar` (constant slope).
Because slope is numeric, it doesn’t change with chart zoom, unlike the drawing tool.
3. Fan Lines
Builds classic ratios around the 1×1: 1/8, 1/4, 1/3, 1/2, 1/1, 2/1, 3/1, 4/1, 8/1.
4. Signals
* Breakout: cross of price over/under the 1×1 in the EMA-aligned direction.
* Bounce (optional): touch + reversal across the 1×1 to reduce whipsaw.
5. Exits & Risk
* Take-profit at the next fan line; Stop at the previous fan line.
* If a level is missing (right after re-anchor), a fallback Risk-Reward (RR) is used.
* Optional ATR trailing stop.
Why this is unique
* True numeric fan: The 1×1 slope is calculated from ATR or fixed ticks—not from screen geometry—so it is scale-invariant and reproducible across users/timeframes.
* Deterministic anchor logic: Uses confirmed pivots (with your L/R settings). No look-ahead; anchors update only when the right bars complete.
* Fan-native trade management: Both entries and exits come from the fan structure itself (with a minimal ATR/EMA assist), keeping the method pure.
* Two entry archetypes: Breakout for momentum days; Bounce for range days—switchable without changing the core model.
* Manual mode: Lock a session’s bias by anchoring to a chosen swing (e.g., day’s first major low/high) and keep the fan constant all day.
Inputs (quick guide)
* Auto Anchor (Left/Right): pivot sensitivity. Higher values = fewer, stronger anchors.
* Re-anchor: refresh to newer pivots as they confirm.
* Manual Anchor Price / Bar Index: fixes the fan (turn Auto off).
* Scale 1×1 by ATR: on = adaptive; off = use ticks per bar.
* ATR Length / ATR Multiplier: controls adaptive slope; start around 14 / 0.25–0.35.
* Ticks per bar: exact fixed slope (match a hand-drawn fan by computing slope ÷ mintick).
* EMA Trend Filter: e.g., 50–100; trades only in EMA direction.
* Use Bounce: require touch + reverse across 1×1 (helps in chop).
* TP/SL at fan lines; Fallback RR for missing levels; ATR Trailing Stop optional.
* Transparency/Plot EMA: visual preferences.
Tips
* Range days: larger pivots (L/R 8–12), Bounce ON, ATR Multiplier \~0.30–0.40, EMA 100.
* Trend days: L/R 5–6, Breakout, Multiplier \~0.20–0.30, EMA 50, ATR trail 1.0–1.5.
* Match the TV Gann Fan drawing: turn ATR scale OFF, set ticks per bar = `(Δprice between anchor and 1×1 target) / (bars) / mintick`.
Repainting & testing notes
* Pivots require Right bars to confirm; anchors are set after confirmation (no look-ahead).
* Signals use the current bar close with TradingView strategy mechanics; real-time vs. bar-close can differ slightly, as with any strategy.
* Re-anchoring legitimately moves the structure when new pivots confirm—by design.
⚠️ Disclaimer
This script is provided for educational purposes only.
Past performance does not guarantee future results.
Trading involves risk, and users should exercise caution and use proper risk management when applying this strategy.

J12Matic Builder by galgoomA flexible Renko/tick strategy that lets you choose between two entry engines (Multi-Source 3-way or QBand+Moneyball), with a unified trailing/TP exit engine, NY-time trading windows with auto-flatten, daily profit/loss and trade-count limits (HALT mode), and clean webhook routing using {{strategy.order.alert_message}}.
Highlights
Two entry engines
Multi-Source (3): up to three long/short sources with Single / Dual / Triple logic and optional lookback.
QBand + Moneyball: Gate → Trigger workflow with timing windows, OR/AND trigger modes, per-window caps, optional same-bar fire.
Unified exit engine: Trailing by Bricks or Ticks, plus optional static TP/SL.
Session control (NY time): Evening / Overnight / NY Session windows; auto-flatten at end of any enabled window.
Day controls: Profit/Loss (USD) and Trade-count limits. When hit, strategy HALTS new entries, shows an on-chart label/background.
Alert routing designed for webhooks: Every order sets alert_message= so you can run alerts with:
Condition: this strategy
Notify on: Order fills only
Message: {{strategy.order.alert_message}}
Default JSONs or Custom payloads: If a Custom field is blank, a sensible default JSON is sent. Fill a field to override.
How to set up alerts (the 15-second version)
Create a TradingView alert with this strategy as Condition.
Notify on: Order fills only.
Message: {{strategy.order.alert_message}} (exactly).
If you want your own payloads, paste them into Inputs → 08) Custom Alert Payloads.
Leave blank → the strategy sends a default JSON.
Fill in → your text is sent as-is.
Note: Anything you type into the alert dialog’s Message box is ignored except the {{strategy.order.alert_message}} token, which forwards the payload supplied by the strategy at order time.
Publishing notes / best practices
Renko users: Make sure “Renko Brick Size” in Inputs matches your chart’s brick size exactly.
Ticks vs Bricks: Exit distances switch instantly when you toggle Exit Units.
Same-bar flips: If enabled, a new opposite signal will first close the open trade (with its exit payload), then enter the new side.
HALT mode: When day profit/loss limit or trade-count limit triggers, new entries are blocked for the rest of the session day. You’ll see a label and a soft background tint.
Session end flatten: Auto-closes positions at window ends; these exits use the “End of Session Window Exit” payload.
Bar magnifier: Strategy is configured for on-close execution; you can enable Bar Magnifier in Properties if needed.
Default JSONs (used when a Custom field is empty)
Open: {"event":"open","side":"long|short","symbol":""}
Close: {"event":"close","side":"long|short|flat","reason":"tp|sl|flip|session|limit_profit|limit_loss","symbol":""}
You can paste any text/JSON into the Custom fields; it will be forwarded as-is when that event occurs.
Input sections — user guide
01) Entries & Signals
Entry Logic: Choose Multi-Source (3) or QBand + Moneyball (pick one).
Enable Long/Short Signals: Master on/off switches for entering long/short.
Flip on opposite signal: If enabled, a new opposite signal will close the current position first, then open the other side.
Signal Logic (Multi-Source):
Single: any 1 of the 3 sources > 0
Dual: Source1 AND Source2 > 0
Triple (default): 1 AND 2 AND 3 > 0
Long/Short Signal Sources 1–3: Provide up to three series (often indicators). A positive value (> 0) is treated as a “pulse”.
Use Lookback: Keeps a source “true” for N bars after it pulses (helps catch late triggers).
Long/Short Lookback (bars): How many bars to remember that pulse.
01b) QBands + Moneyball (Gate -> Trigger)
Allow same-bar Gate->Trigger: If ON, a trigger can fire on the same bar as the gate pulse.
Trigger must fire within N bars after Gate: Size of the gate window (in bars).
Max signals per window (0 = unlimited): Cap the number of entries allowed while a gate window is open.
Buy/Sell Source 1 – Gate: Gate pulse sources that open the buy/sell window (often a regime/zone, e.g., QBands bull/bear).
Trigger Pulse Mode (Buy/Sell): How to detect a trigger pulse from the trigger sources (Change / Appear / Rise>0 / Fall<0).
Trigger A/B sources + Extend Bars: Primary/secondary triggers plus optional extension to persist their pulse for N bars.
Trigger Mode: Pick S2 only, S3 only, S2 OR S3, or S2 AND S3. AND mode remembers both pulses inside the window before firing.
02) Exit Units (Trailing/TP)
Exit Units: Choose Bricks (Renko) or Ticks. All distances below switch accordingly.
03) Tick-based Trailing / Stops (active when Exit Units = Ticks)
Initial SL (ticks): Starting stop distance from entry.
Start Trailing After (ticks): Start trailing once price moves this far in your favor.
Trailing Distance (ticks): Offset of the trailing stop from peak/trough once trailing begins.
Take Profit (ticks): Optional static TP distance.
Stop Loss (ticks): Optional static SL distance (overrides trailing if enabled).
04) Brick-based Trailing / Stops (active when Exit Units = Bricks)
Renko Brick Size: Must match your chart’s brick size.
Initial SL / Start Trailing After / Trailing Distance (bricks): Same definitions as tick mode, measured in bricks.
Take Profit / Stop Loss (bricks): Optional static distances.
05) TP / SL Switch
Enable Static Take Profit: If ON, closes the trade at the fixed TP distance.
Enable Static Stop Loss (Overrides Trailing): If ON, trailing is disabled and a fixed SL is used.
06) Trading Windows (NY time)
Use Trading Windows: Master toggle for all windows.
Evening / Overnight / NY Session: Define each session in NY time.
Flatten at End of : Auto-close any open position when a window ends (sends the Session Exit payload).
07) Day Controls & Limits
Enable Profit Limits / Profit Limit (Dollars): When daily net PnL ≥ limit → auto-flatten and HALT.
Enable Loss Limits / Loss Limit (Dollars): When daily net PnL ≤ −limit → auto-flatten and HALT.
Enable Trade Count Limits / Number of Trades Allowed: After N entries, HALT new entries (does not auto-flatten).
On-chart HUD: A label and soft background tint appear when HALTED; a compact status table shows Day PnL, trade count, and mode.
08) Custom Alert Payloads (used as strategy.order.alert_message)
Long/Short Entry: Payload sent on entries (if blank, a default open JSON is sent).
Regular Long/Short Exit: Payload sent on closes from SL/TP/flip (if blank, a default close JSON is sent).
End of Session Window Exit: Payload sent when any enabled window ends and positions are flattened.
Profit/Loss/Trade Limit Close: Payload sent when daily profit/loss limit causes auto-flatten.
Tip: Any tokens you include here are forwarded “as is”. If your downstream expects variables, do the substitution on the receiver side.
Known limitations
No bracket orders from Pine: This strategy doesn’t create OCO/attached brackets on the broker; it simulates exits with strategy logic and forwards your payloads for external automation.
alert_message is per order only: Alerts fire on order events. General status pings aren’t sent unless you wire a separate indicator/alert.
Renko specifics: Backtests on synthetic Renko can differ from live execution. Always forward-test on your instrument and settings.
Quick checklist before you publish
✅ Brick size in Inputs matches your Renko chart
✅ Exit Units set to Bricks or Ticks as you intend
✅ Day limits/Windows toggled as you want
✅ Custom payloads filled (or leave blank to use defaults)
✅ Your alert uses Order fills only + {{strategy.order.alert_message}}

Volatility Zones (VStop + Bands) — Fixed (v2)📝 What this indicator is
This script is called “Volatility Zones (VStop + Bands)”.
It is an ATR-based volatility indicator that combines dynamic volatility bands, a Volatility Stop line (VStop), and volatility spike detection into a single tool.
Unlike moving average–based indicators, this tool does not rely on averages of price direction. Instead, it measures the market’s true volatility and reacts to expansions or contractions in price ranges.
________________________________________
⚙️ How it is built
The indicator uses several volatility-based components:
1. Average True Range (ATR)
o ATR is calculated over a user-defined length.
o It measures how much price typically moves in a given number of bars, making it the foundation of this indicator.
2. Volatility Bands
o Upper band = close + ATR × factor
o Lower band = close - ATR × factor
o The area between them is shaded.
o This gives traders an immediate visual sense of market volatility width — wide bands = high volatility, narrow bands = quiet market.
3. Volatility Stop (VStop)
o A stateful trailing stop based on ATR.
o It tracks the highest (or lowest) price in the current trend and places a stop offset by ATR × multiplier.
o When price crosses this stop, the indicator flips trend direction.
o This creates a dynamic stop-and-reverse mechanism that adapts to volatility.
4. Trend Zones
o When the trend is bullish, the stop is green and the chart background is shaded softly green.
o When bearish, the stop is red and the background is shaded softly red.
o This makes the market’s directional bias visually clear at all times.
5. Flip Signals (Buy/Sell Arrows)
o Whenever the VStop flips, arrows appear:
Green BUY arrows below price when the trend turns bullish.
Red SELL arrows above price when the trend turns bearish.
o These are also tied to built-in alerts for automation.
6. Volatility Spike Detection
o The script compares current ATR to its recent average.
o If ATR suddenly expands above a threshold, a small yellow “VOL” marker appears at the top of the chart.
o This highlights potential breakout phases or unusual volatility events.
7. Stop Labels
o At every trend flip, a small label appears at the bar, showing the exact stop level.
o This makes it easy to use the stop as a reference for risk management.
________________________________________
📊 How it works in practice
• When price is above the VStop line, the market is considered in an uptrend.
• When price is below the VStop line, the market is in a downtrend.
• The bands expand/contract with volatility, helping traders gauge risk and position sizing.
• Flip arrows signal when trend direction changes.
• Volatility spikes warn traders that the market is entering a higher-risk phase, often before strong moves.
________________________________________
🎯 How it may help traders
• Trend following → Helps traders identify whether the market is trending up or down.
• Stop placement → Provides a dynamic stop level that adjusts to volatility.
• Volatility awareness → Shaded bands and spike markers show when the market is likely to become unstable.
• Trade timing → Flip arrows and labels help identify potential entry or exit points.
• Risk management → Wide bands indicate higher risk; narrow bands suggest safer, tighter ranges.
________________________________________
🌍 In what markets it is useful
Because the indicator is based purely on volatility, it works across all asset classes and timeframes:
• Stocks & ETFs → Helps identify breakouts and long-term trends.
• Forex → Very useful in spot FX where volatility shifts frequently.
• Crypto → ATR reacts strongly to high volatility, helping traders adapt stops dynamically.
• Futures & Commodities → Great for tracking trending commodities and managing risk.
Scalpers, swing traders, and position traders can all benefit by adjusting the ATR length and multipliers to suit their trading style.
________________________________________
💡 Originality of this script
This is not just a mashup of existing indicators. It integrates:
• ATR-based Volatility Bands for context,
• A stateful Volatility Stop (adapted and rewritten cleanly),
• Flip arrows and labels for actionable trading signals,
• Volatility spike detection to highlight regime shifts.
The result is a comprehensive volatility-aware trading tool that goes beyond just plotting ATR or trend stops.
________________________________________
🔔 Alerts
• Buy Flip → triggers when the trend changes bullish.
• Sell Flip → triggers when the trend changes bearish.
Traders can connect these alerts to automated strategies, bots, or notification systems.

Nifty50 Swing Trading Super Indicator# 🚀 Nifty50 Swing Trading Super Indicator - Complete Guide
**Created by:** Gaurav
**Date:** August 8, 2025
**Version:** 1.0 - Optimized for Indian Markets
---
## 📋 Table of Contents
1. (#quick-start-guide)
2. (#indicator-overview)
3. (#installation-instructions)
4. (#parameter-settings)
5. (#signal-interpretation)
6. (#trading-strategy)
7. (#risk-management)
8. (#optimization-tips)
9. (#troubleshooting)
---
## 🎯 Quick Start Guide
### What You Get
✅ **2 Complete Pine Script Indicators:**
- `swing_trading_super_indicator.pine` - Universal version for all markets
- `nifty_optimized_super_indicator.pine` - Specifically optimized for Nifty50 & Indian stocks
✅ **Key Features:**
- Multi-component signal confirmation system
- Optimized for daily and 3-hour timeframes
- Built-in risk management with dynamic stops and targets
- Real-time signal strength monitoring
- Gap analysis for Indian market characteristics
### Immediate Setup
1. Copy the Pine Script code from `nifty_optimized_super_indicator.pine`
2. Paste into TradingView Pine Editor
3. Add to chart on daily or 3-hour timeframe
4. Look for 🚀BUY and 🔻SELL signals
5. Use the information table for signal confirmation
---
## 🔍 Indicator Overview
### Core Components Integration
**🎯 Range Filter (35% Weight)**
- Primary trend identification using adaptive volatility filtering
- Optimized sampling period: 21 bars for Indian market volatility
- Enhanced range multiplier: 3.0 to handle market gaps
- Provides trend direction and strength measurement
**⚡ PMAX (30% Weight)**
- Volatility-adjusted trend confirmation using ATR-based calculations
- Dynamic multiplier adjustment based on market volatility
- 14-period ATR with 2.5 multiplier for swing trading sensitivity
- Offers trailing stop functionality
**🏗️ Support/Resistance (20% Weight)**
- Dynamic level identification using pivot point analysis
- Tighter channel width (3%) for precise Indian market levels
- Enhanced strength calculation with historical interaction weighting
- Provides entry/exit timing and breakout signals
**📊 EMA Alignment (15% Weight)**
- Multi-timeframe moving average confirmation
- Key EMAs: 9, 21, 50, 200 (popular in Indian markets)
- Hierarchical alignment scoring for trend strength
- Additional trend validation layer
### Advanced Features
**🌅 Gap Analysis**
- Automatic detection of significant price gaps (>2%)
- Gap strength measurement and impact on signals
- Specific optimization for Indian market overnight gaps
- Visual gap markers on chart
**⏰ Multi-Timeframe Integration**
- Higher timeframe bias from daily/weekly data
- Configurable daily bias weight (default 70%)
- 3-hour confirmation for precise entry timing
- Prevents counter-trend trades against major timeframe
**🛡️ Risk Management**
- Dynamic stop-loss calculation using multiple methods
- Automatic profit target identification
- Position sizing guidance based on signal strength
- Anti-whipsaw logic to prevent false signals
---
## 📥 Installation Instructions
### Step 1: Access TradingView
1. Open TradingView.com
2. Navigate to Pine Editor (bottom panel)
3. Create a new indicator
### Step 2: Copy the Code
**For Nifty50 & Indian Stocks (Recommended):**
```pinescript
// Copy entire content from nifty_optimized_super_indicator.pine
```
**For Universal Use:**
```pinescript
// Copy entire content from swing_trading_super_indicator.pine
```
### Step 3: Configure and Apply
1. Click "Add to Chart"
2. Select daily or 3-hour timeframe
3. Adjust parameters if needed (defaults are optimized)
4. Enable alerts for signal notifications
### Step 4: Verify Installation
- Check that all components are visible
- Confirm information table appears in top-right
- Test with known trending stocks for signal validation
---
## ⚙️ Parameter Settings
### 🎯 Range Filter Settings
```
Sampling Period: 21 (optimized for Indian market volatility)
Range Multiplier: 3.0 (handles overnight gaps effectively)
Source: Close (most reliable for swing trading)
```
### ⚡ PMAX Settings
```
ATR Length: 14 (standard for daily/3H timeframes)
ATR Multiplier: 2.5 (balanced for swing trading sensitivity)
Moving Average Type: EMA (responsive to price changes)
MA Length: 14 (matches ATR period for consistency)
```
### 🏗️ Support/Resistance Settings
```
Pivot Period: 8 (shorter for Indian market dynamics)
Channel Width: 3% (tighter for precise levels)
Minimum Strength: 3 (higher quality levels only)
Maximum Levels: 4 (focus on strongest levels)
Lookback Period: 150 (sufficient historical data)
```
### 🚀 Super Indicator Settings
```
Signal Sensitivity: 0.65 (balanced for swing trading)
Trend Strength Requirement: 0.75 (high quality signals)
Gap Threshold: 2.0% (significant gap detection)
Daily Bias Weight: 0.7 (strong higher timeframe influence)
```
### 🎨 Display Options
```
Show Range Filter: ✅ (trend visualization)
Show PMAX: ✅ (trailing stops)
Show S/R Levels: ✅ (key price levels)
Show Key EMAs: ✅ (trend confirmation)
Show Signals: ✅ (buy/sell alerts)
Show Trend Background: ✅ (visual trend state)
Show Gap Markers: ✅ (gap identification)
```
---
## 📊 Signal Interpretation
### 🚀 BUY Signals
**Requirements for BUY Signal:**
- Price above Range Filter with upward trend
- PMAX showing bullish direction (MA > PMAX line)
- Support/resistance breakout or favorable positioning
- EMA alignment supporting upward movement
- Higher timeframe bias confirmation
- Overall signal strength > 75%
**Signal Strength Indicators:**
- **90-100%:** Extremely strong - Maximum position size
- **80-89%:** Very strong - Large position size
- **75-79%:** Strong - Standard position size
- **65-74%:** Moderate - Reduced position size
- **<65%:** Weak - Wait for better opportunity
### 🔻 SELL Signals
**Requirements for SELL Signal:**
- Price below Range Filter with downward trend
- PMAX showing bearish direction (MA < PMAX line)
- Resistance breakdown or unfavorable positioning
- EMA alignment supporting downward movement
- Higher timeframe bias confirmation
- Overall signal strength > 75%
### ⚖️ NEUTRAL Signals
**Characteristics:**
- Conflicting signals between components
- Low overall signal strength (<65%)
- Range-bound market conditions
- Wait for clearer directional bias
### 📈 Information Table Guide
**Component Status:**
- **BULL/BEAR:** Current signal direction
- **Strength %:** Component contribution strength
- **Status:** Additional context (STRONG/WEAK/ACTIVE/etc.)
**Overall Signal:**
- **🚀 STRONG BUY:** All systems aligned bullish
- **🔻 STRONG SELL:** All systems aligned bearish
- **⚖️ NEUTRAL:** Mixed or weak signals
---
## 💼 Trading Strategy
### Daily Timeframe Strategy
**Setup:**
1. Apply indicator to daily chart of Nifty50 or Indian stocks
2. Wait for 🚀BUY or 🔻SELL signal with >75% strength
3. Confirm higher timeframe bias alignment
4. Check for significant support/resistance levels
**Entry:**
- Enter on signal bar close or next bar open
- Use 3-hour chart for precise entry timing
- Avoid entries during major news events
- Consider gap analysis for overnight positions
**Position Sizing:**
- **>90% Strength:** 3-4% of portfolio
- **80-89% Strength:** 2-3% of portfolio
- **75-79% Strength:** 1-2% of portfolio
- **<75% Strength:** Avoid or minimal size
### 3-Hour Timeframe Strategy
**Setup:**
1. Confirm daily timeframe bias first
2. Apply indicator to 3-hour chart
3. Look for signals aligned with daily trend
4. Use for entry/exit timing optimization
**Entry Refinement:**
- Wait for 3H signal confirmation
- Enter on pullbacks to key levels
- Use tighter stops for better risk/reward
- Monitor intraday support/resistance
### Risk Management Rules
**Stop Loss Placement:**
1. **Primary:** Use indicator's dynamic stop level
2. **Secondary:** Below/above nearest support/resistance
3. **Maximum:** 2-3% of portfolio per trade
4. **Trailing:** Move stops with PMAX line
**Profit Taking:**
1. **Target 1:** First resistance/support level (50% position)
2. **Target 2:** Second resistance/support level (30% position)
3. **Runner:** Trail remaining 20% with PMAX
**Position Management:**
- Review positions at daily close
- Adjust stops based on new signals
- Exit if trend changes to opposite direction
- Reduce size during high volatility periods
---
## 🎯 Optimization Tips
### For Nifty50 Trading
- Use daily timeframe for primary signals
- Monitor sector rotation impact
- Consider index futures for better liquidity
- Watch for RBI policy and global cues impact
### For Individual Stocks
- Verify stock follows Nifty correlation
- Check sector-specific news and events
- Ensure adequate liquidity for position size
- Monitor earnings calendar for volatility
### Market Condition Adaptations
**Trending Markets:**
- Increase position sizes for strong signals
- Use wider stops to avoid whipsaws
- Focus on trend continuation signals
- Reduce counter-trend trading
**Range-Bound Markets:**
- Reduce position sizes
- Use tighter stops and quicker profits
- Focus on support/resistance bounces
- Increase signal strength requirements
**High Volatility Periods:**
- Reduce overall exposure
- Use smaller position sizes
- Increase stop-loss distances
- Wait for clearer signals
### Performance Monitoring
- Track win rate and average profit/loss
- Monitor signal quality over time
- Adjust parameters based on market changes
- Keep trading journal for pattern recognition
---
## 🔧 Troubleshooting
### Common Issues
**Q: Signals appear too frequently**
A: Increase "Trend Strength Requirement" to 0.8-0.9
**Q: Missing obvious trends**
A: Decrease "Signal Sensitivity" to 0.5-0.6
**Q: Too many false signals**
A: Enable "3H Confirmation" and increase strength requirements
**Q: Indicator not loading**
A: Check Pine Script version compatibility (requires v5)
### Parameter Adjustments
**For More Sensitive Signals:**
- Decrease Signal Sensitivity to 0.5-0.6
- Decrease Trend Strength Requirement to 0.6-0.7
- Increase Range Filter multiplier to 3.5-4.0
**For More Conservative Signals:**
- Increase Signal Sensitivity to 0.7-0.8
- Increase Trend Strength Requirement to 0.8-0.9
- Enable all confirmation features
### Performance Issues
- Reduce lookback periods if chart loads slowly
- Disable some visual elements for better performance
- Use on liquid stocks/indices for best results
---
## 📞 Support & Updates
This super indicator combines the best of Range Filter, PMAX, and Support/Resistance analysis specifically optimized for Indian market swing trading. The multi-component approach significantly improves signal quality while the built-in risk management features help protect capital.
**Remember:** No indicator is 100% accurate. Always combine with proper risk management, market analysis, and your trading experience for best results.
**Happy Trading! 🚀**

MVO - MA Signal StrategyStrategy Description: MA Signal Strategy with Heikin Ashi, Break-even and Trailing Stop
⸻
🔍 Core Concept
This strategy enters long or short trades based on Heikin Ashi candles crossing above or below a moving average (MA), with optional confirmation from the Money Flow Index (MFI). It includes:
• Dynamic stop loss and take profit levels based on ATR
• Optional break-even stop adjustment
• Optional trailing stop activation after breakeven
• Full visual feedback for trades and zones
⸻
⚙️ Indicators Used
• Heikin Ashi Candles: Smooth price action to reduce noise.
• Simple Moving Average (MA): Determines trend direction.
• Average True Range (ATR): Sets volatility-based SL/TP.
• Money Flow Index (MFI): Optional momentum filter for entries.
⸻
📈 Trade Entry Logic
✅ Long Entry:
Triggered if:
• Heikin Ashi close crosses above the MA
or
• MFI is below 20 and Heikin Ashi close is above the MA
❌ Short Entry:
Triggered if:
• Heikin Ashi close crosses below the MA
or
• MFI is above 90 and Heikin Ashi close is below the MA
⸻
🛑 Stop Loss & Take Profit
• SL is set using riskMult * ATR
• TP is set using rewardMult * ATR
Example:
• If ATR = 10, riskMult = 1, rewardMult = 5
→ SL = 10 points, TP = 50 points from entry
⸻
⚖️ Break-even Logic (Optional)
• If price moves in your favor by breakevenTicks * ATR, SL is moved to entry price.
• Enabled via checkbox Enable Break Even.
⸻
📉 Trailing Stop Logic (Optional)
• Once break-even is hit, a trailing stop starts moving behind price by trailATRmult * ATR.
• Trailing stop only activates after break-even is reached.
• Enabled via checkbox Enable Trailing Stop.
📊 Visual Elements
• Heikin Ashi candles are drawn on the main chart.
• Trade zones are shaded between SL and TP during open trades.
• Lines mark Entry, SL, TP, Break-even trigger.
• Markers show entries and exits:
• Green/red triangles = long/short entries
• ✅ = Take profit hit
• ❌ = Stop loss hit
✅ Best Use Case
• Trending markets with strong pullbacks
• Works on multiple timeframes
• Better suited for assets with consistent volatility (ATR behavior)

ATR Trend Color📌 ATR Trend Color — Visually clean trend-following tool based on adaptive ATR trailing stop
► Description
ATR Trend Color is a simple yet powerful indicator designed to visually identify and follow the market trend using an adaptive ATR-based trailing stop. Its main advantage lies in clarity — it uses just a single line that dynamically changes color based on trend direction:
✅ Blue line indicates price is above the trailing stop (bullish trend).
🔻 Black line indicates price is below the trailing stop (bearish trend).
This clean display allows for instant trend recognition and potential exit or reversal zones.
► How it works
The indicator uses the Average True Range (ATR) to calculate a dynamic trailing stop level. ATR measures volatility and adjusts the trailing line to match current market conditions:
When the price rises, the line moves up and acts as dynamic support.
When the price drops, the line moves down and acts as resistance.
This behavior makes it ideal for trend following and volatility-adjusted stop-loss placement.
► Key Features:
✅ Clean chart with just one ATR trailing line
✅ Dynamic color changes in real-time
✅ Great for trend confirmation and management
✅ Customizable ATR period and multiplier
✅ Step line with diamonds for high visual clarity
► How to use
Add the indicator to your chart.
Adjust ATR period and multiplier to your strategy (default: ATR 7 / multiplier 3.1).
Follow the line color:
Blue: Bullish trend — may signal to stay in long positions.
Black: Bearish trend — may suggest exit or short entries.
► Originality
Unlike typical ATR trailing stop indicators that display two lines or static colors, ATR Trend Color simplifies visualization by using a single smart line with real-time visual feedback on trend direction.
Additionally, it uses the “Step line with diamonds” display mode to enhance readability in fast or noisy markets.
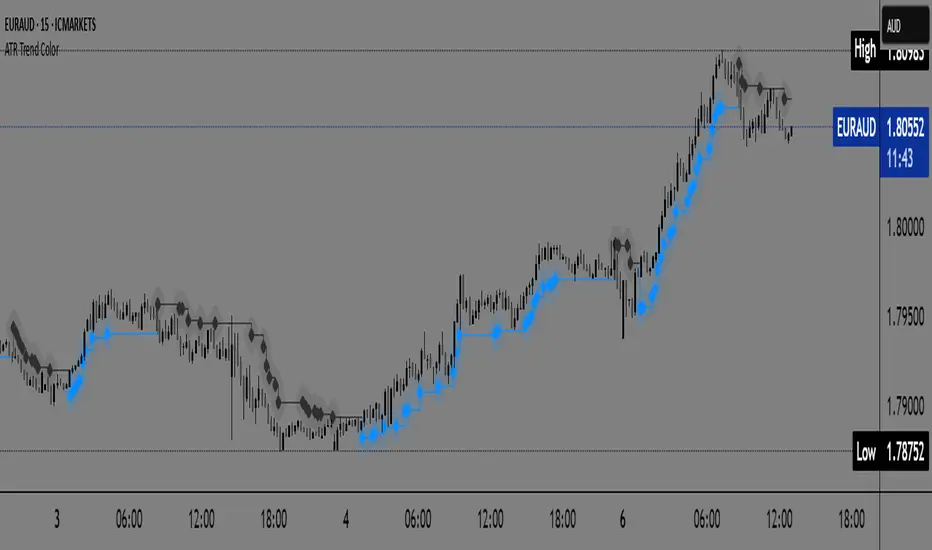
All SMAs Bullish/Bearish Screener (Enhanced)All SMAs Bullish/Bearish Screener Enhanced: Uncover High-Conviction Trend Alignments with Confidence
Description:
Are you ready to elevate your trading from mere guesswork to precise, data-driven decisions? The "All SMAs Bullish/Bearish Screener Enhanced" is not just another indicator; it's a sophisticated, yet user-friendly, trend-following powerhouse designed to cut through market noise and pinpoint high-probability trading opportunities. Built on the foundational strength of comprehensive Moving Average confluence and fortified with critical confirmation signals from Momentum, Volume, and Relative Strength, this script empowers you to identify truly robust trends and manage your trades with unparalleled clarity.
The Power of Multi-Factor Confluence: Beyond Simple Averages
In the unpredictable world of financial markets, true strength or weakness is rarely an isolated event. It's the harmonious alignment of multiple technical factors that signals a high-conviction move. While our original "All SMAs Bullish/Bearish Screener" intelligently identified stocks where price was consistently above or below a full spectrum of Simple Moving Averages (5, 10, 20, 50, 100, 200), this Enhanced version takes it a crucial step further.
We've integrated a powerful three-pronged confirmation system to filter out weaker signals and highlight only the most compelling setups:
Momentum (Rate of Change - ROC): A strong trend isn't just about price direction; it's about the speed and intensity of that movement. Positive momentum confirms that buyers are still aggressively pushing price higher (for bullish signals), while negative momentum validates selling pressure (for bearish signals).
Volume: No trend is truly trustworthy without the backing of smart money. Above-average volume accompanying an "All SMAs" alignment signifies strong institutional participation and conviction behind the move. It separates genuine trend starts from speculative whims.
Relative Strength Index (RSI): This versatile oscillator ensures the trend isn't just "there," but that it's developing healthily. We use RSI to confirm a bullish bias (above 50) or a bearish bias (below 50), adding another layer of confidence to the direction.
When the price aligns above ALL six critical SMAs, and is simultaneously confirmed by robust positive momentum, healthy volume, and a bullish RSI bias, you have an exceptionally strong "STRONGLY BULLISH" signal. This confluence often precedes sustained upward moves, signaling prime accumulation phases. Conversely, a "STRONGLY BEARISH" signal, where price is below ALL SMAs with negative momentum, confirming volume, and a bearish RSI bias, indicates powerful distribution and potential for significant downside.
How to Use This Enhanced Screener:
Add to Chart: Go to TradingView's Pine Editor, paste the script, and click "Add to Chart."
Customize Parameters: Fine-tune the lengths of your SMAs, RSI, Momentum, and Volume averages via the indicator's settings. Experiment to find what best suits your trading style and the assets you trade.
Choose Your Timeframe Wisely:
Daily (1D) and 4-Hour (240 min) are highly recommended. These timeframes cut through intraday noise and provide more reliable, actionable signals for swing and position trading.
Shorter timeframes (e.g., 15min, 60min) can be used by advanced day traders for very short-term entries, but be aware of increased volatility and noise.
Visual Confirmation:
Green/Red Triangles: Appear on your chart, indicating confirmed bullish or bearish signals.
Background Color: The chart background will subtly turn lime green for "STRONGLY BULLISH" and red for "STRONGLY BEARISH" conditions.
On-Chart Status Table: A clear table displays the current signal status ("STRONGLY BULLISH/BEARISH," or "SMAs Mixed") for immediate feedback.
Set Up Alerts (Your Primary Screener Tool): This is the game-changer! Create custom alerts on TradingView based on the "Confirmed Bullish Trade" and "Confirmed Bearish Trade" conditions. Receive instant notifications (email, pop-up, mobile) for any stock in your watchlist that meets these stringent criteria. This allows you to scan the entire market effortlessly and act decisively.
Strategic Stop-Loss Placement: The Trader's Lifeline
Even the most robust signals can fail. Protecting your capital is paramount. For this trend-following strategy, your stop-loss should be placed where the underlying trend structure is broken.
For a "STRONGLY BULLISH" Trade: Place your stop-loss just below the most recent significant swing low (higher low). This is the last point where buyers stepped in to support the price. If price breaks below this, your bullish thesis is invalidated.
For a "STRONGLY BEARISH" Trade: Place your stop-loss just above the most recent significant swing high (lower high). If price breaks above this, your bearish thesis is invalidated.
Alternatively, consider placing your stop-loss just below the 20-period SMA (for bullish trades) or above the 20-period SMA (for bearish trades). A significant close beyond this intermediate-term average often indicates a critical shift in momentum. Always ensure your chosen stop-loss adheres to your pre-defined risk per trade (e.g., 1-2% of capital).
Disciplined Profit Booking: Maximizing Gains
Just as important as knowing when you're wrong is knowing when to take profits.
Trailing Stop-Loss: As your trade moves into profit, trail your stop-loss upwards (for longs) or downwards (for shorts). You can trail it using:
Previous Swing Lows/Highs: Move your stop to just below each new higher low (for longs) or just above each new lower high (for shorts).
A Moving Average (e.g., 10-period or 20-period SMA): If price closes below your chosen trailing SMA, exit. This allows you to ride the trend while protecting accumulated profits.
Target Levels: Identify potential resistance levels (for longs) or support levels (for shorts) using pivot points, previous highs/lows, or Fibonacci extensions. Consider taking partial profits at these levels and letting the rest run with a trailing stop.
Loss of Confluence: If the "STRONGLY BULLISH/BEARISH" condition ceases to be met (e.g., RSI crosses below 50, or volume drops significantly), this can be a signal to reduce or exit your position, even if your stop-loss hasn't been hit.
The "All SMAs Bullish/Bearish Screener Enhanced" is your comprehensive partner in navigating the markets. By combining robust trend identification with critical confirmation signals and disciplined risk management, you're equipped to make smarter, more confident trading decisions. Add it to your favorites and unlock a new level of precision in your trading journey!
#PineScript #TradingView #SMA #MovingAverage #TrendFollowing #StockScreener #TechnicalAnalysis #Bullish #Bearish #QQQ #Momentum #Volume #RSI #SPY #TradingStrategy #Enhanced #Signals #Analysis #DayTrading #SwingTrading

Liquid Pulse Liquid Pulse by Dskyz (DAFE) Trading Systems
Liquid Pulse is a trading algo built by Dskyz (DAFE) Trading Systems for futures markets like NQ1!, designed to snag high-probability trades with tight risk control. it fuses a confluence system—VWAP, MACD, ADX, volume, and liquidity sweeps—with a trade scoring setup, daily limits, and VIX pauses to dodge wild volatility. visuals include simple signals, VWAP bands, and a dashboard with stats.
Core Components for Liquid Pulse
Volume Sensitivity (volumeSensitivity) controls how much volume spikes matter for entries. options: 'Low', 'Medium', 'High' default: 'High' (catches small spikes, good for active markets) tweak it: 'Low' for calm markets, 'High' for chaos.
MACD Speed (macdSpeed) sets the MACD’s pace for momentum. options: 'Fast', 'Medium', 'Slow' default: 'Medium' (solid balance) tweak it: 'Fast' for scalping, 'Slow' for swings.
Daily Trade Limit (dailyTradeLimit) caps trades per day to keep risk in check. range: 1 to 30 default: 20 tweak it: 5-10 for safety, 20-30 for action.
Number of Contracts (numContracts) sets position size. range: 1 to 20 default: 4 tweak it: up for big accounts, down for small.
VIX Pause Level (vixPauseLevel) stops trading if VIX gets too hot. range: 10 to 80 default: 39.0 tweak it: 30 to avoid volatility, 50 to ride it.
Min Confluence Conditions (minConditions) sets how many signals must align. range: 1 to 5 default: 2 tweak it: 3-4 for strict, 1-2 for more trades.
Min Trade Score (Longs/Shorts) (minTradeScoreLongs/minTradeScoreShorts) filters trade quality. longs range: 0 to 100 default: 73 shorts range: 0 to 100 default: 75 tweak it: 80-90 for quality, 60-70 for volume.
Liquidity Sweep Strength (sweepStrength) gauges breakouts. range: 0.1 to 1.0 default: 0.5 tweak it: 0.7-1.0 for strong moves, 0.3-0.5 for small.
ADX Trend Threshold (adxTrendThreshold) confirms trends. range: 10 to 100 default: 41 tweak it: 40-50 for trends, 30-35 for weak ones.
ADX Chop Threshold (adxChopThreshold) avoids chop. range: 5 to 50 default: 20 tweak it: 15-20 to dodge chop, 25-30 to loosen.
VWAP Timeframe (vwapTimeframe) sets VWAP period. options: '15', '30', '60', '240', 'D' default: '60' (1-hour) tweak it: 60 for day, 240 for swing, D for long.
Take Profit Ticks (Longs/Shorts) (takeProfitTicksLongs/takeProfitTicksShorts) sets profit targets. longs range: 5 to 100 default: 25.0 shorts range: 5 to 100 default: 20.0 tweak it: 30-50 for trends, 10-20 for chop.
Max Profit Ticks (maxProfitTicks) caps max gain. range: 10 to 200 default: 60.0 tweak it: 80-100 for big moves, 40-60 for tight.
Min Profit Ticks to Trail (minProfitTicksTrail) triggers trailing. range: 1 to 50 default: 7.0 tweak it: 10-15 for big gains, 5-7 for quick locks.
Trailing Stop Ticks (trailTicks) sets trail distance. range: 1 to 50 default: 5.0 tweak it: 8-10 for room, 3-5 for fast locks.
Trailing Offset Ticks (trailOffsetTicks) sets trail offset. range: 1 to 20 default: 2.0 tweak it: 1-2 for tight, 5-10 for loose.
ATR Period (atrPeriod) measures volatility. range: 5 to 50 default: 9 tweak it: 14-20 for smooth, 5-9 for reactive.
Hardcoded Settings volLookback: 30 ('Low'), 20 ('Medium'), 11 ('High') volThreshold: 1.5 ('Low'), 1.8 ('Medium'), 2 ('High') swingLen: 5
Execution Logic Overview trades trigger when confluence conditions align, entering long or short with set position sizes. exits use dynamic take-profits, trailing stops after a profit threshold, hard stops via ATR, and a time stop after 100 bars.
Features Multi-Signal Confluence: needs VWAP, MACD, volume, sweeps, and ADX to line up.
Risk Control: ATR-based stops (capped 15 ticks), take-profits (scaled by volatility), and trails.
Market Filters: VIX pause, ADX trend/chop checks, volatility gates. Dashboard: shows scores, VIX, ADX, P/L, win %, streak.
Visuals Simple signals (green up triangles for longs, red down for shorts) and VWAP bands with glow. info table (bottom right) with MACD momentum. dashboard (top right) with stats.
Chart and Backtest:
NQ1! futures, 5-minute chart. works best in trending, volatile conditions. tweak inputs for other markets—test thoroughly.
Backtesting: NQ1! Frame: Jan 19, 2025, 09:00 — May 02, 2025, 16:00 Slippage: 3 Commission: $4.60
Fee Typical Range (per side, per contract)
CME Exchange $1.14 – $1.20
Clearing $0.10 – $0.30
NFA Regulatory $0.02
Firm/Broker Commis. $0.25 – $0.80 (retail prop)
TOTAL $1.60 – $2.30 per side
Round Turn: (enter+exit) = $3.20 – $4.60 per contract
Disclaimer this is for education only. past results don’t predict future wins. trading’s risky—only use money you can lose. backtest and validate before going live. (expect moderators to nitpick some random chart symbol rule—i’ll fix and repost if they pull it.)
About the Author Dskyz (DAFE) Trading Systems crafts killer trading algos. Liquid Pulse is pure research and grit, built for smart, bold trading. Use it with discipline. Use it with clarity. Trade smarter. I’ll keep dropping badass strategies ‘til i build a brand or someone signs me up.
2025 Created by Dskyz, powered by DAFE Trading Systems. Trade smart, trade bold.

TradeTrackerLibrary "TradeTracker"
Simple Library for tracking trades
method track(this)
tracks trade when called on every bar
Namespace types: Trade
Parameters:
this (Trade) : Trade object
Returns: current Trade object
Trade
Has the constituents to track trades generated by any method.
Fields:
id (series int)
direction (series int) : Trade direction. Positive values for long and negative values for short trades
initialEntry (series float) : Initial entry price. This value will not change even if the entry is changed in the lifecycle of the trade
entry (series float) : Updated entry price. Allows variations to initial calculated entry. Useful in cases of trailing entry.
initialStop (series float) : Initial stop. Similar to initial entry, this is the first calculated stop for the lifecycle of trade.
stop (series float) : Trailing Stop. If there is no trailing, the value will be same as that of initial trade
targets (array) : array of target values.
startBar (series int) : bar index of starting bar. Set by default when object is created. No need to alter this after that.
endBar (series int) : bar index of last bar in trade. Set by tracker on each execution
startTime (series int) : time of the start bar. Set by default when object is created. No need to alter this after that.
endTime (series int) : time of the ending bar. Updated by tracking method.
status (series int) : Integer parameter to track the status of the trade
retest (series bool) : Boolean parameter to notify if there was retest of the entry price
Dskyz (DAFE) MAtrix with ATR-Powered Precision Dskyz (DAFE) MAtrix with ATR-Powered Precision
This cutting‐edge futures trading strategy built to thrive in rapidly changing market conditions. Developed for high-frequency futures trading on instruments such as the CME Mini MNQ, this strategy leverages a matrix of sophisticated moving averages combined with ATR-based filters to pinpoint high-probability entries and exits. Its unique combination of adaptable technical indicators and multi-timeframe trend filtering sets it apart from standard strategies, providing enhanced precision and dynamic responsiveness.
imgur.com
Core Functional Components
1. Advanced Moving Averages
A distinguishing feature of the DAFE strategy is its robust, multi-choice moving averages (MAs). Clients can choose from a wide array of MAs—each with specific strengths—in order to fine-tune their trading signals. The code includes user-defined functions for the following MAs:
imgur.com
Hull Moving Average (HMA):
The hma(src, len) function calculates the HMA by using weighted moving averages (WMAs) to reduce lag considerably while smoothing price data. This function computes an intermediate WMA of half the specified length, then a full-length WMA, and finally applies a further WMA over the square root of the length. This design allows for rapid adaptation to price changes without the typical delays of traditional moving averages.
Triple Exponential Moving Average (TEMA):
Implemented via tema(src, len), TEMA uses three consecutive exponential moving averages (EMAs) to effectively cancel out lag and capture price momentum. The final formula—3 * (ema1 - ema2) + ema3—produces a highly responsive indicator that filters out short-term noise.
Double Exponential Moving Average (DEMA):
Through the dema(src, len) function, DEMA calculates an EMA and then a second EMA on top of it. Its simplified formula of 2 * ema1 - ema2 provides a smoother curve than a single EMA while maintaining enhanced responsiveness.
Volume Weighted Moving Average (VWMA):
With vwma(src, len), this MA accounts for trading volume by weighting the price, thereby offering a more contextual picture of market activity. This is crucial when volume spikes indicate significant moves.
Zero Lag EMA (ZLEMA):
The zlema(src, len) function applies a correction to reduce the inherent lag found in EMAs. By subtracting a calculated lag (based on half the moving average window), ZLEMA is exceptionally attuned to recent price movements.
Arnaud Legoux Moving Average (ALMA):
The alma(src, len, offset, sigma) function introduces ALMA—a type of moving average designed to be less affected by outliers. With parameters for offset and sigma, it allows customization of the degree to which the MA reacts to market noise.
Kaufman Adaptive Moving Average (KAMA):
The custom kama(src, len) function is noteworthy for its adaptive nature. It computes an efficiency ratio by comparing price change against volatility, then dynamically adjusts its smoothing constant. This results in an MA that quickly responds during trending periods while remaining smoothed during consolidation.
Each of these functions—integrated into the strategy—is selectable by the trader (via the fastMAType and slowMAType inputs). This flexibility permits the tailored application of the MA most suited to current market dynamics and individual risk management preferences.
2. ATR-Based Filters and Risk Controls
ATR Calculation and Volatility Filter:
The strategy computes the Average True Range (ATR) over a user-defined period (atrPeriod). ATR is then used to derive both:
Volatility Assessment: Expressed as a ratio of ATR to closing price, ensuring that trades are taken only when volatility remains within a safe, predefined threshold (volatilityThreshold).
ATR-Based Entry Filters: Implemented as atrFilterLong and atrFilterShort, these conditions ensure that for long entries the price is sufficiently above the slow MA and vice versa for shorts. This acts as an additional confirmation filter.
Dynamic Exit Management:
The exit logic employs a dual approach:
Fixed Stop and Profit Target: Stops and targets are set at multiples of ATR (fixedStopMultiplier and profitTargetATRMult), helping manage risk in volatile markets.
Trailing Stop Adjustments: A trailing stop is calculated using the ATR multiplied by a user-defined offset (trailOffset), which captures additional profits as the trade moves favorably while protecting against reversals.
3. Multi-Timeframe Trend Filtering
The strategy enhances its signal reliability by leveraging a secondary, higher timeframe analysis:
15-Minute Trend Analysis:
By retrieving 15-minute moving averages (fastMA15m and slowMA15m) via request.security, the strategy determines the broader market trend. This secondary filter (enabled or disabled through useTrendFilter) ensures that entries are aligned with the prevailing market direction, thereby reducing the incidence of false signals.
4. Signal and Execution Logic
Combined MA Alignment:
The entry conditions are based primarily on the alignment of the fast and slow MAs. A long condition is triggered when the current price is above both MAs and the fast MA is above the slow MA—complemented by the ATR filter and volume conditions. The reverse applies for a short condition.
Volume and Time Window Validation:
Trades are permitted only if the current volume exceeds a minimum (minVolume) and the current hour falls within the predefined trading window (tradingStartHour to tradingEndHour). An additional volume spike check (comparing current volume to a moving average of past volumes) further filters for optimal market conditions.
Comprehensive Order Execution:
The strategy utilizes flexible order execution functions that allow pyramiding (up to 10 positions), ensuring that it can scale into positions as favorable conditions persist. The use of both market entries and automated exits (with profit targets, stop-losses, and trailing stops) ensures that risk is managed at every step.
5. Integrated Dashboard and Metrics
For transparency and real-time analysis, the strategy includes:
On-Chart Visualizations:
Both fast and slow MAs are plotted on the chart, making it easy to see the market’s technical foundation.
Dynamic Metrics Dashboard:
A built-in table displays crucial performance statistics—including current profit/loss, equity, ATR (both raw and as a percentage), and the percentage gap between the moving averages. These metrics offer immediate insight into the health and performance of the strategy.
Input Parameters: Detailed Breakdown
Every input is meticulously designed to offer granular control:
Fast & Slow Lengths:
Determine the window size for the fast and slow moving averages. Smaller values yield more sensitivity, while larger values provide a smoother, delayed response.
Fast/Slow MA Types:
Choose the type of moving average for fast and slow signals. The versatility—from basic SMA and EMA to more complex ones like HMA, TEMA, ZLEMA, ALMA, and KAMA—allows customization to fit different market scenarios.
ATR Parameters:
atrPeriod and atrMultiplier shape the volatility assessment, directly affecting entry filters and risk management through stop-loss and profit target levels.
Trend and Volume Filters:
Inputs such as useTrendFilter, minVolume, and the volume spike condition help confirm that a trade occurs in active, trending markets rather than during periods of low liquidity or market noise.
Trading Hours:
Restricting trade execution to specific hours (tradingStartHour and tradingEndHour) helps avoid illiquid or choppy markets outside of prime trading sessions.
Exit Strategies:
Parameters like trailOffset, profitTargetATRMult, and fixedStopMultiplier provide multiple layers of risk management and profit protection by tailoring how exits are generated relative to current market conditions.
Pyramiding and Fixed Trade Quantity:
The strategy supports multiple entries within a trend (up to 10 positions) and sets a predefined trade quantity (fixedQuantity) to maintain consistent exposure and risk per trade.
Dashboard Controls:
The resetDashboard input allows for on-the-fly resetting of performance metrics, keeping the strategy’s performance dashboard accurate and up-to-date.
Why This Strategy is Truly Exceptional
Multi-Faceted Adaptability:
The ability to switch seamlessly between various moving average types—each suited to particular market conditions—enables the strategy to adapt dynamically. This is a testament to the high level of coding sophistication and market insight infused within the system.
Robust Risk Management:
The integration of ATR-based stops, profit targets, and trailing stops ensures that every trade is executed with well-defined risk parameters. The system is designed to mitigate unexpected market swings while optimizing profit capture.
Comprehensive Market Filtering:
By combining moving average crossovers with volume analysis, volatility thresholds, and multi-timeframe trend filters, the strategy only enters trades under the most favorable conditions. This multi-layered filtering reduces noise and enhances signal quality.
-Final Thoughts-
The Dskyz Adaptive Futures Elite (DAFE) MAtrix with ATR-Powered Precision strategy is not just another trading algorithm—it is a multi-dimensional, fully customizable system built on advanced technical principles and sophisticated risk management techniques. Every function and input parameter has been carefully engineered to provide traders with a system that is both powerful and transparent.
For clients seeking a state-of-the-art trading solution that adapts dynamically to market conditions while maintaining strict discipline in risk management, this strategy truly stands in a class of its own.
****Please show support if you enjoyed this strategy. I'll have more coming out in the near future!!
-Dskyz
Caution
DAFE is experimental, not a profit guarantee. Futures trading risks significant losses due to leverage. Backtest, simulate, and monitor actively before live use. All trading decisions are your responsibility.

Deadzone Pro @DaviddTechDeadzone Pro by @DaviddTech – Adaptive Multi-Strategy NNFX Trading System
Deadzone Pro by @DaviddTech is a meticulously engineered trading indicator that strictly adheres to the No-Nonsense Forex (NNFX) methodology. It integrates adaptive trend detection, dual confirmation indicators, advanced volatility filtering, and dynamic risk management into one powerful, visually intuitive system. Ideal for traders seeking precision and clarity, this indicator consistently delivers high-probability trade setups across all market conditions.
🔥 Key Features:
The Setup:
Adaptive Hull Moving Average Baseline: Clearly identifies trend direction using an advanced, gradient-colored Hull MA that intensifies based on trend strength, providing immediate visual clarity.
Dual Confirmation Indicators: Combines Waddah Attar Explosion (momentum detector) and Bull/Bear Power (strength gauge) for robust validation, significantly reducing false entries.
Volatility Filter (ADX): Ensures entries are only made during strong trending markets, filtering out weak, range-bound scenarios for enhanced trade accuracy.
Dynamic Trailing Stop Loss: Implements a SuperTrend-based trailing stop using adaptive ATR calculations, managing risk effectively while optimizing exits.
Dashboard:
💎 Gradient Visualization & User Interface:
Dynamic gradient colors enhance readability, clearly indicating bullish/bearish strength.
Comprehensive dashboard summarizes component statuses, real-time market sentiment, and entry conditions at a glance.
Distinct and clear buy/sell entry and exit signals, with adaptive stop-loss levels visually plotted.
Candlestick coloring based on momentum signals (Waddah Attar) for intuitive market reading.
📈 How to Interpret Signals:
Bullish Signal: Enter when Hull MA baseline trends upward, both confirmation indicators align bullish, ADX indicates strong trend (>25), and price breaks above the previous trailing stop.
Bearish Signal: Enter short or exit long when Hull MA baseline trends downward, confirmations indicate bearish momentum, ADX confirms trend strength, and price breaks below previous trailing stop.
📊 Recommended Usage:
Timeframes: Ideal on 1H, 4H, and Daily charts for swing trading; effective on shorter (5M, 15M) charts for day trading.
Markets: Compatible with Forex, Crypto, Indices, Stocks, and Commodities.
The Entry & Exit:
🎯 Trading Styles:
Choose from three distinct trading modes:
Conservative: Requires full alignment of all indicators for maximum accuracy.
Balanced (Default): Optimized balance between signal frequency and reliability.
Aggressive: Fewer confirmations needed for more frequent trading signals.
📝 Credits & Originality:
Deadzone Pro incorporates advanced concepts inspired by:
Hull Moving Average by @Julien_Eche
Waddah Attar Explosion by @LazyBear
Bull Bear Power by @Pinecoders
ADX methodology by @BeikabuOyaji
This system has been significantly refactored and enhanced by @DaviddTech to maximize synergy, clarity, and usability, standing apart distinctly from its original components.
Deadzone Pro exemplifies precision and discipline, aligning fully with NNFX principles to provide traders with a comprehensive yet intuitive trading advantage.

Falcon SignalsThis script is a TradingView Pine Script for a trading strategy called "Falcon Signals." It combines multiple technical indicators and strategies to generate buy and sell signals. Here’s a breakdown of what the script does:
1. Supertrend Indicator:
The script calculates the Supertrend indicator using the Average True Range (ATR) and a specified multiplier (factor). The Supertrend is used to define the trend direction, with a green line for an uptrend and a red line for a downtrend.
2. EMA (Exponential Moving Average):
Two EMAs are used: a fast EMA (9-period) and a slow EMA (21-period). The script checks for crossovers of the fast EMA above or below the slow EMA as a basis for buying and selling signals.
3. RSI (Relative Strength Index):
The RSI (14-period) is used to measure the momentum of the price. A buy signal is generated when the RSI is less than 70, while a sell signal is generated when it’s greater than 30.
4. Take Profit (TP) and Stop Loss (SL):
The script allows users to set custom percentages for take profit and stop loss. The take profit is set at a certain percentage above the entry price for buy signals, and the stop loss is set at a percentage below the entry price, and vice versa for sell signals.
5. Trailing Stop:
A trailing stop can be enabled, which dynamically adjusts the stop loss level as the price moves in the favorable direction. If the price moves against the position by a certain trailing percentage, the position will be closed.
6. Engulfing Patterns:
The script checks for bullish and bearish engulfing candlestick patterns, indicating potential reversals. A bullish engulfing pattern is marked with a teal label ("🔄 Reversal Up"), and a bearish engulfing pattern is marked with a fuchsia label ("🔄 Reversal Down").
7. Plotting:
The script plots various indicators and signals:
Entry line: Shows where the buy or sell signal is triggered.
Take profit and stop loss levels are plotted as lines.
EMA and Supertrend lines are plotted on the chart.
Trailing stop line, if enabled, is also plotted.
8. Buy and Sell Labels:
The script places labels on the chart when buy or sell signals are triggered, indicating the price at which the order should be placed.
9. Exit Line:
The script plots an exit line when the trailing stop is hit, signaling when a position should be closed.
10. Alerts:
Alerts are set for both buy and sell signals, notifying the trader when to act based on the strategy's conditions.
This strategy combines trend-following (Supertrend), momentum (RSI), and price action patterns (EMA crossovers and engulfing candlestick patterns) to generate trade signals. It also offers the flexibility of take profit, stop loss, and trailing stop features.

*Auto Backtest & Optimize EngineFull-featured Engine for Automatic Backtesting and parameter optimization. Allows you to test millions of different combinations of stop-loss and take profit parameters, including on any connected indicators.
⭕️ Key Futures
Quickly identify the optimal parameters for your strategy.
Automatically generate and test thousands of parameter combinations.
A simple Genetic Algorithm for result selection.
Saves time on manual testing of multiple parameters.
Detailed analysis, sorting, filtering and statistics of results.
Detailed control panel with many tooltips.
Display of key metrics: Profit, Win Rate, etc..
Comprehensive Strategy Score calculation.
In-depth analysis of the performance of different types of stop-losses.
Possibility to use to calculate the best Stop-Take parameters for your position.
Ability to test your own functions and signals.
Customizable visualization of results.
Flexible Stop-Loss Settings:
• Auto ━ Allows you to test all types of Stop Losses at once(listed below).
• S.VOLATY ━ Static stop based on volatility (Fixed, ATR, STDEV).
• Trailing ━ Classic trailing stop following the price.
• Fast Trail ━ Accelerated trailing stop that reacts faster to price movements.
• Volatility ━ Dynamic stop based on volatility indicators.
• Chandelier ━ Stop based on price extremes.
• Activator ━ Dynamic stop based on SAR.
• MA ━ Stop based on moving averages (9 different types).
• SAR ━ Parabolic SAR (Stop and Reverse).
Advanced Take-Profit Options:
• R:R: Risk/Reward ━ sets TP based on SL size.
• T.VOLATY ━ Calculation based on volatility indicators (Fixed, ATR, STDEV).
Testing Modes:
• Stops ━ Cyclical stop-loss testing
• Pivot Point Example ━ Example of using pivot points
• External Example ━ Built-in example how test functions with different parameters
• External Signal ━ Using external signals
⭕️ Usage
━ First Steps:
When opening, select any point on the chart. It will not affect anything until you turn on Manual Start mode (more on this below).
The chart will immediately show the best results of the default Auto mode. You can switch Part's to try to find even better results in the table.
Now you can display any result from the table on the chart by entering its ID in the settings.
Repeat steps 3-4 until you determine which type of Stop Loss you like best. Then set it in the settings instead of Auto mode.
* Example: I flipped through 14 parts before I liked the first result and entered its ID so I could visually evaluate it on the chart.
Then select the stop loss type, choose it in place of Auto mode and repeat steps 3-4 or immediately follow the recommendations of the algorithm.
Now the Genetic Algorithm at the bottom right will prompt you to enter the Parameters you need to search for and select even better results.
Parameters must be entered All at once before they are updated. Enter recommendations strictly in fields with the same names.
Repeat steps 5-6 until there are approximately 10 Part's left or as you like. And after that, easily pour through the remaining Parts and select the best parameters.
━ Example of the finished result.
━ Example of use with Takes
You can also test at the same time along with Take Profit. In this example, I simply enabled Risk/Reward mode and immediately specified in the TP field Maximum RR, Minimum RR and Step. So in this example I can test (3-1) / 0.1 = 20 Takes of different sizes. There are additional tips in the settings.
━
* Soon you will start to understand how the system works and things will become much easier.
* If something doesn't work, just reset the engine settings and start over again.
* Use the tips I have left in the settings and on the Panel.
━ Details:
Sort ━ Sorting results by Score, Profit, Trades, etc..
Filter ━ Filtring results by Score, Profit, Trades, etc..
Trade Type ━ Ability to disable Long\Short but only from statistics.
BackWin ━ Backtest Window Number of Candle the script can test.
Manual Start ━ Enabling it will allow you to call a Stop from a selected point. which you selected when you started the engine.
* If you have a real open position then this mode can help to save good Stop\Take for it.
1 - 9 Сheckboxs ━ Allow you to disable any stop from Auto mode.
Ex Source - Allow you to test Stops/Takes from connected indicators.
Connection guide:
//@version=6
indicator("My script")
rsi = ta.rsi(close, 14)
buy = not na(rsi) and ta.crossover (rsi, 40) // OS = 40
sell = not na(rsi) and ta.crossunder(rsi, 60) // OB = 60
Signal = buy ? +1 : sell ? -1 : 0
plot(Signal, "🔌Connector🔌", display = display.none)
* Format the signal for your indicator in a similar style and then select it in Ex Source.
⭕️ How it Works
Hypothesis of Uniform Distribution of Rare Elements After Mixing.
'This hypothesis states that if an array of N elements contains K valid elements, then after mixing, these valid elements will be approximately uniformly distributed.'
'This means that in a random sample of k elements, the proportion of valid elements should closely match their proportion in the original array, with some random variation.'
'According to the central limit theorem, repeated sampling will result in an average count of valid elements following a normal distribution.'
'This supports the assumption that the valid elements are evenly spread across the array.'
'To test this hypothesis, we can conduct an experiment:'
'Create an array of 1,000,000 elements.'
'Select 1,000 random elements (1%) for validation.'
'Shuffle the array and divide it into groups of 1,000 elements.'
'If the hypothesis holds, each group should contain, on average, 1~ valid element, with minor variations.'
* I'd like to attach more details to My hypothesis but it won't be very relevant here. Since this is a whole separate topic, I will leave the minimum part for understanding the engine.
Practical Application
To apply this hypothesis, I needed a way to generate and thoroughly mix numerous possible combinations. Within Pine, generating over 100,000 combinations presents significant challenges, and storing millions of combinations requires excessive resources.
I developed an efficient mechanism that generates combinations in random order to address these limitations. While conventional methods often produce duplicates or require generating a complete list first, my approach guarantees that the first 10% of possible combinations are both unique and well-distributed. Based on my hypothesis, this sampling is sufficient to determine optimal testing parameters.
Most generators and randomizers fail to accommodate both my hypothesis and Pine's constraints. My solution utilizes a simple Linear Congruential Generator (LCG) for pseudo-randomization, enhanced with prime numbers to increase entropy during generation. I pre-generate the entire parameter range and then apply systematic mixing. This approach, combined with a hybrid combinatorial array-filling technique with linear distribution, delivers excellent generation quality.
My engine can efficiently generate and verify 300 unique combinations per batch. Based on the above, to determine optimal values, only 10-20 Parts need to be manually scrolled through to find the appropriate value or range, eliminating the need for exhaustive testing of millions of parameter combinations.
For the Score statistic I applied all the same, generated a range of Weights, distributed them randomly for each type of statistic to avoid manual distribution.
Score ━ based on Trade, Profit, WinRate, Profit Factor, Drawdown, Sharpe & Sortino & Omega & Calmar Ratio.
⭕️ Notes
For attentive users, a little tricks :)
To save time, switch parts every 3 seconds without waiting for it to load. After 10-20 parts, stop and wait for loading. If the pause is correct, you can switch between the rest of the parts without loading, as they will be cached. This used to work without having to wait for a pause, but now it does slower. This will save a lot of time if you are going to do a deeper backtest.
Sometimes you'll get the error “The scripts take too long to execute.”
For a quick fix you just need to switch the TF or Ticker back and forth and most likely everything will load.
The error appears because of problems on the side of the site because the engine is very heavy. It can also appear if you set too long a period for testing in BackWin or use a heavy indicator for testing.
Manual Start - Allow you to Start you Result from any point. Which in turn can help you choose a good stop-stick for your real position.
* It took me half a year from idea to current realization. This seems to be one of the few ways to build something automatic in backtest format and in this particular Pine environment. There are already better projects in other languages, and they are created much easier and faster because there are no limitations except for personal PC. If you see solutions to improve this system I would be glad if you share the code. At the moment I am tired and will continue him not soon.
Also You can use my previosly big Backtest project with more manual settings(updated soon)

Milvetti_TraderPost_LibraryLibrary "Milvetti_TraderPost_Library"
This library has methods that provide practical signal transmission for traderpost.Developed By Milvetti
cancelOrders(symbol)
This method generates a signal in JSON format that cancels all orders for the specified pair. (If you want to cancel stop loss and takeprofit orders together, use the “exitOrder” method.
Parameters:
symbol (string)
exitOrders(symbol)
This method generates a signal in JSON format that close all orders for the specified pair.
Parameters:
symbol (string)
createOrder(ticker, positionType, orderType, entryPrice, signalPrice, qtyType, qty, stopLoss, stopType, stopValue, takeProfit, profitType, profitValue, timeInForce)
This function is designed to send buy or sell orders to traderpost. It can create customized orders by flexibly specifying parameters such as order type, position type, entry price, quantity calculation method, stop-loss, and take-profit. The purpose of the function is to consolidate all necessary details for opening a position into a single structure and present it as a structured JSON output. This format can be sent to trading platforms via webhooks.
Parameters:
ticker (string) : The ticker symbol of the instrument. Default value is the current chart's ticker (syminfo.ticker).
positionType (string) : Determines the type of order (e.g., "long" or "buy" for buying and "short" or "sell" for selling).
orderType (string) : Defines the order type for execution. Options: "market", "limit", "stop". Default is "market"
entryPrice (float) : The price level for entry orders. Only applicable for limit or stop orders. Default is 0 (market orders ignore this).
signalPrice (float) : Optional. Only necessary when using relative take profit or stop losses, and the broker does not support fetching quotes to perform the calculation. Default is 0
qtyType (string) : Determines how the order quantity is calculated. Options: "fixed_quantity", "dollar_amount", "percent_of_equity", "percent_of_position".
qty (float) : Quantity value. Can represent units of shares/contracts or a dollar amount, depending on qtyType.
stopLoss (bool) : Enable or disable stop-loss functionality. Set to `true` to activate.
stopType (string) : Specifies the stop-loss calculation type. Options: percent, "amount", "stopPrice", "trailPercent", "trailAmount". Default is "stopPrice"
stopValue (float) : Stop-loss value based on stopType. Can be a percentage, dollar amount, or a specific stop price. Default is "stopPrice"
takeProfit (bool) : Enable or disable take-profit functionality. Set to `true` to activate.
profitType (string) : Specifies the take-profit calculation type. Options: "percent", "amount", "limitPrice". Default is "limitPrice"
profitValue (float) : Take-profit value based on profitType. Can be a percentage, dollar amount, or a specific limit price. Default is 0
timeInForce (string) : The time in force for your order. Options: day, gtc, opg, cls, ioc and fok
Returns: Return result in Json format.
addTsl(symbol, stopType, stopValue, price)
This method adds trailing stop loss to the current position. “Price” is the trailing stop loss starting level. You can leave price blank if you want it to start immediately
Parameters:
symbol (string)
stopType (string) : Specifies the trailing stoploss calculation type. Options: "trailPercent", "trailAmount".
stopValue (float) : Stop-loss value based on stopType. Can be a percentage, dollar amount.
price (float) : The trailing stop loss starting level. You can leave price blank if you want it to start immediately. Default is current price.
Atr Target TP & Protecion Zone [Pinescriptlabs]This indicator provides an adaptive trailing stop system with dynamic price targets and protection zones, ideal for position management.
Main Features:
🚦 ADAPTIVE TRAILING STOP:
Automatically adjusts based on volatility (ATR) and volume
Two modes: "Modified" and "UnModified" for true range calculation
Displayed as a line with colored background (green for longs, red for shorts)
🎯 TARGET ZONES (T1 & T2):
Calculates two target zones (T1 and T2) based on:
Market strength (combination of RSI, volume, MFI, ADX, MACD)
Current volatility (ATR)
Distance from current price
Visualized with blue boxes (T1) and purple boxes (T2)
🛡️ PROTECTION ZONE:
Automatically activates in sideways markets
Provides an additional buffer to the trailing stop
Helps avoid premature exits in volatile markets
📊 INFORMATION PANELS:
Top Right Panel displays:
Current trend direction
Target status (T1 & T2)
Market strength
Current ATR
RSI level
Bottom Right Panel displays:
Trailing status (WIDE/NORMAL)
Volume impact
Directional strength
Protection zone status
Español:
Este indicador proporciona un sistema de trailing stop adaptativo con objetivos de precio dinámicos y zonas de protección, ideal para la gestión de posiciones.
**Características Principales**:
🚦 **TRAILING STOP ADAPTATIVO**:
- Se ajusta automáticamente según la volatilidad (ATR) y el volumen
- Dos modos: "Modified" y "UnModified" para el cálculo del rango verdadero
- Se visualiza como una línea con fondo coloreado (verde para largos, rojo para cortos)
🎯 **ZONAS OBJETIVO (T1 y T2)**:
- Calcula dos zonas objetivo (T1 y T2) basadas en:
- Fuerza del mercado (combinación de RSI, volumen, MFI, ADX, MACD)
- Volatilidad actual (ATR)
- Distancia al precio actual
- Visualización mediante cajas azules (T1) y moradas (T2)
🛡️ **ZONA DE PROTECCIÓN**:
- Se activa automáticamente en mercados laterales
- Proporciona un buffer adicional al trailing stop
- Ayuda a evitar salidas prematuras en mercados volátiles
📊 **PANELES INFORMATIVOS**:
*Panel Superior Derecho* muestra:
- Dirección de la tendencia actual
- Estado de los objetivos (T1 y T2)
- Fuerza del mercado
- ATR actual
- Nivel de RSI
*Panel Inferior Derecho* muestra:
- Estado del trailing (WIDE/NORMAL)
- Impacto del volumen
- Fuerza direccional
- Estado de la zona de protección

Martingale with MACD+KDJ opening conditionsStrategy Overview:
This strategy is based on a Martingale trading approach, incorporating MACD and KDJ indicators. It features pyramiding, trailing stops, and dynamic profit-taking mechanisms, suitable for both long and short trades. The strategy increases position size progressively using a Multiplier, a key feature of Martingale systems.
Key Concepts:
Martingale Strategy: A trading system where positions are doubled or increased after a loss to recover previous losses with a single successful trade. In this script, the position size is incremented using a Multiplier for each addition.
Pyramiding: Allows adding to existing trades when market conditions are favorable, enhancing profitability during trends.
Settings:
Basic Inputs:
Initial Order: Defines the starting size of the position.
Default: 150.0
MACD Settings: Customize the fast, slow, and signal smoothing lengths.
Default: Fast Length: 9, Slow Length: 26, Signal Smoothing: 9
KDJ Settings: Customize the length and smoothing parameters for KDJ.
Default: Length: 14, Smooth K: 3, Smooth D: 3
Max Additions: Sets the number of additional positions (pyramiding).
Default: 5 (Min: 1, Max: 10)
Position Sizing: Percent to add to positions on favorable conditions.
Default: 1.0%
Martingale Multiplier:
Add Multiplier: This value controls the scaling of additional positions according to the Martingale principle. After each loss, a new position is added, and its size is increased by the Multiplier factor. For example, with a multiplier of 2, each new addition will be twice as large as the previous one, accelerating recovery if the price moves favorably.
Default: 1.0 (no multiplication)
Can be adjusted up to 10x to aggressively increase position size after losses.
Trade Execution:
Long Trades:
Entry Condition: A long position is opened when the MACD line crosses over the signal line, and the KDJ’s %K crosses above %D.
Additions (Martingale): After the initial long position, new positions are added if the price drops by the defined percentage, and each new addition is increased using the Multiplier. This continues up to the set Max Additions.
Short Trades:
Entry Condition: A short position is opened when the MACD line crosses under the signal line, and the KDJ’s %K crosses below %D.
Additions (Martingale): After the initial short position, new positions are added if the price rises by the defined percentage, and each new addition is increased using the Multiplier.
Exit Conditions:
Take Profit: Exits are triggered when the price reaches the take-profit threshold.
Stop Loss: If the price moves unfavorably, the position will be closed at the set stop-loss level.
Trailing Stop: Adjusts dynamically as the price moves in favor of the trade to lock in profits.
On-Chart Visuals:
Long Signals: Blue triangles below the bars indicate long entries, and green triangles mark additional long positions.
Short Signals: Red triangles above the bars indicate short entries, and orange triangles mark additional short positions.
Information Table:
The strategy displays a table with key metrics:
Open Price: The entry price of the trade.
Average Price: The average price of the current position.
Additions: The number of additional positions taken.
Next Add Price: The price level for the next position.
Take Profit: The price at which profits will be taken.
Stop Loss: The stop-loss level to minimize risk.
Usage Instructions:
Adjust the parameters to your trading style using the input settings.
The Multiplier amplifies your position size after each addition, so use it cautiously, especially in volatile markets.
Monitor the signals and table on the chart for entry/exit decisions and trade management.

Double CCI Confirmed Hull Moving Average Reversal StrategyOverview
The Double CCI Confirmed Hull Moving Average Strategy utilizes hull moving average (HMA) in conjunction with two commodity channel index (CCI) indicators: the slow and fast to increase the probability of entering when the short and mid-term uptrend confirmed. The main idea is to wait until the price breaks the HMA while both CCI are showing that the uptrend has likely been already started. Moreover, strategy uses exponential moving average (EMA) to trail the price when it reaches the specific level. The strategy opens only long trades.
Unique Features
Dynamic stop-loss system: Instead of fixed stop-loss level strategy utilizes average true range (ATR) multiplied by user given number subtracted from the position entry price as a dynamic stop loss level.
Configurable Trading Periods: Users can tailor the strategy to specific market windows, adapting to different market conditions.
Double trade setup confirmation: Strategy utilizes two different period CCI indicators to confirm the breakouts of HMA.
Trailing take profit level: After reaching the trailing profit activation level scrip activate the trailing of long trade using EMA. More information in methodology.
Methodology
The strategy opens long trade when the following price met the conditions:
Short-term period CCI indicator shall be above 0.
Long-term period CCI indicator shall be above 0.
Price shall cross the HMA and candle close above it with the same candle
When long trade is executed, strategy set the stop-loss level at the price ATR multiplied by user-given value below the entry price. This level is recalculated on every next candle close, adjusting to the current market volatility.
At the same time strategy set up the trailing stop validation level. When the price crosses the level equals entry price plus ATR multiplied by user-given value script starts to trail the price with EMA. If price closes below EMA long trade is closed. When the trailing starts, script prints the label “Trailing Activated”.
Strategy settings
In the inputs window user can setup the following strategy settings:
ATR Stop Loss (by default = 1.75)
ATR Trailing Profit Activation Level (by default = 2.25)
CCI Fast Length (by default = 25, used for calculation short term period CCI
CCI Slow Length (by default = 50, used for calculation long term period CCI)
Hull MA Length (by default = 34, period of HMA, which shall be broken to open trade)
Trailing EMA Length (by default = 20)
User can choose the optimal parameters during backtesting on certain price chart.
Justification of Methodology
Before understanding why this particular combination of indicator has been chosen let's briefly explain what is CCI and HMA.
The Commodity Channel Index (CCI) is a momentum-based technical indicator used in trading to measure a security's price relative to its average price over a given period. Developed by Donald Lambert in 1980, the CCI is primarily used to identify cyclical trends in a security, helping traders to spot potential buying or selling opportunities.
The CCI formula is:
CCI = (Typical Price − SMA) / (0.015 × Mean Deviation)
Typical Price (TP): This is calculated as the average of the high, low, and closing prices for the period.
Simple Moving Average (SMA): This is the average of the Typical Prices over a specific number of periods.
Mean Deviation: This is the average of the absolute differences between the Typical Price and the SMA.
The result is a value that typically fluctuates between +100 and -100, though it is not bounded and can go higher or lower depending on the price movement.
The Hull Moving Average (HMA) is a type of moving average that was developed by Alan Hull to improve upon the traditional moving averages by reducing lag while maintaining smoothness. The goal of the HMA is to create an indicator that is both quick to respond to price changes and less prone to whipsaws (false signals).
How the Hull Moving Average is Calculated?
The Hull Moving Average is calculated using the following steps:
Weighted Moving Average (WMA): The HMA starts by calculating the Weighted Moving Average (WMA) of the price data over a period square root of n (sqrt(n))
Speed Adjustment: A WMA is then calculated for half of the period n/2, and this is multiplied by 2 to give more weight to recent prices.
Lag Reduction: The WMA of the full period n is subtracted from the doubled n/2 WMA.
Final Smoothing: To smooth the result and reduce noise, a WMA is calculated for the square root of the period n.
The formula can be represented as:
HMA(n) = WMA(WMA(n/2) × 2 − WMA(n), sqrt(n))
The Weighted Moving Average (WMA) is a type of moving average that gives more weight to recent data points, making it more responsive to recent price changes than a Simple Moving Average (SMA). In a WMA, each data point within the selected period is multiplied by a weight, with the most recent data receiving the highest weight. The sum of these weighted values is then divided by the sum of the weights to produce the WMA.
This strategy leverages HMA of user given period as a critical level which shall be broken to say that probability of trend change to the upside increased. HMA reacts faster than EMA or SMA to the price change, that’s why it increases chances to enter new trade earlier. Long-term period CCI helps to have an approximation of mid-term trend. If it’s above 0 the probability of uptrend increases. Short-period CCI allows to have an approximation of short-term trend reversal from down to uptrend. This approach increases chances to have a long trade setup in the direction of mid-term trend when the short-term trend starts to reverse.
ATR is used to adjust the strategy risk management to the current market volatility. If volatility is low, we don’t need the large stop loss to understand the there is a high probability that we made a mistake opening the trade. User can setup the settings ATR Stop Loss and ATR Trailing Profit Activation Level to realize his own risk to reward preferences, but the unique feature of a strategy is that after reaching trailing profit activation level strategy is trying to follow the trend until it is likely to be finished instead of using fixed risk management settings. It allows sometimes to be involved in the large movements. It’s also important to make a note, that script uses HMA to enter the trade, but for trailing it leverages EMA. It’s used because EMA has no such fast reaction to price move which increases probability not to be stopped out from any significant uptrend move.
Backtest Results
Operating window: Date range of backtests is 2022.07.01 - 2024.08.01. It is chosen to let the strategy to close all opened positions.
Commission and Slippage: Includes a standard Binance commission of 0.1% and accounts for possible slippage over 5 ticks.
Initial capital: 10000 USDT
Percent of capital used in every trade: 100%
Maximum Single Position Loss: -4.67%
Maximum Single Profit: +19.66%
Net Profit: +14897.94 USDT (+148.98%)
Total Trades: 104 (36.54% win rate)
Profit Factor: 2.312
Maximum Accumulated Loss: 1302.66 USDT (-9.58%)
Average Profit per Trade: 143.25 USDT (+0.96%)
Average Trade Duration: 34 hours
These results are obtained with realistic parameters representing trading conditions observed at major exchanges such as Binance and with realistic trading portfolio usage parameters.
How to Use
Add the script to favorites for easy access.
Apply to the desired timeframe and chart (optimal performance observed on 2h BTC/USDT).
Configure settings using the dropdown choice list in the built-in menu.
Set up alerts to automate strategy positions through web hook with the text: {{strategy.order.alert_message}}
Disclaimer:
Educational and informational tool reflecting Skyrex commitment to informed trading. Past performance does not guarantee future results. Test strategies in a simulated environment before live implementation

SVMKR_UT_Bot_HMA_UCS_LRSThis Pine Script code is a TradingView study script titled "SVMKR_UT_Bot_HMA_UCS_LRS". It combines two separate trading indicators: the UT Bot (Ultimate Trailing Stop Bot) and the UCS_LRS (Linear Regression Slope) indicator.
UT Bot (Ultimate Trailing Stop Bot):
The UT Bot is designed to provide buy and sell signals based on a trailing stop strategy.
It calculates the trailing stop level using the Average True Range (ATR) and Heikin Ashi candle signals if enabled.
Buy signals are generated when the price crosses above the trailing stop, while sell signals occur when the price crosses below the trailing stop.
Additionally, buy and sell signals are visually represented on the chart with corresponding labels and shapes.
The script also includes options to customize the sensitivity of the trailing stop and to color the bars based on buy or sell signals.
Hull Moving Average (HMA):
This section calculates and plots the Hull Moving Average, a type of moving average that reduces lag and improves smoothing compared to traditional moving averages.
It uses the weighted moving average (WMA) to compute the HMA, which helps to identify trend direction and potential reversal points.
UCS_LRS (Linear Regression Slope):
The UCS_LRS indicator calculates the linear regression slope of the closing prices over a specified period.
It then applies exponential smoothing to the slope values and calculates an average slope.
Buy signals are generated when the current slope is greater than the average slope and positive, indicating an uptrend.
Conversely, sell signals are generated when the current slope is less than the average slope and negative, suggesting a downtrend.
The linear regression slope and its average are plotted on the chart, allowing traders to visually identify trend strength and potential reversal points.
Overall, this combined script provides traders with a comprehensive set of tools for trend following and momentum trading strategies, integrating trailing stop analysis, moving average smoothing, and linear regression slope analysis into a single script for technical analysis on TradingView charts.
