Buscar en scripts para "Rsi"


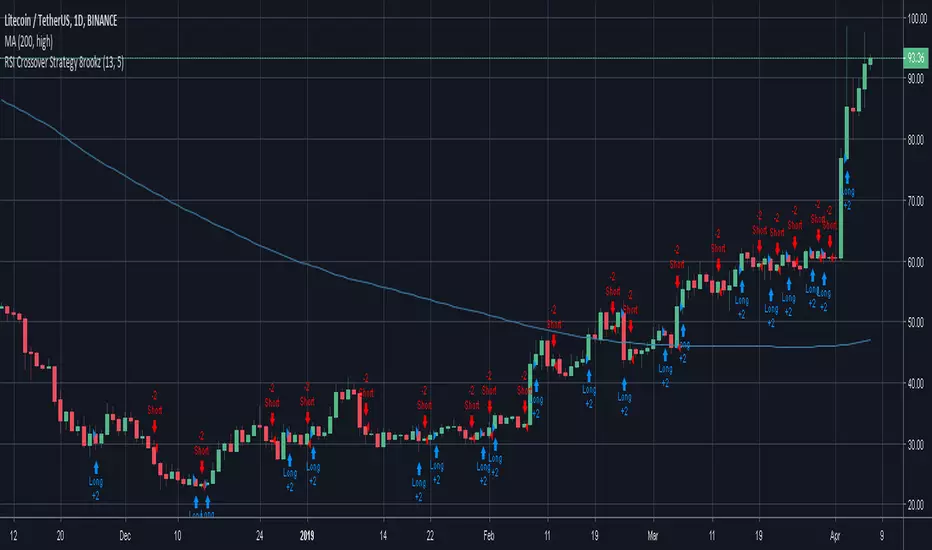
RSI Crossover Strategy 8rookzRSI Crossover Strategy
used to create entry points for increasing relative strength


RSI TRI With Mid Point and HighlightsRSI that has the 50 line plotted plus it highlights overbought and oversold conditions.


RSI+Bollinger Bands+ EMARSI on pivot points (you can chose the source) with Bollinger Bands and a EMA


RSI Currency Strength IndicatorRSI based currency strength indicator. Other indicators only give 7 currencies, leaving NZD. This one is an updated version which gives all 8 major currencies.


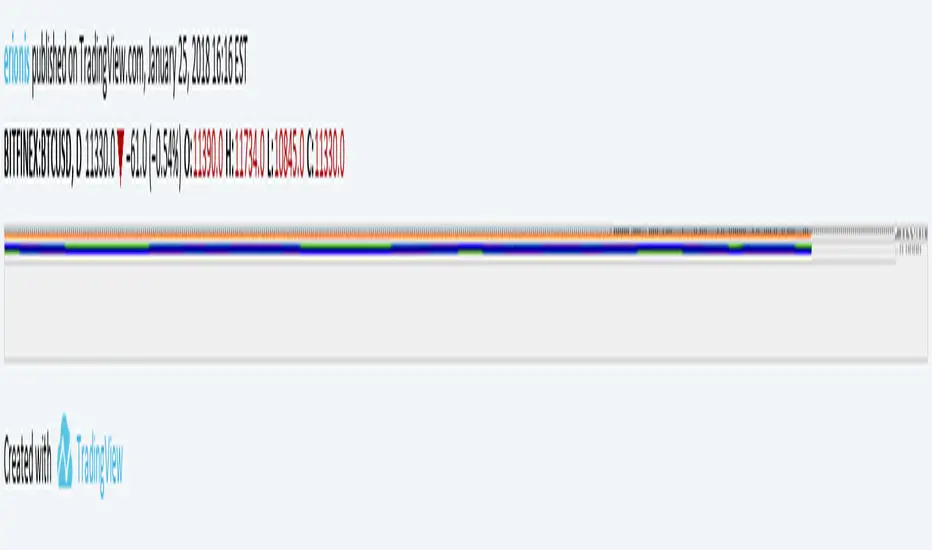
RSI with Bollinger Bands [Erionis]RSI + Bollinger Bands. Usefull to see possible reversal points. Use it accordingly.