Golden/Death X BF 🚀A golden cross occurs when the 50 MA crosses above the 200 MA.
A death cross occurs when the 50 MA crosses below the 200 MA.
You can adjust the following settings for each Moving Average:
Source - open, high, low, close, hl2, hlc3, ohlc4
Type - sma, ema, swma, wma
Period - integers greater than 0
The chart background turns green or red upon a cross.
Buscar en scripts para "OHLC"

BTC Daily Strategy BFStrategy based on code by @CredibleHulk so thanks for that.
This is a strategy for the Daily Bitcoin chart which uses the MACD, RSI, Stochastic RSI and a moving average.
The conditions for long or short signals depend on the indicators above crossing user-defined thresholds.
Long signal = (Stochastic RSI k value is below Stochastic Sell Threshold) AND EITHER (MACD delta crosses above MACD Threshold OR RSI crosses above RSI Threshold)
Short signal = (MACD delta crosses below 0) AND EITHER (Close Price - an SMA of the ohlc4 values crosses below the DMA threshold OR Stochastic RSI k value is above Stochastic Sell Threshold)
INSTRUCTIONS
Green background = go long
Red background = go short
You can adjust stop loss values for long or short signals in settings as well as all parameters for the indicators.

Combo Backtest 123 Reversal & Chaikin Volatility This is combo strategies for get a cumulative signal.
First strategy
This System was created from the Book "How I Tripled My Money In The
Futures Market" by Ulf Jensen, Page 183. This is reverse type of strategies.
The strategy buys at market, if close price is higher than the previous close
during 2 days and the meaning of 9-days Stochastic Slow Oscillator is lower than 50.
The strategy sells at market, if close price is lower than the previous close price
during 2 days and the meaning of 9-days Stochastic Fast Oscillator is higher than 50.
Second strategy
Chaikin's Volatility indicator compares the spread between a security's
high and low prices. It quantifies volatility as a widening of the range
between the high and the low price.
You can use in the xPrice1 and xPrice2 any series: Open, High, Low, Close, HL2,
HLC3, OHLC4 and ect...
WARNING:
- For purpose educate only
- This script to change bars colors.

Combo Strategy 123 Reversal & Chaikin Volatility This is combo strategies for get a cumulative signal.
First strategy
This System was created from the Book "How I Tripled My Money In The
Futures Market" by Ulf Jensen, Page 183. This is reverse type of strategies.
The strategy buys at market, if close price is higher than the previous close
during 2 days and the meaning of 9-days Stochastic Slow Oscillator is lower than 50.
The strategy sells at market, if close price is lower than the previous close price
during 2 days and the meaning of 9-days Stochastic Fast Oscillator is higher than 50.
Second strategy
Chaikin's Volatility indicator compares the spread between a security's
high and low prices. It quantifies volatility as a widening of the range
between the high and the low price.
You can use in the xPrice1 and xPrice2 any series: Open, High, Low, Close, HL2,
HLC3, OHLC4 and ect...
WARNING:
- For purpose educate only
- This script to change bars colors.

Combo Backtest 123 Reversal & Bandpass FilterThis is combo strategies for get
a cumulative signal. Result signal will return 1 if two strategies
is long, -1 if all strategies is short and 0 if signals of strategies is not equal.
First strategy
This System was created from the Book "How I Tripled My Money In The
Futures Market" by Ulf Jensen, Page 183. This is reverse type of strategies.
The strategy buys at market, if close price is higher than the previous close
during 2 days and the meaning of 9-days Stochastic Slow Oscillator is lower than 50.
The strategy sells at market, if close price is lower than the previous close price
during 2 days and the meaning of 9-days Stochastic Fast Oscillator is higher than 50.
Second strategy
The related article is copyrighted material from
Stocks & Commodities Mar 2010
You can use in the xPrice any series: Open, High, Low, Close, HL2, HLC3, OHLC4 and ect...
WARNING:
- For purpose educate only
- This script to change bars colors.

Combo Strategy 123 Reversal & Bandpass Filter This is combo strategies for get
a cumulative signal. Result signal will return 1 if two strategies
is long, -1 if all strategies is short and 0 if signals of strategies is not equal.
First strategy
This System was created from the Book "How I Tripled My Money In The
Futures Market" by Ulf Jensen, Page 183. This is reverse type of strategies.
The strategy buys at market, if close price is higher than the previous close
during 2 days and the meaning of 9-days Stochastic Slow Oscillator is lower than 50.
The strategy sells at market, if close price is lower than the previous close price
during 2 days and the meaning of 9-days Stochastic Fast Oscillator is higher than 50.
Second strategy
The related article is copyrighted material from
Stocks & Commodities Mar 2010
You can use in the xPrice any series: Open, High, Low, Close, HL2, HLC3, OHLC4 and ect...
WARNING:
- For purpose educate only
- This script to change bars colors.

line plotline plot any of the following or any combination of them together:
high, low, open, close, hl2, ohlc4

RSI with BBs by EddieRSI based on ohlc4 (instead of close) with bollinger bands applied
red/green area = Delta Rsi and BBbase
use upper and lower bb bands as better oversold/overbought signal on high timeframes

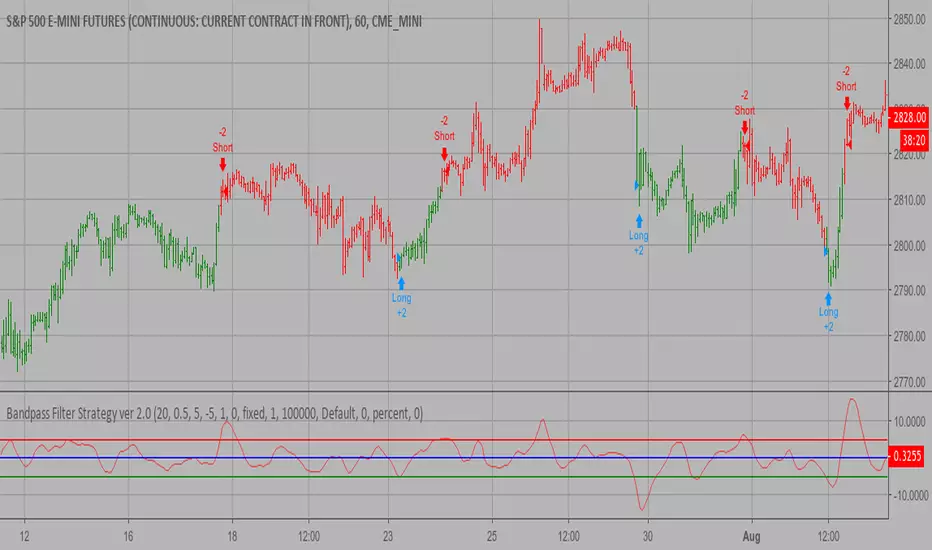
Bandpass Filter Strategy ver 2.0 The related article is copyrighted material from
Stocks & Commodities Mar 2010
You can use in the xPrice any series: Open, High, Low, Close, HL2, HLC3, OHLC4 and ect...
You can change long to short in the Input Settings
WARNING:
- For purpose educate only
- This script to change bars colors.
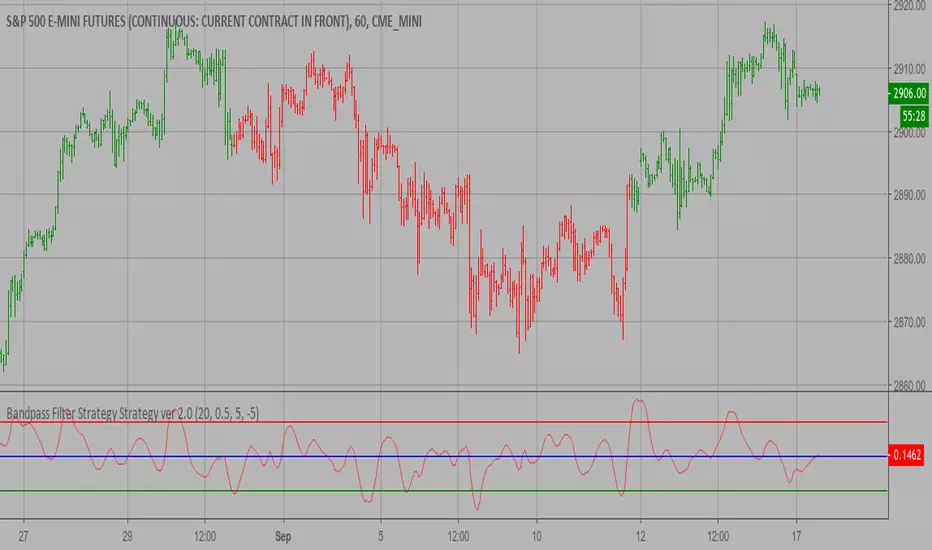
Bandpass Filter Strategy ver 2.0 The related article is copyrighted material from
Stocks & Commodities Mar 2010
You can use in the xPrice any series: Open, High, Low, Close, HL2, HLC3, OHLC4 and ect...
WARNING:
- This script to change bars colors.
Noro's ShiftMA Strategy v1.1For crypto, any timeframe.
In the strategy of ShiftMA the feature to open short positions is added.
Marginal trade isn't used (if not to use short positions).
The red line - short positions open here.
The lime line - long positions open here.
Becoming blue the line - SMA - here are closed all positions.
For "BTC/USD" or "ETH/USD":
SMA period = 3
Source for SMA = "OHLC4" or "HLC3" or "Close"
Short-line = SMA +10%
Long-line = SMA -5%

Noro's Levels Strategy v1.1For:
- "btc/usd", "eth/usd"
- timeframe: 1h, 2h, 3h, 4h
- source: close or OHLC4
Strategy
From the price of last candle the line is drawn (timeframe are chosen)
The same line is drawn from the price of other timeframe
If the price is higher than both lines - uptrend
If the price is lower than both lines - downtrend

Noro's Trend MAs Strategy v2.0Don't use on pairs of type "crypto/crypto"!
Only for pairs like "crypto/fiat" ("BTC/USD", "BTC/CNY", "ETH/USD", "ETH/CNY", etc)
Trade strategy which uses only 2 MA.
The slow MA (blue) is used for definition of a trend
The fast MA (red) is used for an entrance to the transaction
For:
- For H1
- For crypto/fiat
- Good for "BTC/USD", "ETH/USD"
Recomended:
Long = true (if it is profitable as a result of backtests)
Short = true (if it is profitable as a result of backtests)
Stops = false
Stop, % = any
OHLC4 = any
Use Fast MA = true
Fast MA Period = 5
Slow MA Period = 21
Bars Q = (2 for "bitcoin/fiat" or 1 for "crypto/fiat")
Extreme = true (if "crypto/fiat")
In the new version 2.0
- CryptoBottom is added

Noro's Trend MAs Strategy v1.9 ExtremeExtreme version of Noro's Trend MAs strategy.
Don't use on pairs of type "crypto/crypto"!
Only for pairs like "crypto/fiat" ("BTC/USD", "BTC/CNY", "ETH/USD", "ETH/CNY", etc)
Trade strategy which uses only 2 MA.
The slow MA (blue) is used for definition of a trend
The fast MA (red) is used for an entrance to the transaction
For:
- For H1
- For crypto/fiat
- Good for "BTC/USD", "ETH/USD"
Recomended:
Long = true (if it is profitable as a result of backtests)
Short = true (if it is profitable as a result of backtests)
Stops = false
Stop, % = any
OHLC4 = any
Use Fast MA = true
Fast MA Period = 5
Slow MA Period = 21
Bars Q = (2 for "bitcoin/fiat" or 1 for "crypto/fiat")
Extreme = true (if "crypto/fiat")
In the new version 1.9
- Extreme is added

Noro's Trend MAs Strategy v1.8Trade strategy which uses only 2 MA.
The slow MA (blue) is used for definition of a trend
The fast MA (red) is used for an entrance to the transaction
For:
- For H1
- For crypto/fiat or crypto/crypto
- Good for "BTC/USD", "ETH/USD", "ETH/BTC"
Recomended:
Long = true (if it is profitable as a result of backtests)
Short = true (if it is profitable as a result of backtests)
Stops = false
Stop, % = any
OHLC4 = any
Use Fast MA = true
Fast MA Period = 5
Slow MA Period = 21
Bars Q = (2 for "bitcoin/fiat" or 1 for "crypto/fiat" or 0 for "crypto/crypto")
In the new version 1.8
- The second PriceChannel is added
- Profit became more
- Losses became less
- The unnecessary types of MA are removed

Noro's Trend MAs Strategy v1.7Trade strategy which uses only 2 MA.
The slow MA (blue) is used for definition of a trend
The fast MA (red) is used for an entrance to the transaction
For:
- For H1
- For crypto/fiat
Recomended:
Long = true (if it is profitable as a result of backtests)
Short = true (if it is profitable as a result of backtests)
Stops = false
Stop, % = any
Type of slow MA = 7 (only for Crypto/Fiat)
Source of slow MA = close or OHLC4
Use Fast MA = true
Fast MA Period = 5
Slow MA Period = 20
Bars Q = (2 for "BitCoin/Fiat" or 1 for "Fork/Fiat")
In the new version 1.7
+ stoporders
+ entry arrow (black)
Types of slow MA:
1 = SMA = Simple Moving Average
2 = EMA = Exponential Moving Average
3 = VWMA = Volume-Weighted Moving Average
4 = DEMA = Double Exponential Moving Average
5 = TEMA = Triple Exponential Moving Average
6 = KAMA = Kaufman's Adaptive Moving Average
7 = Price Channel

Noro's Trend MAs Strategy v1.6Trade strategy which uses only 2 MA.
The slow MA (blue) is used for definition of a trend
The fast MA (red) is used for an entrance to the transaction
For:
- For H1
- For crypto/fiat
Recomended:
Long = true (if it is profitable as a result of backtests)
Short = true (if it is profitable as a result of backtests)
Type of slow MA = 7 (only for Crypto/Fiat)
Source of slow MA = close or OHLC4
Use Fast MA = true
Fast MA Period = 5
Slow MA Period = 20
Bars Q = (2 for "BitCoin/Fiat" or 1 for "Fork/Fiat")
In the new version 1.5
+ Profit became more
+ Losses became less
+ Alerts
+ Background (lime = uptrend, red = downtrend)
Types of slow MA:
1 = SMA = Simple Moving Average
2 = EMA = Exponential Moving Average
3 = VWMA = Volume-Weighted Moving Average
4 = DEMA = Double Exponential Moving Average
5 = TEMA = Triple Exponential Moving Average
6 = KAMA = Kaufman's Adaptive Moving Average
7 = Price Channel

Noro's Trend MAs Strategy 1.5Trade strategy which uses only 2 MA .
The slow MA (blue) is used for definition of a trend
The fast MA (red) is used for an entrance to the transaction
For:
- For H1
- For crypto/fiat
Recomended:
Long = true (if it is profitable as a result of backtests)
Short = true (if it is profitable as a result of backtests)
Type of slow MA = 7 (only for Crypto/Fiat)
Source of slow MA = clole or OHLC4
Use Fast MA = true
Fast MA Period = 5
Slow MA Period = 20
Bars Q = (2 for "BitCoin/Fiat" or 1 for "Fork/Fiat")
In the new version 1.5
+ Source
+ Types of slow MA
Types of slow MA:
1 = SMA = Simple Moving Average
2 = EMA = Exponential Moving Average
3 = VWMA = Volume-Weighted Moving Average
4 = DEMA = Double Exponential Moving Average
5 = TEMA = Triple Exponential Moving Average
6 = KAMA = Kaufman's Adaptive Moving Average
7 = Price Channel
PS: 100000000%, because of use of a piramiding have turned out

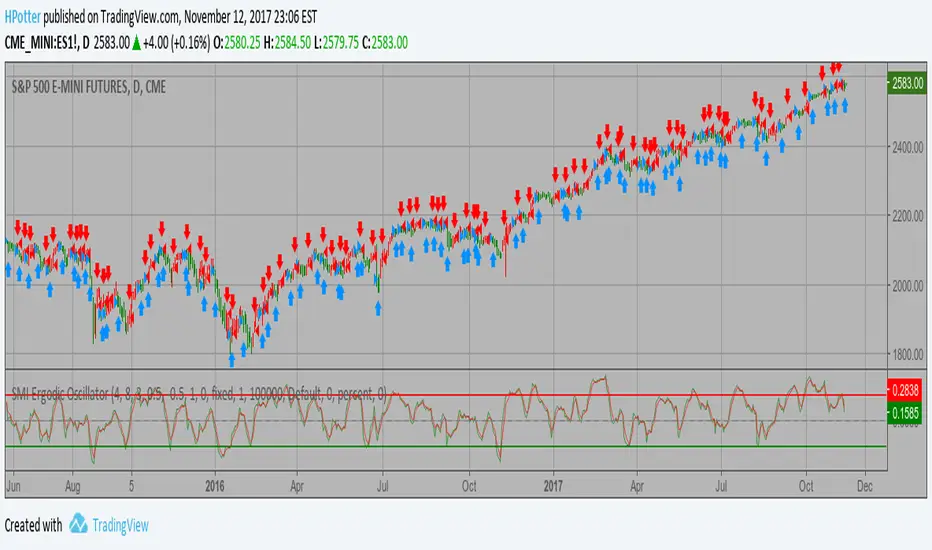
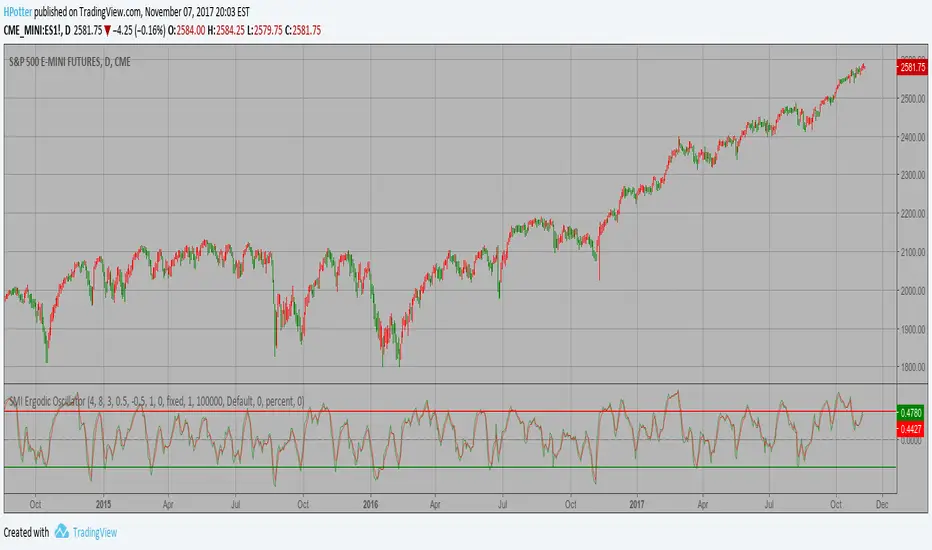
SMI Ergodic Oscillator Backtest ver.2 The SMI Ergodic Indicator is the same as the True Strength Index (TSI) developed by
William Blau, except the SMI includes a signal line. The SMI uses double moving averages
of price minus previous price over 2 time frames. The signal line, which is an EMA of the
SMI, is plotted to help trigger trading signals. Adjustable guides are also given to fine
tune these signals. The user may change the input (close), method (EMA), period lengths
and guide values.
You can use in the xPrice any series: Open, High, Low, Close, HL2, HLC3, OHLC4 and ect...
WARNING:
- For purpose educate only
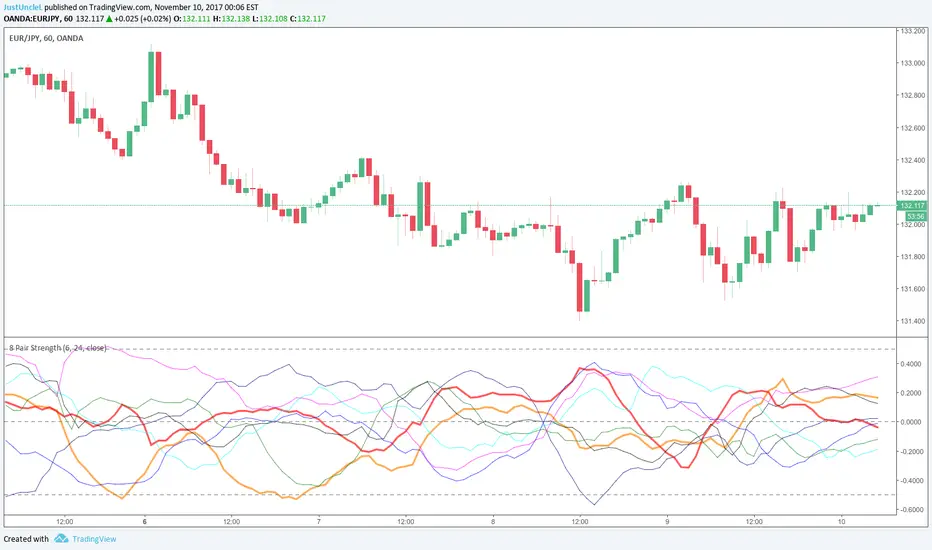
8 Pair Strength R2.0 updated by JustUncleLThis is an updated script Originally written by @glaz
Description:
This study is a version of Currency Strength Meter, that utilises TradingView's built-in "True Strength Index" (TSI) function. The TSI uses moving averages of the underlying momentum of a financial instrument.
Modifications:
10-Nov-2017 by JustUncleL
Corrected the weighting on JPY pairs, by dividing their close values by 100 to bring them within 1.0 range of the other pairs.
Added option to use different Data Source, eg hl2, hlc3, ohlc4 etc.
Updated to PineScript version 3.
Updated variable names to reflect their origin.
SMI Ergodic Oscillator Strategy ver.2 The SMI Ergodic Indicator is the same as the True Strength Index (TSI) developed by
William Blau, except the SMI includes a signal line. The SMI uses double moving averages
of price minus previous price over 2 time frames. The signal line, which is an EMA of the
SMI, is plotted to help trigger trading signals. Adjustable guides are also given to fine
tune these signals. The user may change the input (close), method (EMA), period lengths
and guide values.
You can use in the xPrice any series: Open, High, Low, Close, HL2, HLC3, OHLC4 and ect...
WARNING:
- For purpose educate only
SMI Ergodic Oscillator Backtest The SMI Ergodic Indicator is the same as the True Strength Index (TSI) developed by
William Blau, except the SMI includes a signal line. The SMI uses double moving averages
of price minus previous price over 2 time frames. The signal line, which is an EMA of the
SMI, is plotted to help trigger trading signals. Adjustable guides are also given to fine
tune these signals. The user may change the input (close), method (EMA), period lengths
and guide values.
You can use in the xPrice any series: Open, High, Low, Close, HL2, HLC3, OHLC4 and ect...
You can change long to short in the Input Settings
WARNING:
- For purpose educate only
- This script to change bars colors.

SMI Ergodic Oscillator Strategy The SMI Ergodic Indicator is the same as the True Strength Index (TSI) developed by
William Blau, except the SMI includes a signal line. The SMI uses double moving averages
of price minus previous price over 2 time frames. The signal line, which is an EMA of the
SMI, is plotted to help trigger trading signals. Adjustable guides are also given to fine
tune these signals. The user may change the input (close), method (EMA), period lengths
and guide values.
You can use in the xPrice any series: Open, High, Low, Close, HL2, HLC3, OHLC4 and ect...
WARNING:
- This script to change bars colors.
