Trend Buy/Sell Fibonacci Range - KLTThe Trend Buy/Sell Fibonacci Range – KLT indicator identifies bullish and bearish trends based on where the closing price is located within a Fibonacci range calculated from the last N candles (default is 10). Instead of analyzing individual candles, this tool takes a broader view of price action using Fibonacci retracement levels across a dynamic multi-candle range.
How It Works:
Range Calculation
The indicator calculates the highest high and lowest low over the last N candles to define the active price range (default: 10 bars).
Fibonacci Levels
Within this range, Fibonacci levels (0.236, 0.382, 0.5, 0.618, 0.786) are dynamically computed. These levels act as internal thresholds to evaluate bullish or bearish pressure.
Trend Identification (via Close Position):
If the closing price is above the 0.618 level, it indicates strong buy pressure → the candle turns green and an upward triangle appears.
If the closing price is below the 0.382 level, it suggests strong sell pressure → the candle turns red and a downward triangle is displayed.
If the close lies between 0.382 and 0.618, the market is considered neutral, and the candle is gray.
Visual Elements:
Colored candles to immediately spot trend conditions.
Triangle signals (optional) for clear Buy/Sell markers.
Fibonacci level lines plotted on the chart for full context (can be toggled on/off).
Customization Options:
Lookback period (number of candles to calculate the range)
Fibonacci threshold levels (upper/lower)
Show/hide arrows and Fibonacci lines
Why Use This Indicator?
This tool is perfect for traders who want a simple visual method to assess trend strength based on price structure, not indicators derived from lagging moving averages. It offers:
Cleaner market structure analysis
Objective trend zones
Customizable sensitivity
Recommended Use:
Works well in conjunction with support/resistance zones, volume, or momentum indicators.
Applicable to any asset class or timeframe.
Credits:
Developed by KLT, combining structure-based logic with Fibonacci precision.
Buscar en scripts para "N+credit最新动态"

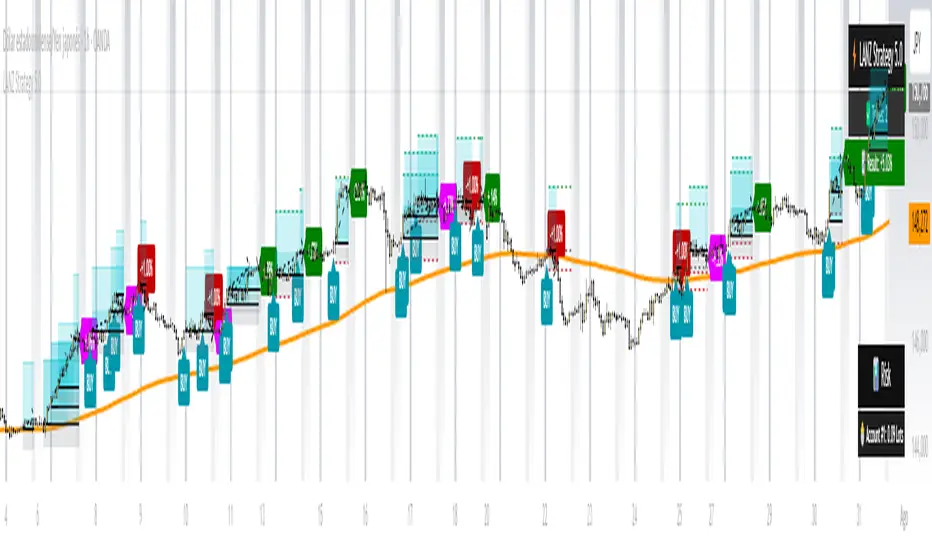
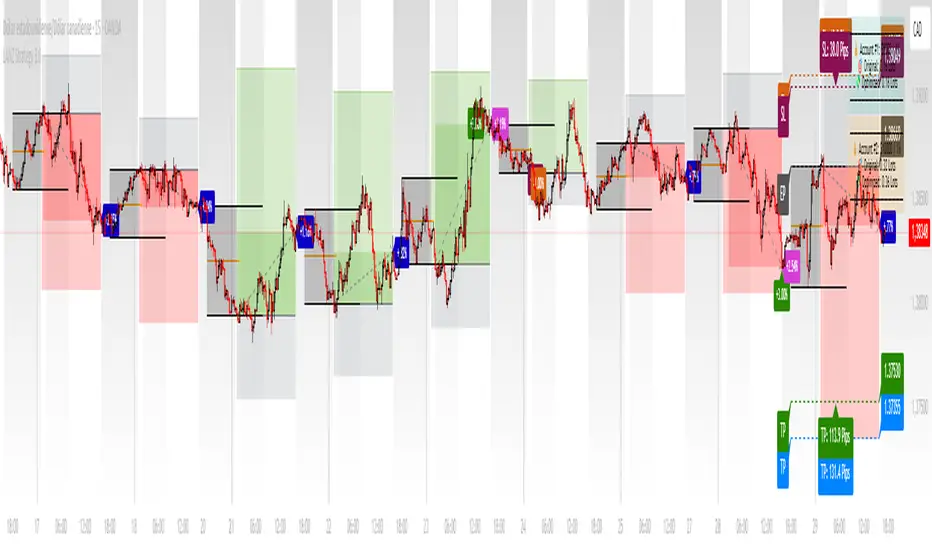
LANZ Strategy 6.0 [Backtest]🔷 LANZ Strategy 6.0 — Precision Backtesting Based on 09:00 NY Candle, Dynamic SL/TP, and Lot Size per Trade
LANZ Strategy 6.0 is the simulation version of the original LANZ 6.0 indicator. It executes a single LIMIT BUY order per day based on the 09:00 a.m. New York candle, using dynamic Stop Loss and Take Profit levels derived from the candle range. Position sizing is calculated automatically using capital, risk percentage, and pip value — allowing accurate trade simulation and performance tracking.
📌 This is a strategy script — It simulates real trades using strategy.entry() and strategy.exit() with full money management for risk-based backtesting.
🧠 Core Logic & Trade Conditions
🔹 BUY Signal Trigger:
At 09:00 a.m. NY (New York time), if:
The current candle is bullish (close > open)
→ A BUY order is placed at the candle’s close price (EP)
Only one signal is evaluated per day.
⚙️ Stop Loss / Take Profit Logic
SL can be:
Wick low (0%)
Or dynamically calculated using a % of the full candle range
TP is calculated using the user-defined Risk/Reward ratio (e.g., 1:4)
The TP and SL levels are passed to strategy.exit() for each trade simulation.
💰 Risk Management & Lot Size Calculation
Before placing the trade:
The system calculates pip distance from EP to SL
Computes the lot size based on:
Account capital
Risk % per trade
Pip value (auto or manual)
This ensures every trade uses consistent, scalable risk regardless of instrument.
🕒 Manual Close at 3:00 p.m. NY
If the trade is still open by 15:00 NY time, it will be closed using strategy.close().
The final result is the actual % gain/loss based on how far price moved relative to SL.
📊 Backtest Accuracy
One trade per day
LIMIT order at the candle close
SL and TP pre-defined at execution
No repainting
Session-restricted (only runs on 1H timeframe)
✅ Ideal For:
Traders who want to backtest a clean and simple daily entry system
Strategy developers seeking reproducible, high-conviction trades
Users who prefer non-repainting, session-based simulations
👨💻 Credits:
💡 Developed by: LANZ
🧠 Logic & Money Management Engine: LANZ
📈 Designed for: 1H charts
🧪 Purpose: Accurate simulation of LANZ 6.0's NY Candle Entry system

LANZ Strategy 5.0 [Backtest]🔷 LANZ Strategy 5.0 — Rule-Based BUY Logic with Time Filter, Session Limits and Auto SL/TP Execution
This is the backtest version of LANZ Strategy 5.0, built as a strategy script to evaluate real performance under fixed intraday conditions. It automatically places BUY and SELL trades based on structured candle confirmation, EMA trend alignment, and session-based filters. The system simulates real-time execution with precise Stop Loss and Take Profit levels.
📌 Built for traders seeking to simulate clean intraday logic with fully automated entries and performance metrics.
🧠 Core Logic & Strategy Conditions
✅ BUY Signal Conditions:
Price is above the EMA200
The last 3 candles are bullish (close > open)
The signal occurs within the defined session window (NY time)
Daily trade limit has not been exceeded
If all are true, a BUY order is executed at market, with SL and TP set immediately.
🔻 SELL Signal Conditions (Optional):
Exactly inverse to BUY (below EMA + 3 bearish candles). Disabled by default.
🕐 Operational Time Filter (New York Time)
You can fully customize your intraday window:
Start Time: e.g., 01:15 NY
End Time: e.g., 16:00 NY
The system evaluates signals only within this range, even across midnight if configured.
🔁 Trade Management System
One trade at a time per signal
Trades include a Stop Loss (SL) and Take Profit (TP) based on pip distance
Trade result is calculated automatically
Each signal is shown with a triangle marker (BUY only, by default)
🧪 Backtest Accuracy
This version uses:
strategy.order() for entries
strategy.exit() for SL and TP
strategy.close_all() at the configured manual closing time
This ensures realistic behavior in the TradingView strategy tester.
⚙️ Flow Summary (Step-by-Step)
On every bar, check:
Is the time within the operational session?
Is the price above the EMA?
Are the last 3 candles bullish?
If conditions met → A BUY trade is opened:
SL = entry – X pips
TP = entry + Y pips
Trade closes:
If SL or TP is hit
Or at the configured manual close time (e.g., 16:00 NY)
📊 Settings Overview
Timeframe: 1-hour (ideal)
SL/TP: Configurable in pips
Max trades/day: User-defined (default = 99 = unlimited)
Manual close: Adjustable by time
Entry type: Market (not limit)
Visuals: Plotshape triangle for BUY entry
👨💻 Credits:
💡 Developed by: LANZ
🧠 Strategy logic & execution: LANZ
✅ Designed for: Clean backtesting, clarity in execution, and intraday logic simulation

LANZ Strategy 5.0🔷 LANZ Strategy 5.0 — Intraday BUY Signals, Dynamic Lot Size per Account, Real-Time Dashboard and Smart Execution
LANZ Strategy 5.0 is a powerful intraday tool designed for traders who need a visual-first, data-backed BUY system, enhanced with risk-aware lot size calculation and a real-time performance dashboard. This indicator intelligently detects strong momentum setups and provides visual and statistical clarity throughout the session.
📌 This is an indicator, not a strategy — It does not place trades automatically but provides precise conditions, alerts, and visual guides to support execution.
🧠 Core Logic & Features
BUY Entry Conditions (Signal Engine)
A BUY signal is triggered when:
The current price is above the EMA200 (trend filter)
The last 3 candles are bullish (candle body close > open)
You are within the defined session window (NY time)
When all conditions are met and you haven’t reached the daily trade limit, a signal appears on the chart and an optional alert is triggered.
Operational Hours Filter (NY Time)
You define:
Start time (e.g., 01:15 NY)
End time (e.g., 16:00 NY)
The system only evaluates and executes signals within this period. If a BUY setup occurs outside the window, it’s ignored. The chart is also highlighted with a transparent teal background to visually show active trading hours.
Lot Size Panel with Per-Account Risk Management
Designed for traders managing multiple accounts or capital sources. You can enable up to 5 accounts, each with:
Its own capital
Its own risk percentage per trade
The system uses the defined SL in pips, plus the instrument’s pip value, to calculate the lot size per account. All values are shown in a dedicated panel at the bottom-right, automatically updating with each new trade.
The emojis (🐣🦊🦁🐲🐳) distinguish each account visually.
Trade Visualization with Customizable Lines
When a signal is triggered:
An Entry Point (EP) line is drawn at the candle’s close.
A Stop Loss (SL) line is placed X pips below the entry.
A Take Profit (TP) line is placed Y pips above the entry.
All three lines are fully customizable in style, color, and thickness. You define how many bars the lines should extend.
Outcome Tracking & Real-Time Dashboard
Each trade outcome is measured:
SL hit = –1.00%
TP hit = +3.00%
Manual close = calculated dynamically based on price at close time
Each result is labeled on the chart near its level, and stored.
The top-right dashboard updates in real time:
✅ Number of trades
📈 Cumulative % gain/loss of the day (color-coded)
Alerts You Can Trust:
You’ll get a Buy Alert when a valid signal is formed
You’ll get a Trade Executed Alert when the visual operation is plotted
You’ll get a SL/TP Hit Alert with price and result
You’ll get a Manual Close Alert if the configured time is reached and the trade is still active
⚙️ Step-by-Step Execution Flow
At every bar, the system checks:
Are we within the session time window?
Is price above EMA?
Are the last 3 candles bullish?
✅ If yes:
A BUY signal is plotted
Entry/SL/TP lines are drawn
Lot sizes are calculated and displayed
Trade is added to the daily count
🕐 At the configured Manual Close time (e.g., 16:00 NY):
If the trade is still open, it's closed
A label is added with the exact result in %
💡 Ideal For:
Intraday traders who operate within fixed time sessions
Traders managing multiple accounts or capital pools
Anyone who wants full visual clarity of every decision point
Traders who appreciate dynamic lot size calculation and clean execution tracking
👨💻 Credits:
💡 Developed by: LANZ
🧠 Strategy concept & execution model: LANZ
🧪 Tested on: 1H charts with visual-only execution
📈 Designed for: Clarity, adaptability, and full intraday control
3D Surface Modeling [PhenLabs]📊 3D Surface Modeling
Version: PineScript™ v6
📌 Description
The 3D Surface Modeling indicator revolutionizes technical analysis by generating three-dimensional visualizations of multiple technical indicators across various timeframes. This advanced analytical tool processes and renders complex indicator data through a sophisticated matrix-based calculation system, creating an intuitive 3D surface representation of market dynamics.
The indicator employs array-based computations to simultaneously analyze multiple instances of selected technical indicators, mapping their behavior patterns across different temporal dimensions. This unique approach enables traders to identify complex market patterns and relationships that may be invisible in traditional 2D charts.
🚀 Points of Innovation
Matrix-Based Computation Engine: Processes up to 500 concurrent indicator calculations in real-time
Dynamic 3D Rendering System: Creates depth perception through sophisticated line arrays and color gradients
Multi-Indicator Integration: Seamlessly combines VWAP, Hurst, RSI, Stochastic, CCI, MFI, and Fractal Dimension analyses
Adaptive Scaling Algorithm: Automatically adjusts visualization parameters based on indicator type and market conditions
🔧 Core Components
Indicator Processing Module: Handles real-time calculation of multiple technical indicators using array-based mathematics
3D Visualization Engine: Converts indicator data into three-dimensional surfaces using line arrays and color mapping
Dynamic Scaling System: Implements custom normalization algorithms for different indicator types
Color Gradient Generator: Creates depth perception through programmatic color transitions
🔥 Key Features
Multi-Indicator Support: Comprehensive analysis across seven different technical indicators
Customizable Visualization: User-defined color schemes and line width parameters
Real-time Processing: Continuous calculation and rendering of 3D surfaces
Cross-Timeframe Analysis: Simultaneous visualization of indicator behavior across multiple periods
🎨 Visualization
Surface Plot: Three-dimensional representation using up to 500 lines with dynamic color gradients
Depth Indicators: Color intensity variations showing indicator value magnitude
Pattern Recognition: Visual identification of market structures across multiple timeframes
📖 Usage Guidelines
Indicator Selection
Type: VWAP, Hurst, RSI, Stochastic, CCI, MFI, Fractal Dimension
Default: VWAP
Starting Length: Minimum 5 periods
Default: 10
Step Size: Interval between calculations
Range: 1-10
Visualization Parameters
Color Scheme: Green, Red, Blue options
Line Width: 1-5 pixels
Surface Resolution: Up to 500 lines
✅ Best Use Cases
Multi-timeframe market analysis
Pattern recognition across different technical indicators
Trend strength assessment through 3D visualization
Market behavior study across multiple periods
⚠️ Limitations
High computational resource requirements
Maximum 500 line restriction
Requires substantial historical data
Complex visualization learning curve
🔬 How It Works
1. Data Processing:
Calculates selected indicator values across multiple timeframes
Stores results in multi-dimensional arrays
Applies custom scaling algorithms
2. Visualization Generation:
Creates line arrays for 3D surface representation
Applies color gradients based on value magnitude
Renders real-time updates to surface plot
3. Display Integration:
Synchronizes with chart timeframe
Updates surface plot dynamically
Maintains visual consistency across updates
🌟 Credits:
Inspired by LonesomeTheBlue (modified for multiple indicator types with scaling fixes and additional unique mappings)
💡 Note:
Optimal performance requires sufficient computing resources and historical data. Users should start with default settings and gradually adjust parameters based on their analysis requirements and system capabilities.

Initial Balance Wave MapThis indicator visualizes the Initial Balance (IB) range for any session, marking the first hour's high and low. It includes optional midpoints, extensions (e.g. 1.5x IB, 2x IB), and customizable time windows. Additional features allow users to display session open, high, low, close, and VWAP reference points. Designed to support price action and session structure analysis, it adapts to various global futures and FX market opens. All display elements are optional and fully configurable.
This updated indicator builds upon the open-source foundation by @noop-noop with enhancements and user-facing labels tailored for Auction Market Theory, scalping, and structure-based trade setups.
Key updated Featured: Multiple previous day's IB levels carry forward into the current day's chart, as opposed to just the previous day's levels carrying forward to the new IB time.
🙌 Credits:
This script builds upon the excellent open-source work by @noop-noop. Original script available here .

5 EMA STRATEGY by Power of Stocks(StockYogi)5 EMA STRATEGY by Power of Stocks(StockYogi)
This is a 5 EMA Breakout Strategy inspired by the trading principles taught by Shubhashi Pani, founder of the Power of Stocks (POS) community.
The strategy is designed to:
• Detect breakout setups when price breaks the high/low of a signal candle (based on EMA conditions)
• Enter trades only if the breakout occurs within the next 3 candles
• Allow multiple trades in the same direction without closing the earlier one
• Use independent stop-loss (SL) and take-profit (TP) targets for each trade based on a user-defined risk-reward ratio
• Optionally enter trades only at candle close
• Optionally avoid trades during a custom time window (e.g., 3:00 PM to 3:30 PM IST)
• Optionally close all open positions at a defined time (e.g., 3:30 PM IST)
The goal of this strategy is to provide greater flexibility and realism for intraday or short-term traders following structured breakout systems.
Disclaimer: This script is an implementation of technical ideas for educational purposes only. It is not financial advice. All trading involves risk, and past performance does not guarantee future results.
Strategy Credits:
This strategy is based on publicly known breakout rules taught by Shubhashi Pani (Power of Stocks). This is not an official POS script, and I am not affiliated with the Power of Stocks team. This implementation was developed independently to follow the logic shared for educational use.
Feel free to use, backtest, and modify according to your needs. Constructive feedback is welcome!

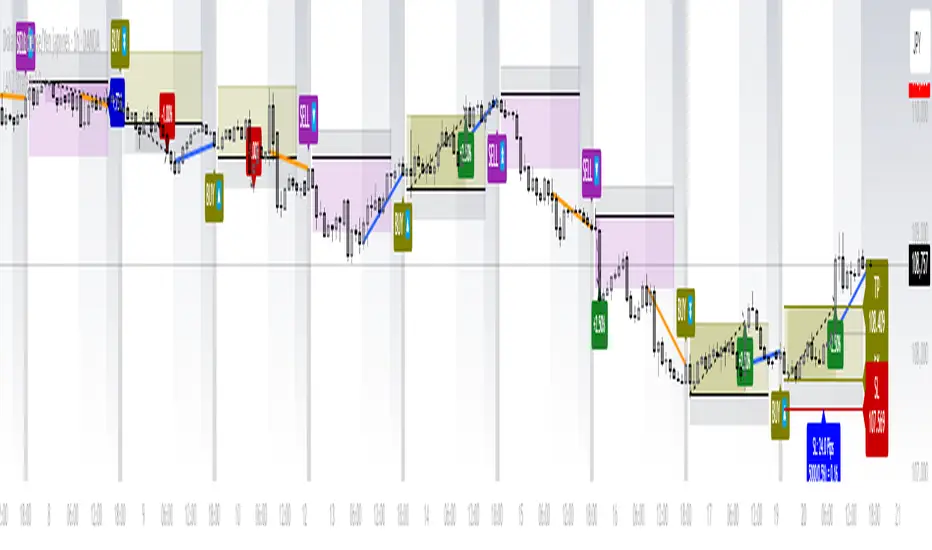
LANZ Strategy 1.0 [Backtest]🔷 LANZ Strategy 1.0 — Time-Based Session Trading with Smart Reversal Logic and Risk-Controlled Limit Orders
This backtest version of LANZ Strategy 1.0 brings precision to session-based trading by using directional confirmation, pre-defined risk parameters, and limit orders that execute overnight. Designed for the 1-hour timeframe, it allows traders to evaluate the system with configurable SL, TP, and risk settings in a fully automated environment.
🧠 Core Strategy Logic:
1. Directional Confirmation at 18:00 NY:
At 18:00 NY, the system compares the 08:00 open vs the 18:00 close:
If the direction matches the previous day, the signal is reversed.
If the direction differs, the current day's trend is kept.
This logic is designed to avoid momentum exhaustion and capture corrective reversals.
2. Entry Level Definition:
Based on the confirmed direction:
For BUY, the Low of the day is used as Entry Point (EP).
For SELL, the High of the day becomes EP.
The system plots a Stop Loss and Take Profit based on user-defined pip inputs (default: SL = 18 pips, TP = 54 pips → RR 1:3).
3. Time-Limited Entry Execution (LIMIT Orders):
Orders are sent after 18:00 NY and can be triggered anytime between 18:00 and 08:00 NY.
If EP is not touched before 08:00, the order is automatically cancelled.
4. Manual Close Feature:
If the trade is still open at the configured hour (default 09:00 NY), the system closes all positions, simulating realistic intraday exit scenarios.
5. Lot Size Calculation Based on Risk:
Lot size is dynamically calculated using the account size, risk percentage, and SL distance.
This ensures consistent risk exposure regardless of market volatility.
⚙️ Step-by-Step Flow:
08:00 NY → Captures the open of the day.
18:00 NY → Confirms direction and defines EP, SL, and TP.
After 18:00 NY → If conditions are met, a LIMIT order is placed at EP.
Between 18:00–08:00 NY → If price touches EP, the trade is executed.
At 08:00 NY → If EP wasn’t touched, the order is cancelled.
At Configured Manual Close Time (default 09:00 NY) → All open positions are force-closed if still active.
🧪 Backtest Settings:
Timeframe: 1-hour only
Order Type: strategy.entry() with limit=
SL/TP Configurable: Yes, in pips
Risk Input: % of capital per trade
Manual Close Time: Fully adjustable (default 09:00 NY)
👨💻 Credits:
Developed by LANZ
Strategy logic and trading concept built with clarity and precision.
Code structure and documentation by Kairos, your AI trading assistant.
Designed for high-confidence execution and clean backtesting performance.

LANZ Strategy 1.0🔷 LANZ Strategy 1.0 — Session-Based Directional Logic with Visual Multi-Account Risk Management
LANZ Strategy 1.0 is a structured and disciplined trading strategy designed for the 1-hour timeframe, operating during the NY session and executing trades overnight. It uses the directional behavior between 08:00 and 18:00 New York time to define precise limit entries for the following night. Ideal for traders who prefer time-based execution, clear visuals, and professional risk management across multiple accounts.
🧠 Core Components:
1. Session Direction Confirmation:
At 18:00 NY, the system evaluates the market direction by comparing the open at 08:00 vs the close at 18:00:
If the direction matches the previous day, it is reversed.
If it differs, the current day’s direction is kept.
This logic is designed to avoid trend exhaustion and favor potential reversal opportunities.
2. EP Level & Risk Definition:
Once direction is defined:
For BUY, EP is set at the Low of the session.
For SELL, EP is set at the High of the session.
The system automatically plots:
SL fixed at 18 pips from EP
TP at 3.00× the risk → 54 pips from EP
All levels (EP, SL, TP) are shown with visual lines and price labels.
3. Time-Restricted Entry Execution:
The entry is only valid if price touches the EP between 19:00 and 08:00 NY.
If EP is not touched before 08:00 NY, the trade is automatically cancelled.
4. Multi-Account Lot Sizing:
Traders can configure up to five different accounts, each with its own capital and risk percentage.
The system calculates and displays the lot size per account, based on SL distance and pip value, in a dynamic floating label.
5. Outcome Tracking:
If TP is hit, a +3.00% profit label is displayed along with a congratulatory alert.
If SL is hit, a -1.00% label appears with a loss alert.
If the trade is still open by 09:00 NY, it is manually closed, and the result is shown as a percentage of the initial risk.
📊 Visual Features:
Custom-colored angle and guide lines.
Dynamic angle line starts at 08:00 NY and tracks price until 18:00.
Shaded backgrounds for key time zones (e.g., 08:00, 18:00, 19:00).
BUY/SELL signals shown at 19:00 based on match/divergence logic.
Label panel showing risk metrics and lot size for each active account.
⚙️ How It Works:
08:00 NY: Marks the session open and initiates a dynamic angle line.
18:00 NY: Evaluates the session direction and calculates EP/SL/TP based on outcome.
19:00 NY: Activates limit order monitoring.
During the night (until 08:00 NY): If EP is touched, the trade is triggered.
At 08:00 NY: If no touch occurred, trade is cancelled.
Overnight: TP/SL logic is enforced, showing percentage outcomes.
At 09:00 NY: If still open, trade is closed manually and result is labeled visually.
🔔 Alerts:
🚀 EP execution alert when touched
💢 Stop Loss hit alert
⚡ Take Profit hit alert
✅ Manual close at 09:00 NY with performance result
🔔 Daily reminder at 19:00 NY to configure and prepare the trade
📝 Notes:
Strategy is exclusive to the 1-hour timeframe.
Works best on assets with clean NY session movement.
Perfect for structured, semi-automated swing/overnight trading styles.
Fully visual, self-explanatory, and backtest-friendly.
👨💻 Credits:
Developed by LANZ
A strategy created with precision, discipline, and a vision for traders who value time-based entries, clean execution logic, and visual confidence on the chart.
Special thanks to Kairos — your AI assistant — for the detailed structure, scripting, and documentation of the strategy.
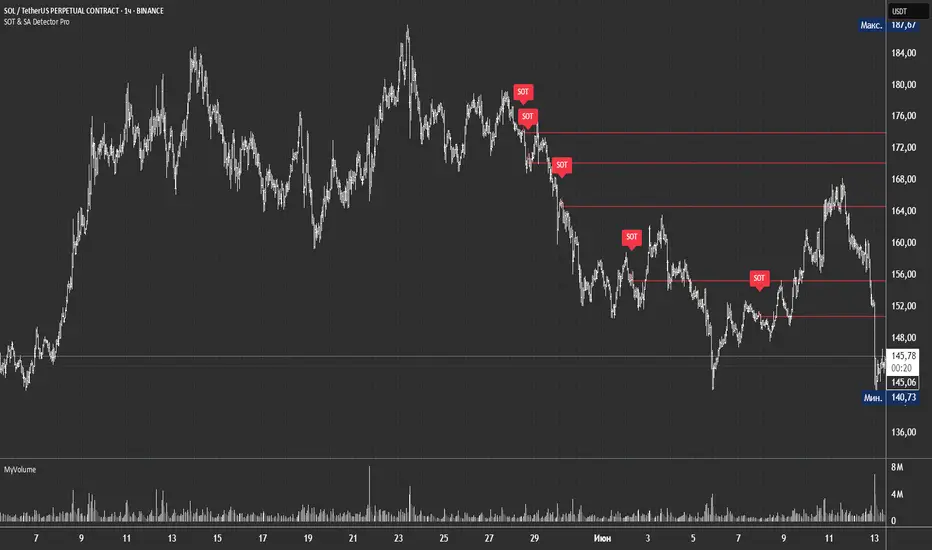
SOT & SA Detector ProSOT & SA Detector Pro- Advanced Reversal Pattern Recognition
OVERVIEW
The SOT & SA Detector is an educational indicator designed to identify potential market reversal points through systematic analysis of candlestick patterns, volume confirmation, and price wave structures. SOT (Shorting of Thrust) signals suggest potential bearish reversals after upward price movements, while SA (Selling Accumulation) signals indicate possible bullish reversals following downward trends. This tool helps traders recognize key market transition points by combining multiple technical criteria for enhanced signal reliability.
═══════════════════════════════════════════════════════════════
HOW IT WORKS
Technical Methodology
The indicator employs a multi-factor analysis approach that evaluates:
Wave Structure Analysis: Identifies minimum 2-bar directional waves (upward for SOT, downward for SA)
Price Delta Validation: Ensures closing price changes remain within specified percentage thresholds (default 0.3%) best 0.1.
Candlestick Tail Analysis: Measures rejection wicks using configurable tail multipliers
Volume Confirmation: Requires increased volume compared to previous periods
Pattern Confirmation: Validates signals through subsequent price action
Signal Generation Process
Pattern Recognition: Scans for qualifying candlestick formations with appropriate tail characteristics
Volume Verification: Confirms patterns with volume expansion using adjustable multiplier
Price Confirmation: Validates signals when price breaks and closes beyond pattern extremes
Signal Display: Places labeled markers and draws horizontal reference levels
Mathematical Foundation
Delta calculation: math.abs(close - close ) / close <= deltaPercent / 100
Tail analysis: (high - close ) >= tailMultiplier * (close - low ) for SOT
Volume filter: volume >= volume * volumeFactor
═══════════════════════════════════════════════════════════════
KEY FEATURES
Dual Pattern Recognition: Identifies both bullish (SA) and bearish (SOT) reversal candidates
Volume Integration: Incorporates volume analysis for enhanced signal validation
Customizable Parameters: Adjustable wave length, delta percentage, tail multiplier, and volume factor
Visual Clarity: Color-coded bar highlighting, labeled signals, and horizontal reference levels
Time-Based Filtering: Configurable analysis period to focus on recent market activity
Non-Repainting Signals: Confirmed signals remain stable and do not change with new price data
Alert System: Built-in notifications for both initial signals and subsequent confirmations
═══════════════════════════════════════════════════════════════
HOW TO USE
Signal Interpretation
Red SOT Labels: Appear above potential bearish reversal candles with downward-pointing markers
Green SA Labels: Display below potential bullish reversal candles with upward-pointing markers
Horizontal Lines: Extend from signal levels to provide ongoing reference points
Bar Coloring: Highlights qualifying pattern candles for visual emphasis
Trading Application
This indicator serves as an educational tool for pattern recognition and should be used in conjunction with additional analysis methods. Consider SOT signals as potential areas of selling pressure following upward moves, while SA signals may indicate buying interest after downward price action.
Best Practices
Combine with trend analysis and support/resistance levels
Consider overall market context and timeframe alignment
Use proper risk management techniques
Validate signals with additional technical indicators
═══════════════════════════════════════════════════════════════
SETTINGS
Analysis Days (Default: 20)
Controls the lookback period for signal detection. Higher values extend historical analysis while lower values focus on recent activity.
Minimum Bars in Wave (Default: 2)
Sets the minimum consecutive bars required to establish directional wave patterns. Increase for stronger trend confirmation.
Max Close Change % (Default: 0.3) best 0.1.
Defines acceptable closing price variation between consecutive bars. Lower values require tighter price consolidation.
Tail Multiplier (Default: 1.0) best 1.5 or more.
Adjusts sensitivity for candlestick tail analysis. Higher values require more pronounced rejection wicks.
Volume Factor (Default: 1.0)
Sets volume expansion threshold compared to previous period. Values above 1.0 require volume increases.
═══════════════════════════════════════════════════════════════
LIMITATIONS
Market Conditions
May produce false signals in highly volatile or low-volume conditions
Effectiveness varies across different market environments and timeframes
Requires sufficient volume data for optimal performance
Signal Timing
Signals appear after pattern completion, not in real-time during formation
Confirmation signals depend on subsequent price action
Historical signals do not guarantee future market behavior
Technical Constraints
Limited to analyzing price and volume data only
Does not incorporate fundamental analysis or external market factors
Performance may vary significantly across different trading instruments
═══════════════════════════════════════════════════════════════
IMPORTANT DISCLAIMERS
This indicator is designed for educational purposes and technical analysis learning. It does not constitute financial advice, investment recommendations, or trading signals. Past performance does not guarantee future results. Trading involves substantial risk of loss, and this tool should be used alongside proper risk management techniques and additional analysis methods.
Always conduct thorough analysis using multiple indicators and consider market context before making trading decisions. The SOT & SA patterns represent potential reversal points but do not guarantee price direction changes.
═══════════════════════════════════════════════════════════════
Credits: Original concept and Pine Script implementation by Everyday_Trader_X
Version: Pine Script v6 compatible
Category: Technical Analysis / Reversal Detection
Overlay: Yes (displays on price chart)
QG-Particle OscillatorThis is an advanced oscillator based on auxiliary particle filter. It separates signal from noise and uses smoothing algorithm similar to JMA.
The main oscillator line is a smoothed and detrended version of the price series similar to detrended oscillator line. The purple/aqua lines are a prediction based on an additional adaptive smoothing technique and current volatility.
The prediction is smoothed twice and is supposed to represent the true signal without any noise, thus the prediction should always be less than the raw detrend line. However, certain volatile conditions will cause the prediction to cross above/below the detrend line. When this happens the likelihood of a reversal or pullback is extremely high.
There are 3 dots on the zero line- Red, Green and Yellow. The yellow dots warn of an eminent pullback 2 bars before it actually occurs. This is a non-repainting indicator.
One can also use this indicator to trade CCI signals, similar to zero line rejection in existing trend.
The indicator has 2 settings- Period and Phase. The phase represents cycle phase and Period represents oscillator period.
Credits: This indicator has been originally published for Ninjatrader and this is conversion into pinescript.

LANZ Strategy 4.0 [Backtest]🔷 LANZ Strategy 4.0 — Strategy Execution Based on Confirmed Structure + Risk-Based SL/TP
LANZ Strategy 4.0 is the official backtesting engine for the LANZ Strategy 4.0 trading logic. It simulates real-time executions based on breakout of Strong/Weak Highs or Lows, using a consistent structural system with SL/TP dynamically calculated per trade. With integrated risk management and lot size logic, this script allows traders to validate LANZ Strategy 4.0 performance with real strategy metrics.
🧠 Core Components:
Confirmed Breakout Entries: Trades are executed only when price breaks the most recent structural level (Strong High or Strong Low), detected using swing pivots.
Dynamic SL and TP Logic: SL is placed below/above the breakout point with a customizable buffer. TP is defined using a fixed Risk-Reward (RR) ratio.
Capital-Based Risk Management: Lot size is calculated based on account equity, SL distance, and pip value (e.g. $10 per pip on XAUUSD).
Clean and Controlled Executions: Only one trade is active at a time. No new entries are allowed until the current position is closed.
📊 Visual Features:
Automatic plotting of Entry, SL, and TP levels.
Full control of swing sensitivity (swingLength) and SL buffer.
SL and TP lines extend visually for clarity of trade risk and reward zones.
⚙️ How It Works:
Detects pivots and classifies trend direction.
Waits for breakout above Strong High (BUY) or below Strong Low (SELL).
Calculates dynamic SL and TP based on buffer and RR.
Computes trade size automatically based on risk per trade %.
Executes entry and manages exits via strategy engine.
📝 Notes:
Ideal for evaluating the LANZ Strategy 4.0 logic over historical data.
Must be paired with the original indicator (LANZ Strategy 4.0) for live trading.
Best used on assets with clear structural behavior (gold, indices, FX).
📌 Credits:
Backtest engine developed by LANZ based on the official rules of LANZ Strategy 4.0. This script ensures visual and logical consistency between live charting and backtesting simulations.

LANZ Strategy 3.0 [Backtest]🔷 LANZ Strategy 3.0 — Asian Range Fibonacci Scalping Strategy
LANZ Strategy 3.0 is a precision-engineered backtesting tool tailored for intraday traders who rely on the Asian session range to determine directional bias. This strategy implements dynamic Fibonacci projections and strict time-window validation to simulate a clean and disciplined trading environment.
🧠 Core Components:
Asian Range Bias Definition: Direction is established between 01:15–02:15 a.m. NY time based on the candle’s close in relation to the midpoint of the Asian session range (18:00–01:15 NY).
Limit Order Execution: Only one trade is placed daily, using a limit order at the Asian range high (for sells) or low (for buys), between 01:15–08:00 a.m. NY.
Fibonacci-Based TP/SL:
Original Mode: TP = 2.25x range, SL = 0.75x range.
Optimized Mode: TP = 1.95x range, SL = 0.65x range.
No Trade After 08:00 NY: If the limit order is not executed before 08:00 a.m. NY, it is canceled.
Fallback Logic at 02:15 NY: If the market direction misaligns with the setup at 02:15 a.m., the system re-evaluates and can re-issue the order.
End-of-Day Closure: All positions are closed at 15:45 NY if still open.
📊 Backtest-Ready Design:
Entries and exits are executed using strategy.entry() and strategy.exit() functions.
Position size is fixed via capital risk allocation ($100 per trade by default).
Only one position can be active at a time, ensuring controlled risk.
📝 Notes:
This strategy is ideal for assets sensitive to the Asian/London session overlap, such as Forex pairs and indices.
Easily switch between Fibonacci versions using a single dropdown input.
Fully deterministic: all entries are based on pre-defined conditions and time constraints.
👤 Credits:
Strategy developed by rau_u_lanz using Pine Script v6. Built for traders who favor clean sessions, directional clarity, and consistent execution using time-based logic and Fibonacci projections.

LANZ Strategy 2.0 [Backtest]🔷 LANZ Strategy 2.0 — Structural Breakout Logic with Dynamic Swing Protection
LANZ Strategy 2.0 is a precision-focused backtesting system built for intraday traders who rely on structural confirmations before the London session to guide directional bias. This tool uses smart swing detection, risk-defined position sizing, and strict time-based execution to simulate real trading conditions with clarity and control.
🧠 Core Components:
Structural Confirmation (Trend & BoS): Detects trend direction and break of structure (BoS) using a three-swing logic, aligning trade entries with valid structural movement.
Time-Based Execution: Trades are triggered exclusively at 02:00 a.m. New York time, ensuring disciplined and repeatable intraday testing.
Swing-Based SL Models: Traders can select between three stop-loss protection types:
First Swing: Most recent structural level
Second Swing: Prior level
Full Coverage: All recent swing levels + configurable pip buffer
Dynamic TP Calculation: Take-Profit is projected as a risk-based multiple (RR), fully adjustable via input.
Capital-Based Risk Management: Risk is defined as a percentage of a fixed account size (e.g., $100 per trade from $10,000), and lot size is automatically calculated based on SL distance.
Fallback Entry Logic: If structural breakout is present but trend is not confirmed, a secondary entry is triggered.
End-of-Session Management: Any open trades are automatically closed at 11:45 a.m. NY time, with optional manual labeling or review.
📊 Visual Features (Optional in Indicator Version):
(Note: Visuals apply to the indicator version of LANZ 2.0, not this backtest script)
Swing level labels (1st, 2nd) and dynamic SL/TP lines.
Real-time session coloring for clarity: Pre-London, Entry Window, and NY Close.
Outcome labels: +RR, -RR, or net % at close.
Auto-cleanup of previous drawings for a clean chart per session.
⚙️ How It Works:
Detects last trend and BoS using swing logic before 02:00 a.m. NY.
At 02:00 a.m., evaluates directional bias and executes BUY or SELL if confirmed.
Applies selected SL logic (1st, 2nd, or full swing protection).
Sets TP based on the RR multiplier.
Closes the trade either on SL, TP, or at 11:45 a.m. NY manually.
🔔 Alerts:
Time-of-day alert at 02:00 a.m. NY to monitor execution.
Can be extended to cover SL/TP triggers or new BoS events.
📝 Notes:
Designed for backtesting precision and discretionary decision-making.
Ideal for Forex pairs, indices, or assets active during the London session.
Fully customizable: session timing, swing logic, SL buffer, and RR.
👤 Credits:
Strategy built by @rau_u_lanz using Pine Script v6, combining structural logic, capital-based risk control, and London-session timing in a backtest-ready framework for traders who demand accuracy and structure.

Recent Session High Low Marker - SimpleDescription:
This Pine Script marks the high and low points of the most recent trading sessions: Asian, London, and New York.
Asian Session: From 19:00 to 21:00 New York time (UTC-4).
London Session: From 02:00 to 05:00 New York time (UTC-4).
New York Session: From 07:00 to 10:00 New York time (UTC-4).
For each session, the script draws two lines:
One for the high of the session.
One for the low of the session.
The lines are drawn horizontally across the chart, making them easy to spot. Each session is marked by two lines with specific colors:
Orange for the Asian session.
Blue for the London session.
Purple for the New York session.
The lines are dynamically updated during the active session, and they will reset when the next session begins. The width of the lines is set to 2 to ensure they are visible without being too thick.
Credits:
Script created by Jdv.

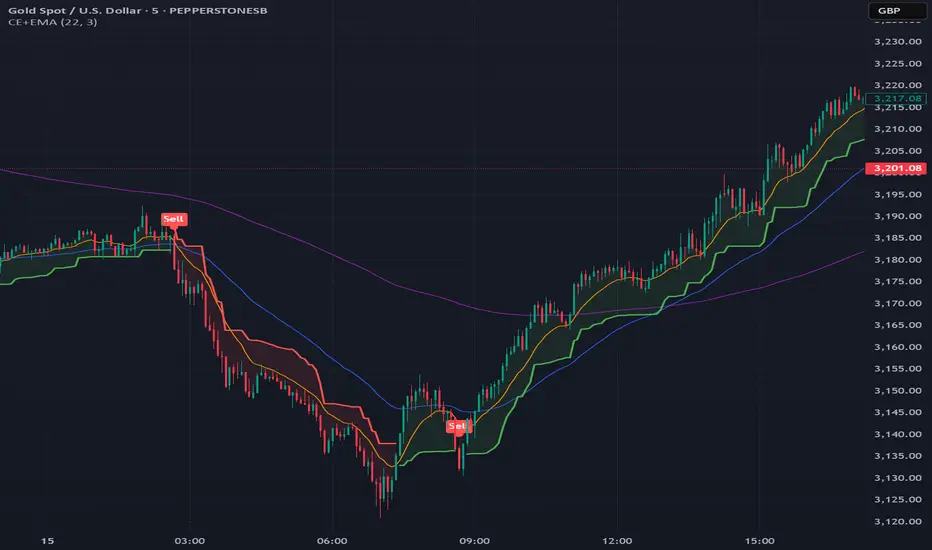
Chandelier Exit + EMA Filtered SignalsThis script is a powerful upgrade to the original Chandelier Exit by Alex Orekhov (everget), combining trend-following logic with higher-quality trade filtering.
✅ Key Features:
Chandelier Exit logic with ATR-based stop levels
Buy/Sell signals only when trend is confirmed:
Buy: Price must be above EMA 13, 50, and 200
Sell: Price must be below EMA 13, 50, and 200
Candle highlighting: Green for Buy, Red for Sell
Signal labels for visual clarity
Toggle to show/hide EMAs
Built-in alerts for:
Buy signal
Sell signal
Trend direction change
🛠️ Inputs:
ATR Period and Multiplier
Toggle: Use Close Price for High/Low Calculation
Toggle: Show/Hide Labels and State Highlight
Toggle: Show/Hide EMA 13, 50, 200
Toggle: Await confirmed bar for alerts
🔔 Alerts Included:
Chandelier Exit Buy
Chandelier Exit Sell
Direction Change (long to short or vice versa)
💡 How to Use:
Use on trending assets (e.g., Gold, Indices, Crypto).
Combine with support/resistance or session filters for optimal results.
Enable alerts to be notified on trade setups.
📢 Credits:
Based on the original Chandelier Exit script by everget.
Enhancements by AP Capital for filtered signals and better visual feedback.
Kernel Regression Bands SuiteMulti-Kernel Regression Bands
A versatile indicator that applies kernel regression smoothing to price data, then dynamically calculates upper and lower bands using a wide variety of deviation methods. This tool is designed to help traders identify trend direction, volatility, and potential reversal zones with customizable visual styles.
Key Features
Multiple Kernel Types: Choose from 17+ kernel regression styles (Gaussian, Laplace, Epanechnikov, etc.) for smoothing.
Flexible Band Calculation: Select from 12+ deviation types including Standard Deviation, Mean/Median Absolute Deviation, Exponential, True Range, Hull, Parabolic SAR, Quantile, and more.
Adaptive Bands: Bands are calculated around the kernel regression line, with a user-defined multiplier.
Signal Logic: Trend state is determined by crossovers/crossunders of price and bands, coloring the regression line and band fills accordingly.
Custom Color Modes: Six unique color palettes for visual clarity and personal preference.
Highly Customizable Inputs: Adjust kernel type, lookback, deviation method, band source, and more.
How to Use
Trend Identification: The regression line changes color based on the detected trend (up/down)
Volatility Zones: Bands expand/contract with volatility, helping spot breakouts or mean-reversion opportunities.
Visual Styling: Use color modes to match your chart theme or highlight specific market states.
Credits:
Kernel regression logic adapted from:
ChartPrime | Multi-Kernel-Regression-ChartPrime (Link in the script)
Disclaimer
This script is for educational and informational purposes only. Not financial advice. Use at your own risk.

AP IFTCCIv2/IFTStoch/IFTRSI Multi-TimeframeMulti-Timeframe IFT-CCI/Stoch/RSI Composite
This enhanced indicator combines three powerful oscillators—Inverse Fisher Transform (IFT) versions of the Commodity Channel Index (CCI), Stochastic, and Relative Strength Index (RSI)—into a unified multi-timeframe analysis tool. Originally developed by John Ehlers (pioneer of cyclical analysis and signal processing in trading systems) and adapted by KIVANC (@fr3762), this version adds dual-timeframe capability to compare indicator values across different chart resolutions.
Key Features:
Triple Oscillator Composite
IFT-CCI: Smoothed CCI values transformed via Ehlers' Inverse Fisher Transform (blue-gold)
IFT-Stochastic: Classic stochastic oscillator processed through IFT (blue)
IFT-RSI: RSI oscillator converted to IFT format (magenta)
Composite Average Line: Combined average of all three indicators (green)
Multi-Timeframe Analysis
Compare primary and secondary timeframes (e.g., 1H vs. 4H, daily vs. weekly)
Primary timeframe plots use solid lines with 80% opacity
Secondary timeframe (optional) uses dashed/circle markers with 40% opacity
Key Levels
Overbought (+0.75) and oversold (-0.75) reference lines
Zero-centerline for momentum direction bias
Applications:
Trend Confirmation: Align higher timeframe signals with lower timeframe entries
Divergence Detection: Spot inter-timeframe discrepancies in momentum
Regime Filter: Use higher timeframe composite values to filter trades
Technical Basis:
Inverse Fisher Transform: Compresses oscillator values into bounded (-1 to +1) range while emphasizing extreme moves
Dual WMA Smoothing: Combines initial calculation smoothing (WMA1) with final output smoothing (WMA2)
Exponential Scaling: (e^2x - 1)/(e^2x + 1) formula converts Gaussian-like distributions to bounded outputs
Credits:
Original Concept: John Ehlers (IFT methodology, cyclical analysis foundations)
Initial Implementation: KIVANC (@fr3762 on Twitter) for the base IFT-CCI/Stoch/RSI script
Multi-Timeframe Adaptation: for cross-resolution analysis capabilities
This tool is particularly effective for traders seeking to align multiple timeframes while using Ehlers' noise-reduction techniques. The composite average line provides a consensus view, while the individual oscillators help identify component strength/weakness.

LANZ Strategy 2.0🔷 LANZ Strategy 2.0 — London Breakout Confirmation with Structural Swing Protection
LANZ Strategy 2.0 is a structured trading system that leverages the last confirmed market direction before the London session to define directional bias and manage trades based on key structural swing levels. It is tailored for intraday traders looking to capitalize on early London volatility with built-in risk management and visual clarity.
🧠 Core Components:
Directional Confirmation (Pre-London Bias): Validates the last breakout or structural move from the 15-minute timeframe before 02:15 a.m. New York time (start of the London session), establishing the expected market direction.
Time-Based Execution: Executes potential entries strictly at 02:15 a.m. NY time, using market structure to support Long or Short bias.
Dynamic Swing-Based SL System: Allows user to select between three SL protection models: First Swing (most recent structural point) Second Swing (prior level) Total Coverage (includes both swings + extra buffer) This supports flexibility based on trader profile or market conditions.
Visual Risk Mapping: All SL and TP levels are clearly plotted.
End-of-Session Management: Positions are automatically evaluated for closure at 11:45 a.m. NY time. SL, TP, or manual close outcomes are labeled accordingly.
📊 Visual Features:
Labels for 1st and 2nd swing levels upon entry.
Dynamic lines projecting SL/TP levels toward the end of the session.
Session background coloring for Pre-London, Execution, and NY sessions.
Real-time percentage outcome labels (+2.00%, -1.00%, or net % at session end).
Automatic deletion of previous visuals on new entries for clean charting.
⚙️ How It Works:
Detects last structural breakout on the 15m timeframe before 02:15 a.m. NY.
On the 02:15 a.m. candle, executes a Long or Short logic entry.
Plots corresponding SL and TP based on selected swing model.
Monitors price action: If TP or SL is hit, labels it accordingly. If no exit is hit, trade closes manually at 11:45 a.m. NY with net result shown.
Optional logic to reverse entries if market structure breaks before execution.
🔔 Alerts:
Daily execution alert at 02:15 a.m. NY (prompting manual review or action).
Optional alert logic can be extended for SL/TP hits or structure breaks.
📝 Notes:
Designed for semi-automated or discretionary intraday trading.
Best used on Forex pairs or indices with strong London session behavior.
Adjustable parameters include session hours, swing SL type, and buffer settings.
Credits:
Developed by LANZ, this script combines time-based execution with dynamic structure protection, offering a disciplined framework for participating in the London session breakout with clear visuals and risk logic.

LANZ Strategy 3.0🔷 LANZ Strategy 3.0 — Asian Range Fibonacci Strategy with Execution Window Logic
LANZ Strategy 3.0 is a rule-based trading system that utilizes the Asian session range to project Fibonacci levels and manage entries during a defined execution window. Designed for Forex and index traders, this strategy focuses on structured price behavior around key levels before the New York session.
🧠 Core Components:
Asian Session Range Mapping: Automatically detects the high, low, and midpoint during the Asian session.
Fibonacci Level Projection: Projects configurable Fibonacci retracement and extension levels based on the Asian range.
Execution Window Logic: Uses the 01:15 NY candle as a reference to validate potential reversals or continuation setups.
Conditional Entry System: Includes logic for limit order entries (buy or sell) at specific Fib levels, with reversal logic if price breaks structure before execution.
Risk Management: Entry orders are paired with dynamic SL and TP based on Fibonacci-based distances, maintaining a risk-reward ratio consistent with intraday strategies.
📊 Visual Features:
Asian session high/low/mid lines.
Fibonacci levels: Original (based on raw range) and Optimized (user-adjustable).
Session background coloring for Asia, Execution Window, and NY session.
Labels and lines for entry, SL, and TP targets.
Dynamic deletion of untriggered orders after execution window expires.
⚙️ How It Works:
The script calculates the Asian session range.
Projects Fibonacci levels from the range.
Waits for the 01:15 NY candle to close to validate a signal.
If valid, a limit entry order (BUY or SELL) is plotted at the selected level.
If price structure changes (e.g., breaks the high/low), reversal logic may activate.
If no trade is triggered, orders are cleared before the NY session.
🔔 Alerts:
Alerts trigger when a valid setup appears after 01:15 NY candle.
Optional alerts for order activation, SL/TP hit, or trade cancellation.
📝 Notes:
Intended for semi-automated or discretionary trading.
Best used on highly liquid markets like Forex majors or indices.
Script parameters include session times, Fib ratios, SL/TP settings, and reversal logic toggle.
Credits:
Developed by LANZ, this script merges traditional session-based analysis with Fibonacci tools and structured execution timing, offering a unique framework for morning volatility plays.
LANZ Strategy 4.0🔷 LANZ Strategy 4.0 — Trend Impulse Detection with Risk Management
LANZ Strategy 4.0 is a multi-indicator trend strategy designed for short to medium-term trading on any asset or timeframe. It combines Parabolic SAR, Supertrend, ADX, and time zone highlighting to detect and confirm trend impulses, while managing entries with dynamic Stop Loss (SL) and Take Profit (TP) levels.
🧠 Core Components:
Parabolic SAR: Identifies short-term trend reversals.
Supertrend: Highlights trend continuation zones.
ADX Filter: Ensures trend strength by filtering entries when ADX exceeds a defined threshold.
Impulse Detection Logic: Detects and confirms movement impulses with a counter, only generating trade signals on confirmed sequences.
Risk Management: Calculates dynamic SL/TP with a default risk-reward ratio of 1:2, minimum SL of 4 pts, and maximum of 12 pts.
📊 Visual Features:
Trend lines from Supertrend and SAR.
Colored background zones for different sessions (Asia, NY).
Labels and lines for entry, SL, and TP.
Movement number labels help visualize impulse progression.
Alerts when a new impulse is confirmed.
⚙️ How It Works:
The strategy waits for a confirmed impulse (i.e., change in SAR + Supertrend + ADX filter).
Once a valid impulse is confirmed:
A trade signal (BUY/SELL) is shown.
SL and TP levels are calculated and drawn.
The script monitors live price to determine if SL or TP is hit.
Impulse counter advances to label movement progression.
🔔 Alerts:
You will receive an alert each time a new valid impulse is confirmed, indicating a potential trading opportunity.
📝 Notes:
Script is intended for discretionary or assisted trading, not automated execution.
Works best during active sessions with visible trend direction.
You can adjust ATR period, multiplier, SL padding, and impulse thresholds.
Credits:
Developed by LANZ combines established technical indicators and original impulse-count logic.

RSI_Heikinashi📜 Title:
Heikin-Ashi RSI Candle Plot with Multi-Timeframe Analysis and EMA Overlay
📖 Full Description:
This is an original custom indicator that transforms the traditional Relative Strength Index (RSI) into a Heikin-Ashi (HA) candle representation, allowing traders to visualize RSI trends with greater clarity, less noise, and multi-timeframe perspective.
🛠️ Core Concept and Original Method:
Rather than plotting a single RSI line, this script recalculates RSI into a Heikin-Ashi candle format, using a double EMA smoothing method on the RSI data itself.
Here's how the transformation works:
RSI Calculation:
RSI is computed traditionally using Wilder's Moving Average (RMA) for smoothing gains and losses.
The RSI period and price source are fully customizable (default length = 28, source = close).
Heikin-Ashi Style Smoothing (applied to RSI):
The HA Close is calculated as the EMA of the average between the current RSI and previous HA Close.
The HA Open is calculated as the EMA of the average between the previous HA Open and the current HA Close.
The HA High and HA Low are dynamically calculated based on the maximum/minimum values of the current RSI, HA Open, and HA Close.
Smoothing is done via 5-period EMA, which adds a unique layer of trend smoothing without traditional price-based HA calculation.
Multi-Timeframe Comparison:
In addition to plotting the chart timeframe HA RSI, the indicator retrieves the 1-hour timeframe HA RSI using request.security.
This allows traders to align trades with higher timeframe RSI trends, a powerful technique for multi-timeframe confirmation.
50 EMA Overlay:
A 50-period Exponential Moving Average (EMA) is plotted over both the chart timeframe HA RSI and the 1-hour HA RSI.
EMA acts as a trend filter or dynamic support/resistance for RSI behavior.
RSI Bands and Visual Aids:
Standard RSI bands at 70 (Overbought), 50 (Midline), and 30 (Oversold) are plotted.
A shaded background between the 30–70 levels helps highlight RSI range-bound movements versus breakout momentum.
🔥 Why this script is original and useful:
Unique Application:
This is not a simple RSI plot or standard Heikin-Ashi candle — it is a specialized smoothing method applied directly to RSI values for a clearer, noise-reduced momentum reading.
Multi-Timeframe Advantage:
Unlike typical RSI indicators, it includes a 1-hour timeframe comparison alongside the chart timeframe, improving decision-making across intraday and swing strategies.
Advanced Smoothing Logic:
Double EMA smoothing of RSI and HA-style recalculations offer a much smoother signal than traditional RSI or basic RSI/EMA crossovers.
Visualized Trend Strength:
Using colored candles instead of just a line enhances readability and gives an intuitive sense of momentum direction, strength, and possible reversals.
Fully Customizable:
Traders can adjust the RSI period and source depending on asset volatility or timeframe preferences.
📋 How to Use:
Look for HA RSI candles color changes for early momentum shifts.
Use the 50 EMA crossovers on HA RSI to confirm larger trend changes.
Compare chart timeframe vs 1H timeframe HA RSI for stronger signal alignment.
Watch for overbought/oversold breaks beyond the 70/30 bands for trade entries or exits.
⚙️ Inputs:
RSI Length (Default: 28)
RSI Source (Default: Close)
📢 Important Note:
This script is originally conceptualized and custom-built.
It is not a mashup of existing open-source indicators and introduces a new smoothing technique for RSI visualization.
🙏 Credits:
Script developed by Sri_RSI.
Overnight ES Strategy: CBC + Fractal + RSI + ATR FilterThis script is designed for overnight trading of the E-mini S&P 500 futures (ES) between 6 PM and 11 PM EST.
It combines multiple technical confluences to generate high-probability buy and sell signals, focusing on volatility-rich, low-liquidity evening sessions.
Key Features:
Candle Body Confluence (CBC) Approximation:
Identifies candles with small real bodies compared to total range, simulating consolidation zones where price is likely to reverse.
Williams Fractal Confirmation:
Detects local tops and bottoms based on 5-bar fractal reversal patterns, helping validate breakout or reversal points.
RSI Filter:
Ensures momentum is supportive — buys only when RSI < 35 (oversold) and sells only when RSI > 65 (overbought).
ATR Volatility Filter:
Trades are only allowed if the Average True Range (ATR) exceeds a user-defined threshold, filtering out low-volatility, risky environments.
Time Session Control:
Signals are only generated during the user-defined evening session (default: 6 PM to 11 PM EST) to match market behavior.
Real-Time Alerts Enabled:
Alerts can be set for BUY or SELL conditions, enabling mobile notifications, emails, or pop-ups without constant chart monitoring.
Recommended Settings:
Chart Timeframe: 15-minute or 30-minute candles
Assets: ES Mini (ES1!), NQ Mini, or other CME futures
Session: New York Time (EST)
ATR Threshold: Adjust based on market conditions; 5.0 suggested starting point for ES Mini on 15m.
Important:
This script only plots signals, it does not auto-execute trades.
Always backtest and paper trade before using live capital.
Volatility can vary; consider adjusting RSI and ATR filters based on market environment.
Credits:
Script designed based on confluence of price action, momentum, reversal structure, and volatility filtering principles used by professional traders.
Inspired by Candle Body Confluence (CBC) theory and Williams fractal techniques.
