OHLC_yesterday_and_lastweekBy using this indicator, you can see these points.
1. Yesterday's OHLC + half price, today's limit price
2. Last week's OHLC + half price
3. 5 EMAs
Especially effective for foreign exchange, metals and indices.
Buscar en scripts para "META股价历史数据"

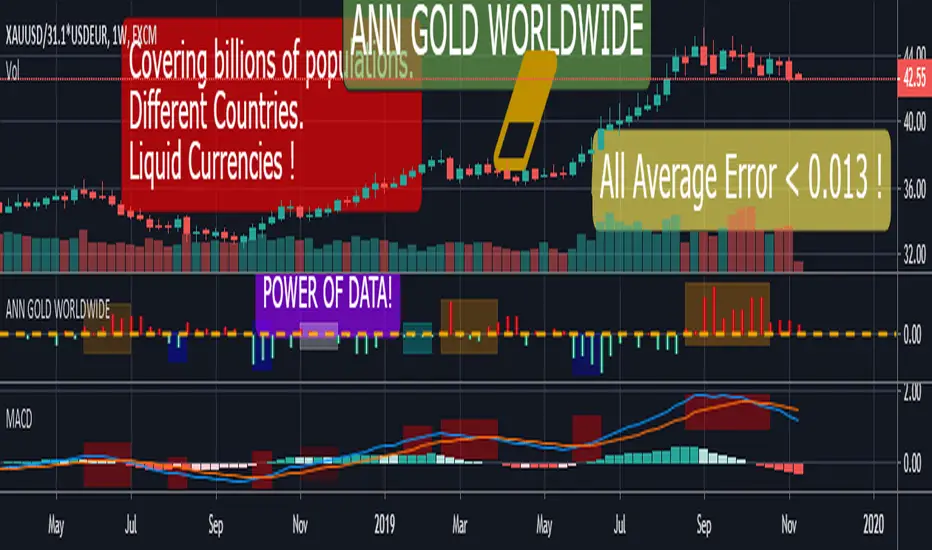
ANN GOLD WORLDWIDE This script consists of converting the value of 1 gram and / or 1 ounce of gold according to the national currencies into a system with artificial neural networks.
Why did I feel such a need?
Even though the printed products in the market are digitally circulated, only precious metals are available in full or near full.
Silver is difficult to carry because you have to buy too much because the unit price is low.
Platinum is very difficult to find and used in industry.
Gold is both practical and has less volatile movements, even more balanced than dollars, to preserve the value of money.
Uncertainty and tensions benefit gold.
Obviously this is my own opinion and is not worth the investment advice:
If there is to be an economic crisis, it is obvious that the dollar will rise against the emerging currencies, but I expect a crisis where gold and the dollar will rise together.
The world has been on a mercantilist line more than ever!
Spot gold can be bought from goldsmiths and banks.
I think this command will benefit people everywhere but in economies that are subject to developing currencies.
Now we can look at the details:
All you have to do is load the appropriate chart and select it from the menu.
Thus, the system will adjust itself to that instrument.
MENU and Tickers :
"GOLD" : XAUUSD or GC1! or GOLD (Average error = 0.0128)
"GOLDSILVER" : XAUXAG or GOLDSILVER (Gold Silver Ratio ) ( Average error : 0.01 )
"GOLD CZK " : XAUUSD/USDCZK ( 1 Ounce Gold Czech Koruna) ( Average error = 0.010879 )
"GOLD NZD " : XAUUSD/USDNZD ( 1 Ounce Gold New Zealand Dollar ) (Average error = 0.010736 )
"GOLD EURO" : XAUUSD/USDEUR ( 1 Ounce Gold Euro) ( Average error = 0.010000 )
"GOLD HUF " : XAUUSD/USDHUF ( 1 Ounce Gold Hungarian Forint ) ( Average error = 0.010000 )
"GOLD INR " : XAUUSD/USDINR (1 Ounce Gold Indian Rupee ) (Average error = 0.010458 )
"GOLD DKK" : XAUUSD/USDDKK (1 Ounce Gold Danish Krone) (Average error = 0.010671 )
"GOLD CHF" : XAUUSD/USDCHF (1 Ounce Gold Swiss Franc ) (Average error = 0.010967 )
"GOLD CNH" : XAUUSD/USDCNH(1 Ounce Gold Offshore RMB) (Average error = 0.012017 )
"GOLD MXN" : XAUUSD/USDMXN(1 Ounce Gold Mexican Peso) (Average error = 0.010000 )
"GOLD PLN" : XAUUSD/USDPLN (1 Ounce Gold Polish Zloty ) (Average error = 0.010173 )
"GOLD ZAR" : XAUUSD/USDZAR (1 Ounce Gold South African Rand (Average error = 0.010484 )
"GOLD NOK" : XAUUSD/USDNOK (1 Ounce Gold Norwegian Krone ) (Average error = 0.010842 )
"GOLD TRY" : XAUUSD/USDTRY (1 Ounce Gold Turkish Lira ) (Average error = 0.010000 )
"GOLD THB" : XAUUSD/USDTHB (1 Ounce Gold Thai Baht ) (Average error = 0.011747 )
Important note : XAUUSD/USDCUR = 1 Ounce Gold , XAUUSD/31.1*USDCUR = 1 gram Gold (CUR = Currency )
If you want to physically hold it, look gram value, because as far as I know, all goldsmiths and jewelleries in the world are selling gram gold.
I think that this command is the most useful and the concrete one that I have ever written.
I end my sentences with this anonymous proverb :
"Even if gold falls into the mud, it's still gold ! "
ATR, Kijun-Sen, %R Strategy [No Nonsense FX]A strategy that employs the No Nonsense FX method as described by VP.
1. Risk: ATR
2. Baseline: Kijun-Sen
3. Confirmation #1: Williams % Range
4. Volume: TBD
5. Confirmation #2: TBD
6. Exit: TBD
Give me a follow if you enjoy and please PM me for more info/collabs!
Notes:
The defaults seem to work on all pairs
Please check the "two digit" box if running on JPY or Metals
If you have any ideas for a volume indicator, confirmation, and/or exit leave a comment!

Adaptive Zero Lag EMA [STUDY]A user has asked for the Study/Indicator version of this Strategy .
If you encounter the error "loop....>100ms" simply toggle the eye icon to hide and unhide the indicator
The following is simply quoted from my previous post for your convenience: (obviously there won't be risk, Stop Loss, or Take profit parameters!)
OPERATING PRINCIPLE
The strategy is based on Ehlers idea that any indicator can be turned into a signal-producing trade system through smoothing and other filtering processes.
In fact, I'm using his Zero Lag EMA ( ZLEMA ) as a baseline indicator as well as some code snippets he has made public (1). God bless open source!
Next, I've provided the option to use an Instantaneous Frequency Measurement (IFM) method, which will adaptively choose the best period for the ZLEMA (2)
I've written other studies that use the differential calculus approximations for IFM, so it was only natural to include them in this strategy.
The primary two are Cosine IFM (3) and In-phase Quadrature IFM (4). You can also find an indicator with both plotted and the ability to average them together, as one IFM prefers long periods and the other short. (5)
BEFORE WE BEGIN
1. This strategy only runs on "normal" FX pairs ( EURUSD , GBPJPY , AUDUSD ...) and will fail on Metals or Commodities.
Cryptos are largely untested.
2. Please run it on these time frames: M15 to D.
Anything outside this range will likely fail.
HOW TO USE AND SUCCEED
1. If the Default settings don't produce good results right off the bat, then lower gain limit to 1 or 2 and threshold to 0.01.
2. Test each setting under adaptive method. If you want to leave it Off, then I'd recommend using some kind of IFM (see my links below) to
discover the most efficient period to use.
3. Once you have the best adaptive method chosen, begin incrementing gain limit until you find a nice balance between profit factor ( PF ) and drawdown.
4. Now, begin incrementing threshold. The goal is to have PF above 2 and a drawdown as low as possible.
5. Finally, change the source! Typically, close is the best option, but I have run into cases where high
yielded the highest returns and win rate.
6. Sit back, relax, and tweak the risk until you're happy with the return and drawdown amounts.
ADVANCED
You may need to adjust take profit (TP) points and stop loss (SL) points to create the best entry possible. Don't be greedy! You'll likely have poor
results if the TP is set to 300 and SL is 50.
If you are trading a pair that has a long Dominant Cycle Period, then you may increase Max Period to allow the IFM
to accept longer periods. Any period above the Max Period will be rejected. This may increase lag time!
Cheers and good luck trading!
-DasanC
(1)www.mesasoftware.com
(2)www.jamesgoulding.com
(3) Cosine IFM
(4) I-Q IFM
(5) Averaging IFM
IFM stands for Instantaneous frequency measurement
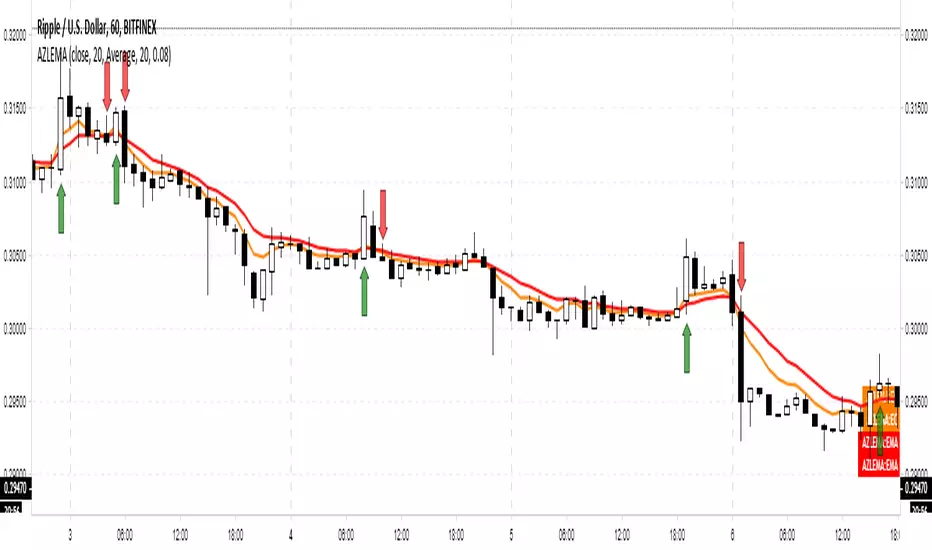
Adaptive Zero Lag EMA v2This is my most successful strategy to date! Please enjoy and join the Open Source movement by sharing your code and ideas online!
OPERATING PRINCIPLE
The strategy is based on Ehlers idea that any indicator can be turned into a signal-producing trade system through smoothing and other filtering processes.
In fact, I'm using his Zero Lag EMA (ZLEMA) as a baseline indicator as well as some code snippets he has made public (1). God bless open source!
Next, I've provided the option to use an Instantaneous Frequency Measurement (IFM) method, which will adaptively choose the best period for the ZLEMA (2)
I've written other studies that use the differential calculus approximations for IFM, so it was only natural to include them in this strategy.
The primary two are Cosine IFM (3) and In-phase Quadrature IFM (4). You can also find an indicator with both plotted and the ability to average them together, as one IFM prefers long periods and the other short. (5)
BEFORE WE BEGIN
1. This strategy only runs on "normal" FX pairs (EURUSD, GBPJPY, AUDUSD ...) and will fail on Metals or Commodities.
Cryptos are largely untested.
2. Please run it on these time frames: M15 to D.
Anything outside this range will likely fail.
HOW TO USE AND SUCCEED
1. If the Default settings don't produce good results right off the bat, then lower gain limit to 1 or 2 and threshold to 0.01.
2. Test each setting under adaptive method . If you want to leave it Off , then I'd recommend using some kind of IFM (see my links below) to
discover the most efficient period to use.
3. Once you have the best adaptive method chosen, begin incrementing gain limit until you find a nice balance between profit factor (PF) and drawdown.
4. Now, begin incrementing threshold . The goal is to have PF above 2 and a drawdown as low as possible.
5. Finally, change the source ! Typically, close is the best option, but I have run into cases where high
yielded the highest returns and win rate.
6. Sit back, relax, and tweak the risk until you're happy with the return and drawdown amounts.
ADVANCED
You may need to adjust take profit (TP) points and stop loss (SL) points to create the best entry possible. Don't be greedy! You'll likely have poor
results if the TP is set to 300 and SL is 50.
If you are trading a pair that has a long Dominant Cycle Period , then you may increase Max Period to allow the IFM
to accept longer periods. Any period above the Max Period will be rejected. This may increase lag time!
Cheers and good luck trading!
-DasanC
PS - This code doesn't repaint or have future-leak, which was present in Pinescript v2.
PPS - Believe me! These returns are typical! Sometimes you must push aside the "if it's too good to be true..." mindset that society has ingrained in you.
Do you really believe the most successful pass up opportunities before investigating them? ;)
(1) Ehlers & Ric Zero Lag EMA
(2) Measuring Cycles by Ehlers
(3) Cosine IFM
(4) Inphase Quadrature IFM
(5) Averaging IFM

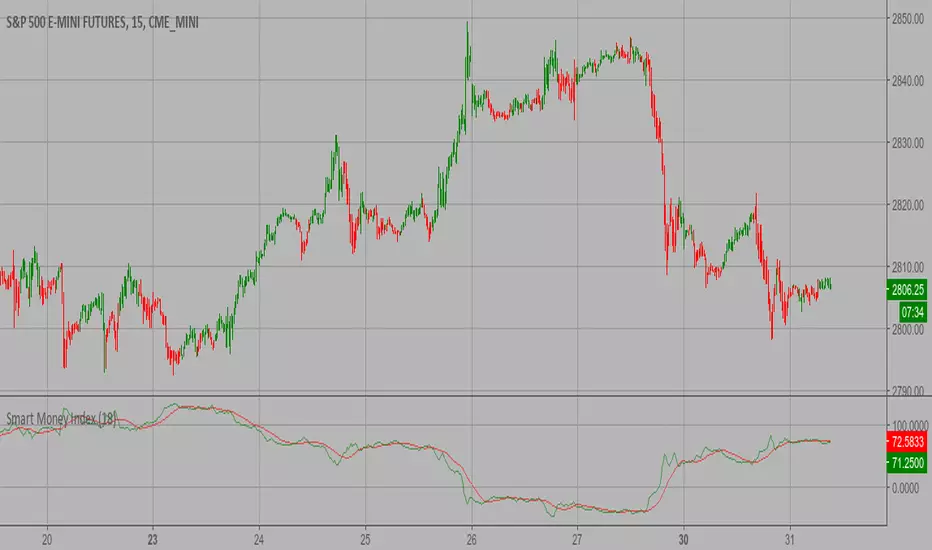
Smart Money Index (SMI) Backtest Attention:
If you would to use this indicator on the ES, you should have intraday data 60min in your account.
Smart money index (SMI) or smart money flow index is a technical analysis indicator demonstrating investors sentiment.
The index was invented and popularized by money manager Don Hays. The indicator is based on intra-day price patterns.
The main idea is that the majority of traders (emotional, news-driven) overreact at the beginning of the trading day
because of the overnight news and economic data. There is also a lot of buying on market orders and short covering at the opening.
Smart, experienced investors start trading closer to the end of the day having the opportunity to evaluate market performance.
Therefore, the basic strategy is to bet against the morning price trend and bet with the evening price trend. The SMI may be calculated
for many markets and market indices (S&P 500, DJIA, etc.)
The SMI sends no clear signal whether the market is bullish or bearish. There are also no fixed absolute or relative readings signaling
about the trend. Traders need to look at the SMI dynamics relative to that of the market. If, for example, SMI rises sharply when the
market falls, this fact would mean that smart money is buying, and the market is to revert to an uptrend soon. The opposite situation
is also true. A rapidly falling SMI during a bullish market means that smart money is selling and that market is to revert to a downtrend
soon. The SMI is, therefore, a trend-based indicator.
Some analysts use the smart money index to claim that precious metals such as gold will continually maintain value in the future.
You can change long to short in the Input Settings
WARNING:
- For purpose educate only
- This script to change bars colors.

Smart Money Index (SMI) Strategy Attention:
If you would to use this indicator on the ES, you should have intraday data 60min in your account.
Smart money index (SMI) or smart money flow index is a technical analysis indicator demonstrating investors sentiment.
The index was invented and popularized by money manager Don Hays. The indicator is based on intra-day price patterns.
The main idea is that the majority of traders (emotional, news-driven) overreact at the beginning of the trading day
because of the overnight news and economic data. There is also a lot of buying on market orders and short covering at the opening.
Smart, experienced investors start trading closer to the end of the day having the opportunity to evaluate market performance.
Therefore, the basic strategy is to bet against the morning price trend and bet with the evening price trend. The SMI may be calculated
for many markets and market indices (S&P 500, DJIA, etc.)
The SMI sends no clear signal whether the market is bullish or bearish. There are also no fixed absolute or relative readings signaling
about the trend. Traders need to look at the SMI dynamics relative to that of the market. If, for example, SMI rises sharply when the
market falls, this fact would mean that smart money is buying, and the market is to revert to an uptrend soon. The opposite situation
is also true. A rapidly falling SMI during a bullish market means that smart money is selling and that market is to revert to a downtrend
soon. The SMI is, therefore, a trend-based indicator.
Some analysts use the smart money index to claim that precious metals such as gold will continually maintain value in the future.
WARNING:
- This script to change bars colors.
Smart Money Index (SMI)Smart money index (SMI) or smart money flow index is a technical analysis indicator demonstrating investors sentiment.
The index was invented and popularized by money manager Don Hays. The indicator is based on intra-day price patterns.
The main idea is that the majority of traders (emotional, news-driven) overreact at the beginning of the trading day
because of the overnight news and economic data. There is also a lot of buying on market orders and short covering at the opening.
Smart, experienced investors start trading closer to the end of the day having the opportunity to evaluate market performance.
Therefore, the basic strategy is to bet against the morning price trend and bet with the evening price trend. The SMI may be calculated
for many markets and market indices (S&P 500, DJIA, etc.)
The SMI sends no clear signal whether the market is bullish or bearish. There are also no fixed absolute or relative readings signaling
about the trend. Traders need to look at the SMI dynamics relative to that of the market. If, for example, SMI rises sharply when the
market falls, this fact would mean that smart money is buying, and the market is to revert to an uptrend soon. The opposite situation
is also true. A rapidly falling SMI during a bullish market means that smart money is selling and that market is to revert to a downtrend
soon. The SMI is, therefore, a trend-based indicator.
Some analysts use the smart money index to claim that precious metals such as gold will continually maintain value in the future.
