Range Box + VMA cloudsHere's a mix of two indicators that I find particularly useful.
One is a Range Box showing High and Low of the day plus 50% range, as well as high and low of the previous day. The Box changes color based on whether it closed higher or lower than the previous session.
The second one plots Variable Moving Average clouds - short and long term one.
The rules are pretty simple - take long trades only if the box is green, short trades if it's red.
Candle close above both clouds - long signal. If the price is being rejected from the long term cloud - buy the dip (or rally).
Pretty straightforward.
Enjoy
Credit for VMA: LazyBear
Credit for High Low DayBox: ahoudori
Buscar en scripts para "LazyBear"

Variable SuperTrend - evoPlayed around with Lazy Bear's VMA and Gunazzi's SuperTrend Cloud .
It plots an uptrend if the low of a candle gets above the recent downtrend and plots a downtrend if the high of a candle gets below the recent uptrend, you have to wait for the candle to close to confirm the actual trend change.
I use it to give me a direction for longs or shorts, not as a stop/reverse indicator.
Thanks Lazy Bear and Gunazzi :)

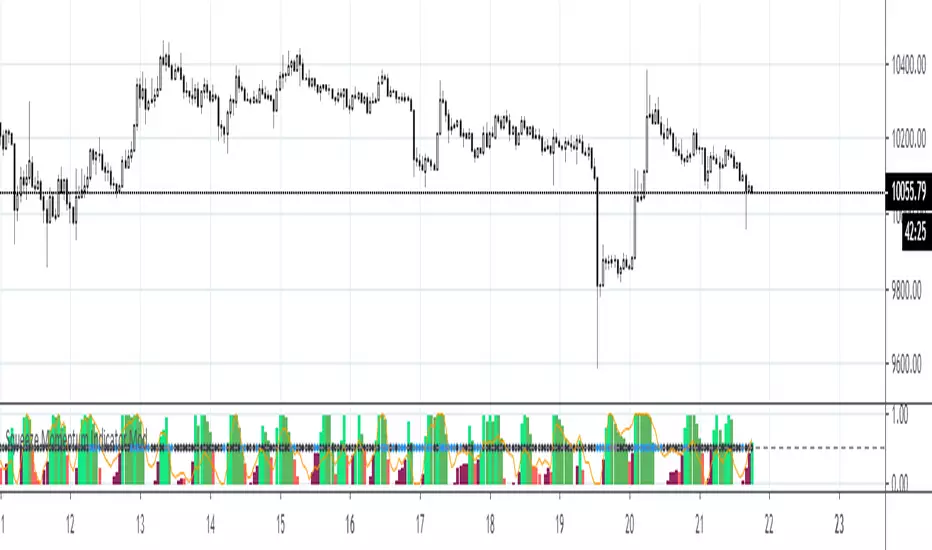
ALTS-Trend
ALTS-Trend
Altcoins-Trend is a technique that shows how much Altcoins is dominating the Marketcap and it's effect over the whole Crypto Market ,and that will show you alts season in each time frame because trend is relative .
*** Features
* Color grading to show you the Increase of domination effect (Green).
* Color grading to show you the Decrease of domination effect (Red) .
* Better understanding to the market ,and that will help you with a very good timed trades at the best trading times for altcoins .
/////////////////////////////////////////////
*Note
Special thanks for Lazybear for his momentum algorithm .
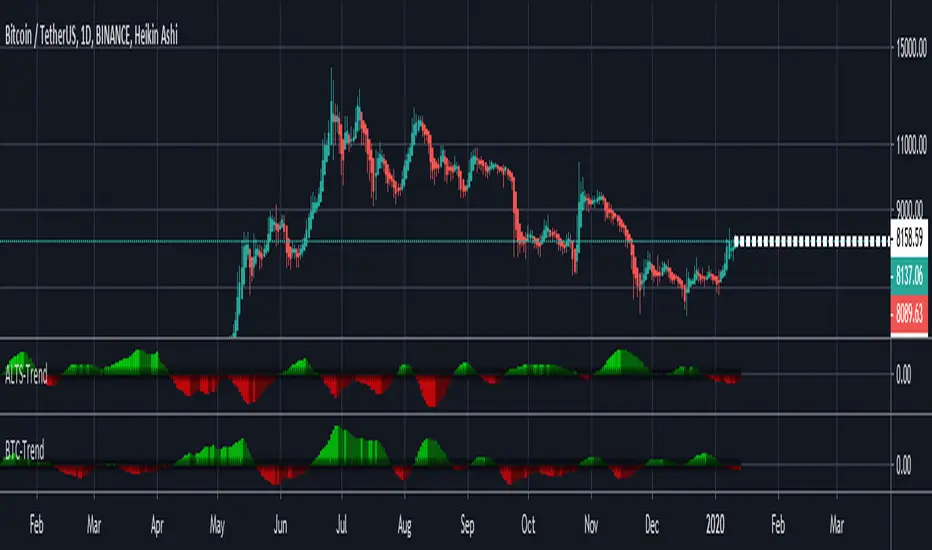
BTC-Trend
BTC-Trend
BTC-Trend is a technique that shows how much BTC is dominating the market and it's effect over the whole Crypto Market.
*** Features
* Color grading to show you the Increase of domination effect (Green).
* Color grading to show you the Decrease of domination effect (Red) .
* Better understanding to the market ,and that will help you with a very good timed trades at the best trading times .
/////////////////////////////////////////////
*Note
Special thanks for Lazybear for his momentum algorithm .

Volatility SwitchThis is originally a script built by LazyBear in version 2 and updated to version 4. Slowly trying to learn other concepts in Pine and sharing what I come up with just in case it adds any value to the community. This gives a good idea of low volatility in the market and is a good warning sign to pay attention for a larger move when volatility swings back the other way.

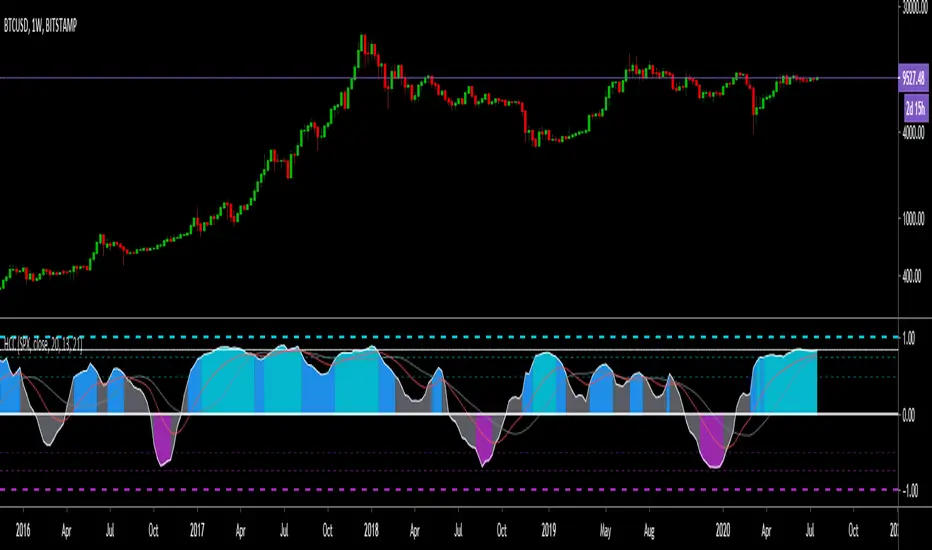
Hashem Correlation CoefficientCorrelation Coefficient
Core Code from: www.tradingview.com
This indicator Show Correlation between the Current Ticker & timeframe and a Customizable Ticker. After adding the indicator you can change the second ticker in the settings.
The Correlation Coeff is between -1 to 1 which 1 means 100% correlation and -1 means -100% correlation ( Inverse Correlation ).
The color of the area changes when:
Blue : CC > 0.5
Aqua : CC > 0.75
Purple : CC < -0.5
Red : CC < -0.75
Zenith TraderWarning, all trading involves risk. Be sure to do your own research before placing in a trade and do not realize solely on this indicator.
Zenith Trader is made up of 3 parts
RSI , WaveTrend by LazyBear, & GMMA Oscillator by JustUncleL
It uses crosses of the 0 and/or 50 line on all indicators as a buy/sell indication
You can change which indicator is showing on the main screen in the settings.
You can all change the time frame when the alerts will pop up in order to customize your own time for alerts to go off.

$ SuPeR-RePaNoCHa $ [Alerts]Script for automatic trading (Alerts). This is the second part of the previous RePanoCHa script but with Take Profit.
It Use 6 indicators + volume:
-JURIK MOVING AVERAGE
-RANGE FILTER (DONOVAN WALL)
-ADX (ORIGINAL VERSION)
-PARABOLIC SAR
-RSI + VOLUME WEIGHTED (LAZYBEAR)
-MACD
-VOLUME
To close the position you can choose between Take Profit only, Trailing Stop only or both at the same time.
Example of bot syntax: (alerts once per bar)
LONG | e=BINANCEFUTURES a=ACCOUNT s=BTCUSDT c=order | delay=1 | e=BINANCEFUTURES a=ACCOUNT s=BTCUSDT c=position b=short t=market ro=1 | delay=1 | e=BINANCEFUTURES a=ACCOUNT s=BTCUSDT b=long q=100% t=market | delay=1 | e=BINANCEFUTURES a=ACCOUNT s=BTCUSDT c=position b=long p=0.7% q=50% t=post ro=1
SHORT | e=BINANCEFUTURES a=ACCOUNT s=BTCUSDT c=order | delay=1 | e=BINANCEFUTURES a=ACCOUNT s=BTCUSDT c=position b=long t=market ro=1 | delay=1 | e=BINANCEFUTURES a=ACCOUNT s=BTCUSDT b=short q=100% t=market | delay=1 | e=BINANCEFUTURES a=ACCOUNT s=BTCUSDT c=position b=short p=-0.7% q=50% t=post ro=1
LONG TP | e=BINANCEFUTURES a=ACCOUNT s=BTCUSDT c=position q=50% t=market ro=1 (if you set the TP from entry this alert is not necessary)
SHORT TP | e=BINANCEFUTURES a=ACCOUNT s=BTCUSDT c=position q=50% t=market ro=1 (if you set the TP from entry this alert is not necessary)
LONG TS | e=BINANCEFUTURES a=ACCOUNT s=BTCUSDT c=position q=10% t=market // (alerts once per minute)
SHORT TS | e=BINANCEFUTURES a=ACCOUNT s=BTCUSDT c=position q=10% t=market // (alerts once per minute)
XLONG/STOP-LOSS | e=BINANCEFUTURES a=ACCOUNT s=BTCUSDT c=order | delay=1 | e=BINANCEFUTURES a=ACCOUNT s=BTCUSDT c=position b=long t=market ro=1
XSHORT/STOP-LOSS | e=BINANCEFUTURES a=ACCOUNT s=BTCUSDT c=order | delay=1 | e=BINANCEFUTURES a=ACCOUNT s=BTCUSDT c=position b=short t=market ro=1

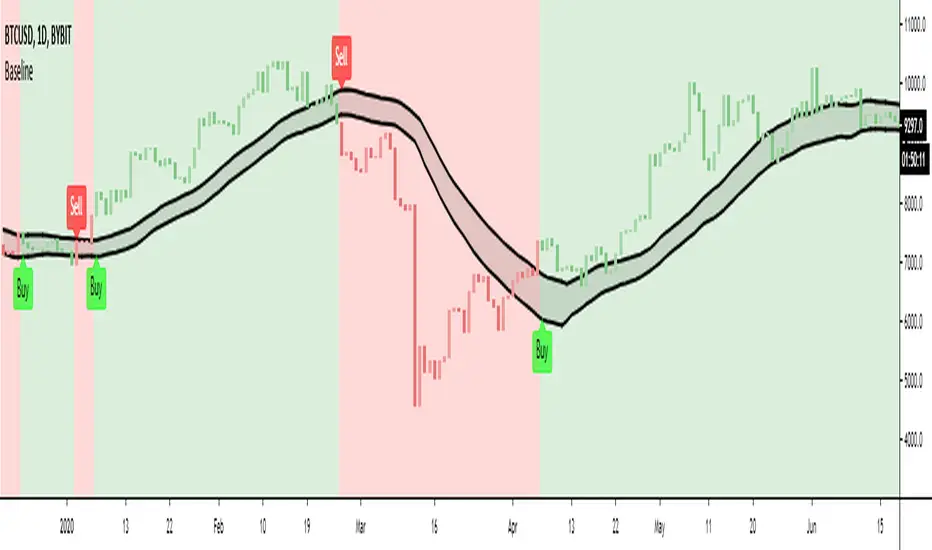
Baseline - evoPlots the high and low of your chosen moving average.
Options are:
SMA = Simple Moving Average
EMA = Exponential Moving Average
WMA = Weighted Moving Average
HMA = Hull Moving Average
VWMA = Volume Weighted Moving Average
RMA = Exponetial Weighted Moving Average
ALMA = Arnaud Legoux Moving Average
Unbox "Use Current Timeframe" to use chosen timeframe below
I mainly use this to get in and out of the market for futures trading, to reduce fake outs of having just one moving average line.
Let me know if you like it..
Inspired from LazyBear's EMAenvelope :)
R100 Volatility Combo Bands v1 (*v*)The Volatility Combo Bands are made from 4 separate volatility bands- two Bollinger Bands (10 and 20 period) and two Price Headley Acceleration Bands (10 and 20 period). The Volatility Combo Bands plot the innermost upper and lower points from these bands and then plots a mid-line. By default, only the standard 20 period Bollinger Bands and Combo Bands with mid-line are displayed, but can be configured however you want.
Try it out- see squeezes earlier, ride the bands earlier in trending markets, trade pullbacks to the Combo Bands and mid-line, trade the range of the band or use them to help identify potential support and resistance levels. Hopefully they can add another dimension to identifying volatility contraction patterns or whatever you currently use these things for!
I hope you get some value out of it. Only conditions of use are that if you improve it, let me know and if you publish something that uses it, don't hide the code! Enjoy!
Code for the Price Headley Acceleration Bands pinched and modified from LazyBear - thankyou.

Multi momentum indicatorScript contains couple momentum oscillators all in one pane
List of indicators:
RSI
Stochastic RSI
MACD
CCI
WaveTrend by LazyBear
MFI
Default active indicators are RSI and Stochastic RSI
Other indicators are disabled by default
RSI, StochRSI and MFI are modified to be bounded to range from 100 to -100. That's why overbought is 40 and 60 instead 70 and 80 while oversold -40 and -60 instead 30 and 20.
MACD and CCI as they are not bounded to 100 or 200 range, they are limited to 100 - -100 by default when activated (extras are simply hidden) but there is an option to show full indicator.
In settings there are couple more options like show crosses or show only histogram.
Default source for all indicators is close (except WaveTrend and MFI which use hlc3) and it could be changed but for all indicators.
There is an option for 2nd RSI which can be set for any timeframe and background calculated by Fibonacci levels.

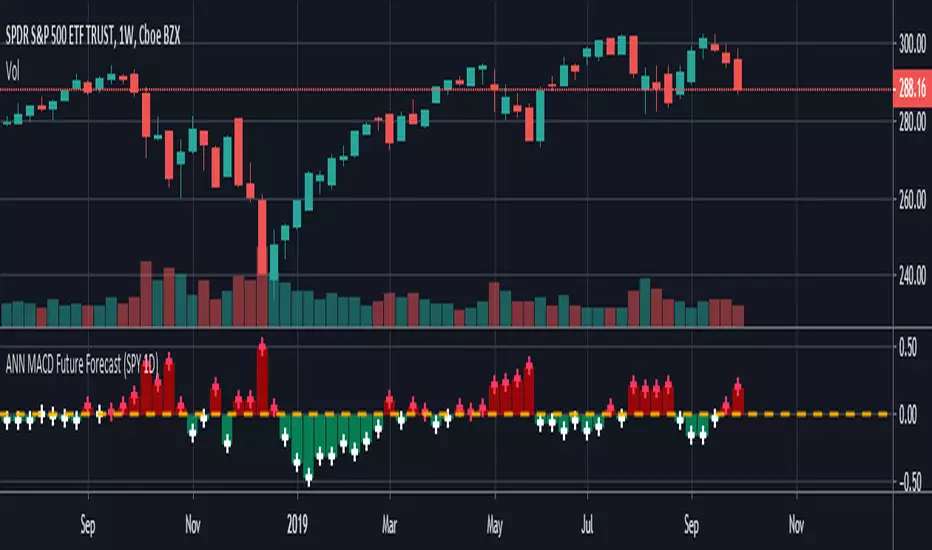
ANN MACD Future Forecast (SPY 1D) NOTE : Deep learning was conducted in a narrow sample set for testing purposes. So this script is Experimental .
This system is based on the following article and is inspired by an external program:
hackernoon.com
None of the artificial neural networks in Tradingview work and are not based on completely correct logic. Unlike others in this system:
IMPORTANT NOTE: If the tangent activation function is used, the input data must also have tangent values (compared to the previous values of 1 bar).
Inputs were prepared according to this judgment.
1. The tangent function which is the activation function is written correctly. (The tangent function in the article: ActivationFunctionTanh (v) => (1 - exp (-2 * v)) / (1 + exp (-2 * v)))
2. Missing bias parts in the formulas were added.
3. The output function is taken from the next day (historical), so that the next bar can be predicted, which is the truth.
4.The forecast value of the next bar is subtracted from the current bar change and the market direction is determined.
5.When the future forecast and the current close are added together, the resulting data is called seed.
The seed carries data both from the present and from yesterday and from the future.
6.And this seed was subjected to the MACD method.
Thus, due to exponential averages, more importance will be given to recent developments and
The acceleration situations will show us the direction.
However, a short position should be taken for crossover and a long position for crossunder .
Because the predicted values work in reverse.Even though we use the same period (9,12,26) it is much faster!
7. There is no future code that can cause Repaint.
However, the color after closing should be checked.
The system is completely correct.
However, a very narrow sample was selected.
100 data: Tangent diffs ; volume change, bollinger bands values changes (Upband , Midband , Lowband) and LazyBear's Squeeze Momentum Indicator (SQZMOM_LB) change and the next bar data (historical) price change were put into the deep learning test.
IMPORTANT NOTE : The larger the sample set and the more effective dependent variables, the higher the hit rate of the deep learning test!
EDIT : This code is open source under the MIT License. If you have any improvements or corrections to suggest, please send me a pull request via the github repository github.com
Stay tuned. Best regards!
Market Wizard WTInspired in MC and lazybear WT.
Education purposes only.
Indicator package includes WT, StochRSI and MFI.

WaveTrend - Market Cipher BHey guys,
Just releasing a quick copy of LazyBear's wavetrend indicator slightly modified to be more reactive and contains a few other extras for people who don't have pro like a stochastic and RSI indicator above the wave to find more confluence.
The indicator will show crosses but shows them below the indicator as well if they are stronger removing some noise.


Squeeze Momentum Indicator ModThis is a scaled version of LazyBear's Squeeze Momentum Indicator. Also added are fibo-based periods for BB and KC.
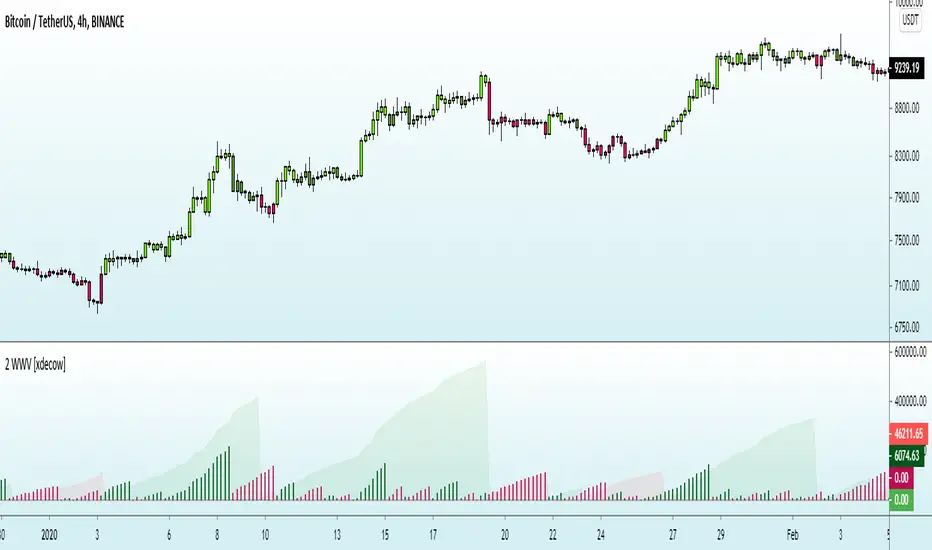
ESHMAN Weis Wave Volume With AlertsAll credits to author LazyBear, I added alerts and overlay. Trade at your own risk, author of this indicator take no responsibility for your loss.

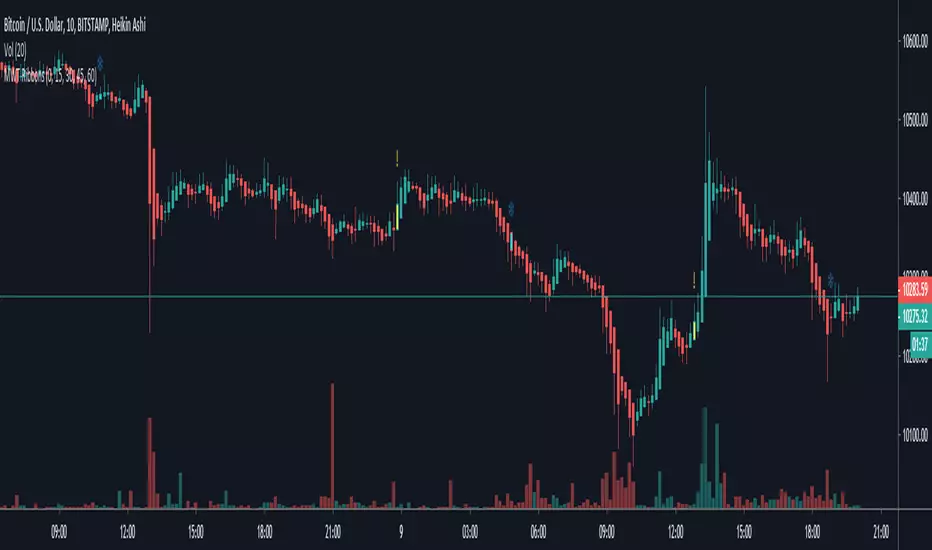
Multiple WaveTrend with Ribbons [CryptoFarian]This is based on LazyBear's WaveTrend Oscillator . I get the idea from klov's Kite Crossing Oscillator which adds support for multiple time frames and what I have done here is to add support for Heikin Ashi candles, ribbons and mark bars for long/short opportunities.
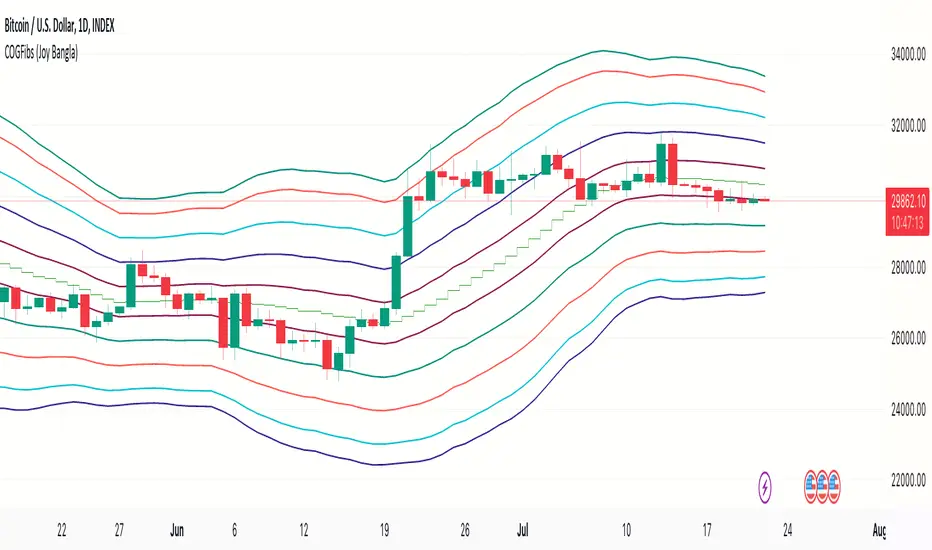
COG Fibs [LazyBear]Made the lines invisible by default. One can see the values by going through settings
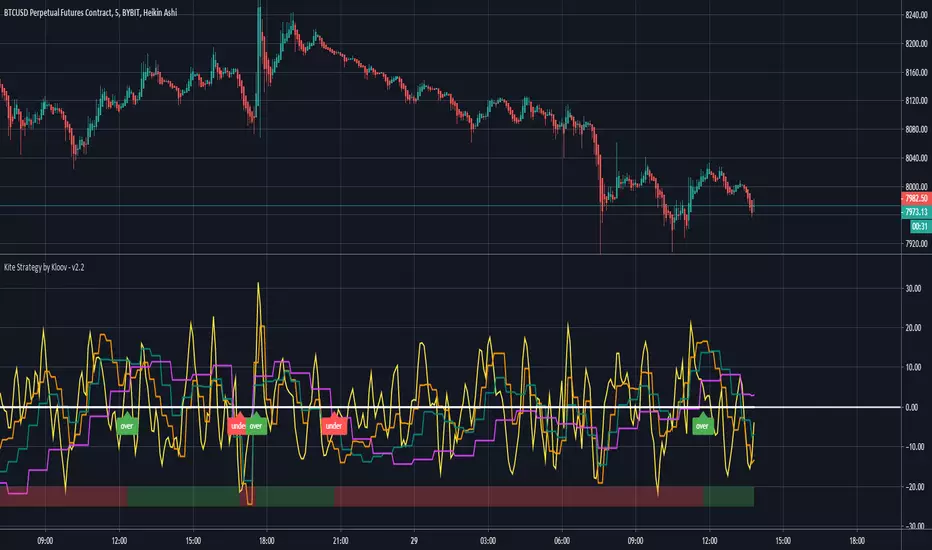
Kite Crossing Oscillator Quick script based on LazyBear's WaveTrend Oscillator , adding multiple time frames to evaluate potential long/short opportunities
WaveTrend + Alert + LSMA + CrossWaveTrend inspired by LazyBear's WT indicator with addition of crossing dots, crossing alert and LSMA
Modified TTM Squeeze Momentum Indicator original @author LazyBear modified by KMcCollum to follow JustinE's input and color scheme for Petra's room
