EMA / WMA RibbonMomentum Flow Ribbon
Unlock a clear, visual edge in identifying short-term momentum shifts with the Momentum Flow Ribbon.
This indicator was born from a simple yet powerful concept: to visually represent the dynamic relationship between a fast-reacting Exponential Moving Average (EMA) and the smoother, more methodical Wilder's Moving Average (WMA). While both moving averages use the same length, their unique calculation methods cause them to separate and cross, creating a "ribbon" that provides an immediate and intuitive gauge of market momentum.
This tool is designed for the disciplined trader who values clean charts and actionable signals, helping you to execute your strategies with greater confidence and precision.
How It Works
The script plots an EMA and a Wilder's Moving Average (referred to as rma in Pine Script) of the same length. The space between these two lines is then filled with a colored ribbon:
Bullish Green/Teal: The ribbon turns bullish when the faster EMA crosses above the slower Wilder's MA, indicating that short-term momentum is strengthening to the upside.
Bearish Red: The ribbon turns bearish when the EMA crosses below the Wilder's MA, signaling that short-term momentum is shifting to the downside.
The inherent "lag" of the Wilder's MA, a feature designed by J. Welles Wilder Jr. himself, acts as a steady baseline against which the more sensitive EMA can be measured. The result is a simple, zero-lag visual that filters out insignificant noise and highlights meaningful changes in trend direction.
Key Features
Customizable Length and Source: Easily adjust the moving average length and price source (close, hl2, etc.) to fit your specific trading style and the instrument you are trading, from futures like MES and MNQ to cryptocurrencies and forex.
Customizable Colors: Tailor the ribbon's bullish and bearish colors to match your personal chart aesthetic.
Built-in Alerts: The script includes pre-configured alerts for both bullish (EMA crosses above WMA) and bearish (EMA crosses below WMA) signals. Never miss a potential momentum shift again.
Clean & Lightweight: No clutter. Just a simple, effective ribbon that integrates seamlessly into any trading system.
Practical Application for the Discerning Trader
For a futures trader, timing is everything. This ribbon is not just another indicator; it's a tool for confirmation.
Imagine you've identified a key level—a Volume Profile POC, the previous day's low, or a critical accumulation zone. As price approaches this level pre-London session, you're watching for a sign of institutional activity. A flip in the ribbon's color at that precise moment can provide the powerful confirmation you need to enter a trade, trusting that you are aligning with the building liquidity and momentum heading into the New York open.
This is a tool for those who aspire to greatness in their trading—who understand that the edge is found not in complexity, but in the flawless execution of a simple, well-defined plan.
Add the Momentum Flow Ribbon to your chart and start seeing momentum in a clearer light.
Buscar en scripts para "Futures"

Open Interest OverlayOpen Interest Overlay
Overview
This indicator displays Open Interest (OI) data directly on your price chart as an overlay, eliminating the need for separate panes while preserving authentic OI movement patterns. Perfect for traders who want to analyze OI correlations without sacrificing chart real estate.
Key Features
📊 Smart Price Scaling
• Automatically maps Open Interest values to fit within your chart's price range
• Preserves all directional movements, timing, and relative magnitude relationships
• Uses official TradingView Open Interest feed for accuracy
🎨 Full Customization
• Custom Colors: Choose your own colors for rising/falling OI (defaults: teal/red)
• Line Style: Toggle between step-line (traditional) or smooth line display
• Optional Fill: Shade area between OI line and mid-price for better visual reference
• Smoothing Options: Apply moving average smoothing to reduce noise
⚙️ Intelligent Settings
• Normalization Window: 300-bar lookback (customizable) for scaling calculations
• Auto Timeframe: Uses daily data for intraday charts on traditional assets, chart timeframe for crypto
• Real Value Display: Shows actual (unscaled) OI value on the last bar
How It Works
The indicator performs proportional mapping of Open Interest data:
1. Calculates OI range (high/low) over the lookback period
2. Maps this range to your chart's price range during the same period
3. Displays OI movements that maintain authentic patterns and timing
Perfect For
✅ Correlation Analysis - See how OI moves with price in real-time
✅ Divergence Spotting - Identify when OI and price trends diverge
✅ Clean Charts - No need for separate panes or window splitting
✅ Pattern Recognition - Spot OI building/declining during key price levels
✅ Cross-Market Analysis - View any symbol's OI overlay on your current chart (e.g., Bitcoin OI while viewing Ethereum prices)
What You Get vs Traditional OI Indicators
Advantages:
• Authentic OI movement patterns preserved
• Direct visual correlation with price action
• No chart real estate sacrifice
• Immediate trend and divergence recognition
Trade-offs:
• Shows relative OI changes rather than absolute values
• Scaling is relative to the selected lookback period
Ideal For
• Day traders monitoring intraday OI flow
• Swing traders analyzing OI trends with price movements
• Futures traders tracking institutional interest
• Anyone wanting clean, correlation-focused OI analysis
Compatible With
• Futures contracts with Open Interest data
• Any timeframe (auto-adjusts for optimal data)
• All TradingView-supported OI symbols

Funding Rate Aggregated (Lite)Funding Rate Aggregated (Lite) provides traders with a consolidated view of perpetual futures funding rates across multiple major exchanges. Instead of monitoring each market individually, the script aggregates the available data into a single, average funding rate series—streamlining analysis and helping identify market-wide positioning imbalances.
The indicator supports Binance, Bybit, OKX, Bitget, and Coinbase, with user-controlled toggles to enable or disable specific venues. For exchanges offering multiple quote currencies (e.g., USDT, USD, or USDC pairs) inclusion is based on whether their trading activity (volume) is relevant (determined manually, not via code). Each available rate is checked and included in the calculation only if valid, ensuring the average reflects actual market conditions.
From a technical standpoint, the script:
Retrieves real-time funding rate data directly via request.security for the current symbol’s base currency.
Applies standard formatting similar to TradingView's official indicator.
Visualizes the average funding rate with color-coded plotting (green for positive, red for negative), alongside a neutral zero reference line.
Why it is useful:
Funding rates are a direct measure of long/short market bias in perpetual swaps. Persistently high positive rates often indicate overcrowded longs, while negative rates can reveal excessive shorting.
By combining multiple exchanges into one metric, traders gain a more robust signal, reducing noise from isolated exchange-specific anomalies.
This aggregated perspective can assist in timing contrarian trades, spotting funding-driven inefficiencies, and gauging overall market sentiment.
Applications in trading include:
Sentiment analysis: Assess whether perpetual futures traders are leaning heavily long or short.
Cross-exchange confirmation: Ensure that extreme funding isn’t confined to a single venue.
Risk management: Identify periods of elevated funding costs that may erode profitability in longer-term positions.
Strategy filters: Integrate the aggregated rate as a condition for entries/exits, or to adjust position sizing during extremes.
The Lite designation emphasizes simplicity and efficiency: the indicator avoids unnecessary visual and data-driven clutter and focuses on delivering one clear, aggregated signal that can be adapted to a wide range of trading styles.

Dynamic Swing Anchored VWAP STRAT (Zeiierman/PineIndicators)Dynamic Swing Anchored VWAP STRATEGY — Zeiierman × PineIndicators (Pine Script v6)
A pivot-to-pivot Anchored VWAP strategy that adapts to volatility, enters long on bullish structure, and closes on bearish structure. Built for TradingView in Pine Script v6.
Full credits to zeiierman.
Repainting notice: The original indicator logic is repainting. Swing labels (HH/HL/LH/LL) are finalized after enough bars have printed, so labels do not occur in real time. It is not possible to execute at historical label points. Treat results as educational and validate with Bar Replay and paper trading before considering any discretionary use.
Concept
The script identifies swing highs/lows over a user-defined lookback ( Swing Period ). When structure flips (most recent swing low is newer than the most recent swing high, or vice versa), a new regime begins.
At each confirmed pivot, a fresh Anchored VWAP segment is started and updated bar-by-bar using an EWMA-style decay on price×volume and volume.
Responsiveness is controlled by Adaptive Price Tracking (APT) . Optionally, APT auto-adjusts with an ATR ratio so that high volatility accelerates responsiveness and low volatility smooths it.
Longs are opened/held in bullish regimes and closed when the regime turns bearish. No short positions are taken by design.
How it works (under the hood)
Swing detection: Uses ta.highestbars / ta.lowestbars over prd to update swing highs (ph) and lows (pl), plus their bar indices (phL, plL).
Regime logic: If phL > plL → bullish regime; else → bearish regime. A change in this condition triggers a re-anchor of the VWAP at the newest pivot.
Adaptive VWAP math: APT is converted to an exponential decay factor ( alphaFromAPT ), then applied to running sums of price×volume and volume, producing the current VWAP estimate.
Rendering: Each pivot-anchored VWAP segment is drawn as a polyline and color-coded by regime. Optional structure labels (HH/HL/LH/LL) annotate the swing character.
Orders: On bullish flips, strategy.entry("L") opens/maintains a long; on bearish flips, strategy.close("L") exits.
Inputs & controls
Swing Period (prd) — Higher values identify larger, slower swings; lower values catch more frequent pivots but add noise.
Adaptive Price Tracking (APT) — Governs the VWAP’s “half-life.” Smaller APT → faster/closer to price; larger APT → smoother/stabler.
Adapt APT by ATR ratio — When enabled, APT scales with volatility so the VWAP speeds up in turbulent markets and slows down in quiet markets.
Volatility Bias — Tunes the strength of APT’s response to volatility (above 1 = stronger effect; below 1 = milder).
Style settings — Colors for swing labels and VWAP segments, plus line width for visibility.
Trade logic summary
Entry: Long when the swing structure turns bullish (latest swing low is more recent than the last swing high).
Exit: Close the long when structure turns bearish.
Position size: qty = strategy.equity / close × 5 (dynamic sizing; scales with account equity and instrument price). Consider reducing the multiplier for a more conservative profile.
Recommended workflow
Apply to instruments with reliable volume (equities, futures, crypto; FX tick volume can work but varies by broker).
Start on your preferred timeframe. Intraday often benefits from smaller APT (more reactive); higher timeframes may prefer larger APT (smoother).
Begin with defaults ( prd=50, APT=20 ); then toggle “Adapt by ATR” and vary Volatility Bias to observe how segments tighten/loosen.
Use Bar Replay to watch how pivots confirm and how the strategy re-anchors VWAP at those confirmations.
Layer your own risk rules (stops/targets, max position cap, session filters) before any discretionary use.
Practical tips
Context filter: Consider combining with a higher-timeframe bias (e.g., daily trend) and using this strategy as an entry timing layer.
First pivot preference: Some traders prefer only the first bullish pivot after a bearish regime (and vice versa) to reduce whipsaw in choppy ranges.
Deviations: You can add VWAP deviation bands to pre-plan partial exits or re-entries on mean-reversion pulls.
Sessions: Session-based filters (RTH vs. ETH) can materially change behavior on futures and equities.
Extending the script (ideas)
Add stops/targets (e.g., ATR stop below last swing low; partial profits at k×VWAP deviation).
Introduce mirrored short logic for two-sided testing.
Include alert conditions for regime flips or for price-VWAP interactions.
Incorporate HTF confirmation (e.g., only long when daily VWAP slope ≥ 0).
Throttle entries (e.g., once per regime flip) to avoid over-trading in ranges.
Known limitations
Repainting: Swing labels and pivot confirmations depend on future bars; historical labels can look “perfect.” Treat them as annotations, not executable signals.
Execution realism: Strategy includes commission and slippage fields, yet actual fills differ by venue/liquidity.
No guarantees: Past behavior does not imply future results. This publication is for research/education only and not financial advice.
Defaults (backtest environment)
Initial capital: 10,000
Commission value: 0.01
Slippage: 1
Overlay: true
Max bars back: 5000; Max labels/polylines set for deep swing histories
Quick checklist
Add to chart and verify that the instrument has volume.
Use defaults, then tune APT and Volatility Bias with/without ATR adaptation.
Observe how each pivot re-anchors VWAP and how regime flips drive entries/exits.
Paper trade across several symbols/timeframes before any discretionary decisions.
Attribution & license
Original indicator concept and logic: Zeiierman — please credit the author.
Strategy wrapper and publication: PineIndicators .
License: CC BY-NC-SA 4.0 (Attribution-NonCommercial-ShareAlike). Respect the license when forking or publishing derivatives.

Cumulative Volume Delta Candles Aggregated (Lite)Cumulative Volume Delta Candles Aggregated (Lite)
Multi-Exchange CVD Visualization in Candle Format
This indicator provides an aggregated Cumulative Volume Delta (CVD) view across multiple major perpetual futures exchanges in one chart. It is designed for traders who want a broader perspective on buying and selling pressure without switching between multiple charts or relying on a single exchange feed.
What It Does
Combines volume delta data from Binance, Bybit, OKX, Bitget, and Coinbase into a unified representation.
Displays CVD as candlesticks, where each candle reflects the open, high, low, and close of cumulative delta for the selected period.
Offers a clear visual of how buying and selling pressure evolves across markets in a structured, familiar candle format.
Key Features
✔ Exchange Aggregation: Incorporates data from several top futures markets available on TradingView.
✔ Anchor Reset: Allows you to set an anchor timeframe (e.g., daily) to reset cumulative values for better readability and analysis.
✔ Unit Normalization: Since exchanges report volumes in different units, the indicator normalizes all data and outputs values denominated in the base currency (coins) for consistency.
✔ Hidden OHLC Outputs: Provides open, high, low, and close values as hidden plots for use with other indicators or strategies.
✔ Lightweight Design: Optimized for efficiency while handling multiple real-time data requests.
Why It’s Different
Unlike standard single-exchange CVD tools, this indicator aggregates the majority of perpetual volume data available on TradingView, offering a more representative view of market sentiment. The candle-based representation of CVD introduces an additional layer of structure, helping traders identify shifts in momentum and pressure with more context than a simple cumulative line.
Use Cases
- Spotting aggregated buy/sell pressure trends across multiple exchanges.
- Confirming breakout or reversal signals with broader volume delta context.
- Serving as a custom data source for other indicators or algorithmic strategies.

ForecastForecast (FC), indicator documentation
Type: Study, not a strategy
Primary timeframe: 1D chart, most plots and the on-chart table only render on daily bars
Inspiration: Robert Carver’s “forecast” concept from Advanced Futures Trading Strategies, using normalized, capped signals for comparability across markets
⸻
What the indicator does
FC builds a volatility-normalized momentum forecast for a chosen symbol, optionally versus a benchmark. It combines an EWMAC composite with a channel breakout composite, then caps the result to a common scale. You can run it in three data modes:
• Absolute: Forecast of the selected symbol
• Relative: Forecast of the ratio symbol / benchmark
• Combined: Average of Absolute and Relative
A compact table can summarize the current forecast, short-term direction on the forecast EMAs, correlation versus the benchmark, and ATR-scaled distances to common price EMAs.
⸻
PineScreener, relative-strength screening
This indicator is excellent for screening on relative strength in PineScreener, since the forecast is volatility-normalized and capped on a common scale.
Available PineScreener columns
PineScreener reads the plotted series. You will see at least these columns:
• FC, the capped forecast
• from EMA20, (price − EMA20) / ATR in ATR multiples
• from EMA50, (price − EMA50) / ATR in ATR multiples
• ATR, ATR as a percent of price
• Corr, weekly correlation with the chosen benchmark
Relative mode and Combined mode are recommended for cross-sectional screens. In Relative mode the calculation uses symbol / benchmark, so ensure the ratio ticker exists for your data source.
⸻
How it works, step by step
1. Volatility model
Compute exponentially weighted mean and variance of daily percent returns on D, annualize, optionally blend with a long lookback using 10y %, then convert to a price-scaled sigma.
2. EWMAC momentum, three legs
Daily legs: EMA(8) − EMA(32), EMA(16) − EMA(64), EMA(32) − EMA(128).
Divide by price-scaled sigma, multiply by leg scalars, cap to Cap = 20, average, then apply a small FDM factor.
3. Breakout momentum, three channels
Smoothed position inside 40, 80, and 160 day channels, each scaled, then averaged.
4. Composite forecast
Average the EWMAC composite and the breakout composite, then cap to ±20.
Relative mode runs the same logic on symbol / benchmark.
Combined mode averages Absolute and Relative composites.
5. Weekly correlation
Pearson correlation between weekly closes of the asset and the benchmark over a user-set length.
6. Direction overlay
Two EMAs on the forecast series plus optional green or red background by sign, and optional horizontal level shading around 0, ±5, ±10, ±15, ±20.
⸻
Plots
• FC, capped forecast on the daily chart
• 8-32 Abs, 8-32 Rel, single-leg EWMAC plus breakout view
• 8-32-128 Abs, 8-32-128 Rel, three-leg composite views
• from EMA20, from EMA50, (price − EMA) / ATR
• ATR, ATR as a percent of price
• Corr, weekly correlation with the benchmark
• Forecast EMA1 and EMA2, EMAs of the forecast with an optional fill
• Backgrounds and guide lines, optional sign-based background, optional 0, ±5, ±10, ±15, ±20 guides
Most plots and the table are gated by timeframe.isdaily. Set the chart to 1D to see them.
⸻
Inputs
Symbol selection
• Absolute, Relative, Combined
• Vs. benchmark for Relative mode and correlation, choices: SPY, QQQ, XLE, GLD
• Ticker or Freeform, for Freeform use full TradingView notation, for example NASDAQ:AAPL
Engine selection
• Include:
• 8-32-128, three EWMAC legs plus three breakouts
• 8-32, simplified view based on the 8-32 leg plus a 40-day breakout
EMA, applied to the forecast
• EMA1, EMA2, with line-width controls, plus color and opacity
Volatility
• Span, EW volatility span for daily returns
• 10y %, blend of long-run volatility
• Thresh, Too volatile, placeholders in this version
Background
• Horizontal bg, level shading, enabled by default
• Long BG, Hedge BG, colors and opacities
Show
• Table, Header, Direction, Gain, Extension
• Corr, Length for correlation row
Table settings
• Position, background, opacity, text size, text color
Lines
• 0-lines, 10-lines, 5-lines, level guides
⸻
Reading the outputs
• Forecast > 0, bullish tilt; Forecast < 0, bearish or hedge tilt
• ±10 and ±20 indicate strength on a uniform scale
• EMA1 vs EMA2 on the forecast, EMA1 above EMA2 suggests improving momentum
• Table rows, label colored by sign, current forecast value plus a green or red dot for the forecast EMA cross, optional daily return percent, weekly correlation, and ATR-scaled EMA9, EMA20, EMA50 distances
⸻
Data handling, repainting, and performance
• Daily and weekly series are fetched with request.security().
• Calculations use closed bars, values can update until the bar closes.
• No lookahead, historical values do not repaint.
• Weekly correlation updates during the week, it finalizes on weekly close.
• On intraday charts most visuals are hidden by design.
⸻
Good practice and limitations
• This is a research indicator, not a trading system.
• The fixed Cap = 20 keeps a common scale, extreme moves will be clipped.
• Relative mode depends on the ratio symbol / benchmark, ensure both legs have data for your feed.
⸻
Credits
Concept inspired by Robert Carver’s forecast methodology in Advanced Futures Trading Strategies. Implementation details, parameters, and visuals are specific to this script.
⸻
Changelog
• First version
⸻
Disclaimer
For education and research only, not financial advice. Always test on your market and data feed, consider costs and slippage before using any indicator in live decisions.

BTC CME Gap – detector & single signals# BTC CME Gap — Detector & Single Signals (Pine v5)
**What it does**
This indicator finds the **weekend gap** on **CME Bitcoin futures** and turns it into a clean, tradable object:
* Draws a **gap zone** (Friday close ↔ Monday open) as a right-extending box.
* Fires **one-time signals** per gap:
* **ENTER** – first touch of the gap zone by price.
* **FILL** – gap is considered filled when price tags **Friday’s close**.
It works on any BTC chart (spot or futures). The gap itself is calculated from **CME\:BTC1!** daily data.
---
## How it works
1. Pulls **daily** `open`/`close` from `CME:BTC1!` (`request.security`, no lookahead).
2. On **Monday**, compares Monday **open** with previous **Friday close**:
* If different → a **gap** exists.
3. Defines the zone:
* `gapTop = max(MonOpen, FriClose)`
* `gapBot = min(MonOpen, FriClose)`
4. Renders a box + boundary lines, **extending right** until price action resolves it.
5. Signals:
* **ENTER**: the first bar that **enters** the gap zone.
* **FILL**: first bar that **touches Friday close** (gap completion).
6. Each new Monday gap **replaces** the previous box and signals.
---
## Inputs
* **CME symbol** (default `CME:BTC1!`)
* **Gap timeframe** (default `D`)
* **Colors** for the box and edges
---
## Plot & Signals
* **Box** = visual gap zone (transparent fill, outlined).
* **ENTER** = triangle up below bar.
* **FILL** = triangle down above bar.
* Optional label prints **Top / Bottom / Fill** levels.
---
## Notes on behavior
* Uses `barmerge.lookahead_off` and daily aggregation, so the gap definition **does not repaint** once Monday’s daily bar is confirmed.
* Signals are **single-shot** per gap (no clutter).
* Works on any chart timeframe; the gap logic always references **CME daily**.
---
## Practical use
* Track obvious **“magnets”** for mean-reversion, stop-runs, or liquidity grabs.
* Combine with your higher-timeframe bias (e.g., **1D trend filter**) and execution on **4H/1H**.
* Typical outcomes: quick Monday fill, staged fill after partial rejection, or delayed fill during later consolidation.
---
## Customization ideas
* Add `alertcondition(enterSignal, …)` / `alertcondition(fillSignal, …)` for automation.
* Gate trades with trend filters (EMA/SMA, Kernel regression, ADX) or session tools (VWAP/POC).
* Persist multiple historical gap boxes if you want to track **unfilled** gaps.
---
**Credits**: Built for BTC CME weekend gaps; minimal, publication-ready visualization with single-event signals to keep charts clean.

Scalping Line Strategy📌 Scalping Line Strategy – A Precision Crossover System
🔎 Overview
The Scalping Line Strategy is a short-term trading system built around the concept of momentum-driven crossovers between a smoothed moving average filter and a fast signal line. It is designed for scalpers and intraday traders who seek clear entry signals, minimal lag, and adaptive filtering to fit volatile market conditions.
At its core, the strategy uses a custom signal line ("Scalping Line"), which is derived from the difference between a double-smoothed moving average and a shorter-period signal line. Trade entries are triggered when this Scalping Line crosses above or below zero, providing a clean and rules-based framework for both long and short setups.
⚙️ Core Logic
Main Trend Filter – A double-smoothed moving average is calculated over a configurable period (default 100). This reduces noise and provides a more robust backbone for scalping signals.
Percent-Based Filter – To avoid false signals, a customizable percentage filter adjusts how closely the system “respects” price deviations from the moving average. This helps filter out insignificant fluctuations.
Signal Line – A shorter-period simple moving average (default 7) provides faster responsiveness to recent price action.
Scalping Line (SLI) – Calculated as the difference between the fast signal line and the smoothed moving average. When the SLI crosses zero, it signals a potential momentum shift.
SLI > 0 → Momentum bias is bullish.
SLI < 0 → Momentum bias is bearish.
🎯 Trade Direction & Flexibility
Trade Direction Control:
Choose between Long Only, Short Only, or Both to tailor the system to your trading style.
Signal Flip Option:
By default, long entries occur when the SLI crosses below zero, and shorts when it crosses above zero. This orientation can be flipped, allowing for alternative interpretations of the signals depending on how you want to capture momentum in your market.
🕒 Time Window Filtering
For intraday traders, a time filter can be enabled to restrict signals to specific trading sessions (e.g., 9 AM – 4 PM EST). This is particularly useful when trading assets such as equities or futures that have strong intraday volatility windows.
📈 Visuals & Clarity
Scalping Line Plot: Displayed as a dynamic oscillator around a zero baseline.
Histogram Fill: Green when above zero (bullish bias), red when below zero (bearish bias).
Signal Markers: Clear arrows mark long and short entries at crossover points.
Zero Line Reference: A flat gray line at zero assists in visually gauging momentum shifts.
🚀 Strategy Execution
Long Entry: Triggered when SLI crosses below zero (or above zero if flip is enabled) within allowed session hours.
Short Entry: Triggered when SLI crosses above zero (or below zero if flip is enabled) within allowed session hours.
Built-in Signal Cancels: Pending entries are canceled if conditions are no longer valid, ensuring no stale trades remain active.
✅ Best Use Cases
Markets: Works across equities, forex, crypto, and futures with sufficient intraday volatility.
Timeframes: Most effective on 1m to 15m charts for scalping setups, but adaptable to higher frames for swing trading.
Style: Traders who appreciate simple, rules-based momentum crossovers will find this system easy to follow and highly adaptable.
⚠️ Risk Management Note
This strategy is strictly an entry signal framework. Position sizing, stop-loss, and take-profit rules must be overlaid based on your risk management style. Always validate results with backtesting and forward testing before applying to live trading accounts.
📜 Final Thoughts
The Scalping Line Strategy offers a refined, easy-to-interpret approach to intraday trading. By combining smoothed moving averages, adaptive filtering, and flexible signal options, it helps traders identify short-term momentum shifts with clarity and confidence, making it a highly configurable tool for scalping-focused strategies.

RTH Levels: VWAP + PDH/PDL + ONH/ONL + IBAlgo Index — Levels Pro (ONH/ONL • PDH/PDL • VWAP±Bands • IB • Gaps)
Purpose. A session-aware, non-repainting levels tool for intraday decision-making. Designed for futures and indices, with clean visuals, alerts, and a one-click Minimal Mode for screenshot-ready charts.
What it plots
• PDH/PDL (RTH-only) – Prior Regular Trading Hours high/low, computed intraday and frozen at the RTH close (no 24h mix-ups, no repainting).
• ONH/ONL – Prior Overnight high/low, held throughout RTH.
• RTH VWAP with ±σ bands – Volume-weighted variance, reset each RTH.
• Initial Balance (IB) – First N minutes of RTH, plus 1.5× / 2.0× extensions after IB completes.
• Today’s RTH Open & Prior RTH Close – With gap detection and “gap filled” alert.
• Killzone shading – NY Open (09:30–10:30 ET) and Lunch (11:15–13:30 ET).
• Values panel (top-right) – Each level with live distance in points & ticks.
• Right-edge level tags – With anti-overlap (stagger + vertical jitter).
• Price-scale tags – Native trackprice markers that always “stick” to the axis.
⸻
New in v6.4
• Minimal Mode: one click for a clean look (thinner lines, VWAP bands/IB extensions hidden, on-chart right-edge labels off; price-scale tags remain).
• Theme presets: Dark Hi-Contrast / Light Minimal / Futures Classic / Muted Dark.
• Anti-overlap controls: horizontal staggering, vertical jitter, and baseline offset to keep tags readable even when levels cluster.
⸻
Quick start (2 minutes)
1. Add to chart → keep defaults.
2. Sessions (ET):
• RTH Session default: 09:30–16:00 (US equities cash hours).
• Overnight Session default: 18:00–09:29.
Adjust for your market if you use different “day” hours (e.g., many use 08:20–13:30 ET for COMEX Gold).
3. Theme & Minimal Mode: pick a Theme Preset; enable Minimal Mode for screenshots.
4. Visibility: toggle PD/ON/VWAP/IB/References/Panel to taste.
5. Right-edge labels: turn Show Right-Edge Labels on. If they crowd, tune:
• Anti-overlap: min separation (ticks)
• Horizontal offset per tag (bars)
• Vertical jitter per step (ticks)
• Right-edge baseline offset (bars)
6. Alerts: open Add alert → Condition: and pick the events you want.
⸻
How levels are computed (no repainting)
• PDH/PDL: Intraday H/L are accumulated only while in RTH and saved at RTH close for “yesterday’s” values.
• ONH/ONL: Accumulated across the defined Overnight window and then held during RTH.
• RTH VWAP & ±σ: Volume-weighted mean and standard deviation, reset at the RTH open.
• IB: First N minutes of RTH (default 60). Extensions (1.5×/2.0×) appear after IB completes.
• Gaps: Today’s RTH open vs prior RTH close; “Gap Filled” triggers when price trades back to prior close.
⸻
Practical playbooks (how to trade around the levels)
1) PDH/PDL interactions
• Rejection: Price taps PDH/PDL then closes back inside → mean-reversion toward VWAP/IB.
• Acceptance: Close/hold beyond PDH/PDL with momentum → continuation to next HTF/IB target.
• Alert: PD Touch/Break.
2) ONH/ONL “taken”
• Often one ON extreme is taken during RTH. ONH Taken / ONL Taken → check if it’s a clean break or sweep & reclaim.
• Sweep + reclaim near VWAP can fuel rotations through the ON range.
3) VWAP ±σ framework
• Balanced: First tag of ±1σ often reverts toward VWAP.
• Trend: Persistent trade beyond ±1σ + IB break → target ±2σ/±3σ.
• Alerts: VWAP Cross and VWAP Reject (cross then immediate fail back).
4) IB breaks
• After IB completes, a clean IB break commonly targets 1.5× and sometimes 2.0×.
• Quick return inside IB = possible fade back to the opposite IB edge/VWAP.
• Alerts: IB Break Up / Down.
5) Gaps
• Gap-and-go: Opening drive away from prior close + VWAP support → trend until IB completion.
• Gap-fill: Weak open and VWAP overhead/underfoot → trade toward prior close; manage on Gap Filled alert.
Pro tip: Stack confluences (e.g., ONL sweep + VWAP reclaim + IB hold) and respect your execution rules (e.g., require a 5-minute close in direction, or your order-flow confirmation).
⸻
Inputs you’ll actually touch
• Sessions (ET): Session Timezone, RTH Session, Overnight Session.
• Visibility: toggles for PD/ON/VWAP/IB/Ref/Panel.
• VWAP bands: set σ multipliers (±1/±2/±3).
• IB: duration (minutes) and extension multipliers (1.5× / 2.0×).
• Style & Theme: Theme Preset, Main Line Width, Trackprice, Minimal Mode, and anti-overlap controls.
⸻
Alerts included
• PD Touch/Break — High ≥ PDH or Low ≤ PDL
• ONH Taken / ONL Taken — First in-RTH take of ONH/ONL
• VWAP Cross — Close crosses VWAP
• VWAP Reject — Cross then immediate fail back
• IB Break Up / Down — Break of IB High/Low after IB completes
• Gap Filled — Price trades back to prior RTH close
Setup: Add alert → Condition: Algo Index — Levels Pro → choose event → message → Notify on app/email.
⸻
Panel guide
The top-right panel shows each level plus live distance from last price:
LevelValue (Δpoints | Δticks)
Coloring: green if level is below current price, red if above.
⸻
Styling & screenshot tips
• Use Theme Preset that matches your chart.
• For dark charts, “Dark Hi-Contrast” with Main Line Width = 3 works well.
• Enable Trackprice for crisp axis tags that always stick to the right edge.
• Turn on Minimal Mode for cleaner screenshots (no VWAP bands or IB extensions, on-chart tags off; price-scale tags remain).
• If tags crowd, increase min separation (ticks) to 30–60 and horizontal offset to 3–5; add vertical jitter (4–12 ticks) and/or push tags farther right with baseline offset (bars).
⸻
Behavior & limitations
• Levels are computed incrementally; tables refresh on the last bar for efficiency.
• Right-edge labels are placed at bar_index + offset and do not track extra right-margin scrolling (TradingView limitation). The price-scale tags (from trackprice) do track the axis.
• “RTH” is what you define in inputs. If your market uses different day hours, change the session strings so PDH/PDL reflect your definition of “yesterday’s session.”
⸻
FAQ
Q: My PDH/PDL don’t match the daily chart.
A: By design this uses RTH-only highs/lows, not 24h daily bars. Adjust sessions if you want a different definition.
Q: Right-edge tags overlap or don’t sit at the far right.
A: Increase min separation / horizontal offset / vertical jitter and/or push tags farther with baseline offset. If you want markers that always hug the axis, rely on Trackprice.
Q: Can I change killzones?
A: Yes—edit the session strings in settings or request a version with user inputs for custom windows.
⸻
Disclaimer
Educational use only. This is not financial advice. Always apply your own risk management and confirmation rules.
⸻
Enjoy it? Please ⭐ the script and share screenshots using Minimal Mode + a Theme Preset that fits your style.

FVG + Bank Level Targeting w/ Alert TriggerDescription:
FVG + Bank Level Targeting w/ Alert Trigger is an intraday trading tool that combines Fair Value Gap (FVG) detection with dynamic institutional targeting using prior-day, weekly, and monthly high/low "Bank Levels." When a Fair Value Gap is detected, the script projects a logical target using the closest bank level in price's direction, and visually extends that level on your chart.
This tool is designed to help traders anticipate where price is most likely to move after an FVG appears — and alert them when price breaks through key target zones.
How It Works:
* Bank Level Calculation:
The indicator calculates Daily, Weekly, and Monthly high and low levels from the previous bar of each respective timeframe.
These are optionally plotted on the chart with a slight tick offset to avoid overlap with price.
* FVG Detection:
Bullish FVGs are defined by a gap between the low of the current candle and the high two candles prior, with a confirming middle candle.
Bearish FVGs follow the reverse pattern.
Once detected, the script finds the nearest unbroken institutional level (Bank Level) in the direction of the FVG and anchors a target line at that price level.
* Target Line Projection:
The script draws a persistent horizontal line (not just a plotted value) at the selected bank level.
These lines automatically extend a set number of bars into the future for clarity and trade planning.
* Breakout Detection:
When price crosses above a Bull Target or below a Bear Target, the script triggers a breakout condition.
These breakouts are useful for trade continuation or reversal setups.
* Alerts:
Built-in alert conditions notify you in real time when price crosses above or below a target.
These can be used to set TradingView alerts for your preferred Futures symbols or intraday pairs.
Parameters:
Tick Offset Multiplier: Adds distance between price and plotted levels.
Show Daily/Weekly/Monthly Levels: Toggle for each institutional level group.
FVG Extend Right (bars): Controls how far the target lines extend into the future.
Color Controls: Customize colors for FVG fill and target lines.
Use Case:
This indicator is designed for traders who want to:
Trade continuation or reversal moves around institutional price zones
Integrate Fair Value Gap concepts with more logical, historically anchored price targets
Trigger alerts when market structure evolves around key levels
It is especially useful for intraday Futures traders on the 15-minute chart or lower, but adapts well to any instrument with strong reactionary behavior at prior session highs/lows.

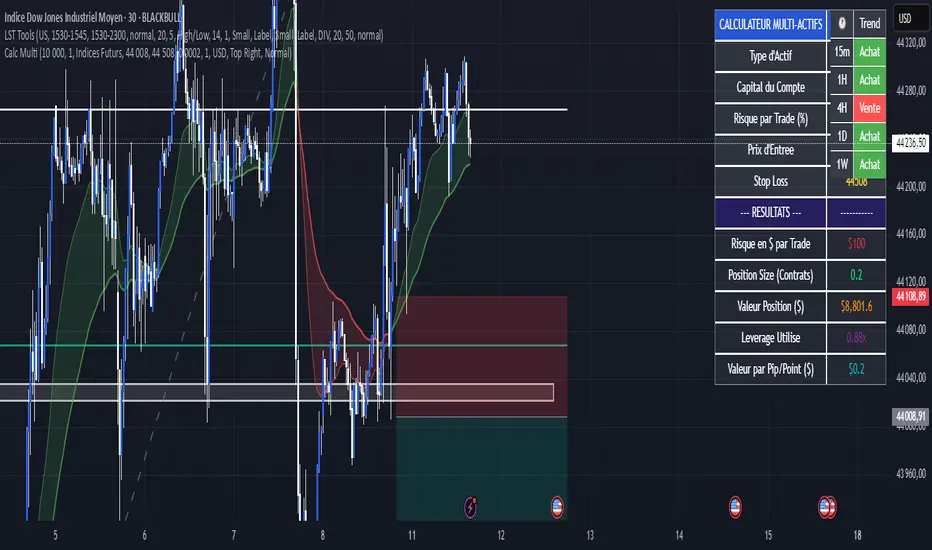
Calculateur Position Size Multi-ActifsThe Multi-Asset Position Size Calculator v6 is a fully customizable Pine Script indicator designed to help you determine the optimal position size based on your risk tolerance across any market: Forex, stocks, crypto, futures indices, or commodities. Features include:
Asset Type Selector: Choose between Forex, Stocks, Crypto, Futures Indices, or Commodities
Account Capital & Risk: Set your total account size and risk percentage per trade
Entry Price & Stop-Loss: Configure your entry and stop-loss levels directly
Automatic or Custom Pip/Point Value: Automatically calculates pip/point value by asset class or enter your own
Contract Size Adjustment: Define contract sizes (e.g., 100,000 units for Forex, 1 for stocks/crypto)
Margin & Leverage Display: View your used leverage and position value in real time
Risk Alerts: Warnings for invalid inputs, high leverage (>10×), and asset-specific risk settings (e.g., crypto leverage)
Integrated Table Interface: On-chart table with adjustable position and text size
Optional Price Level Drawing: Display entry and stop-loss lines on the chart
Trade any market confidently with precise, asset-tailored position sizing and risk management.
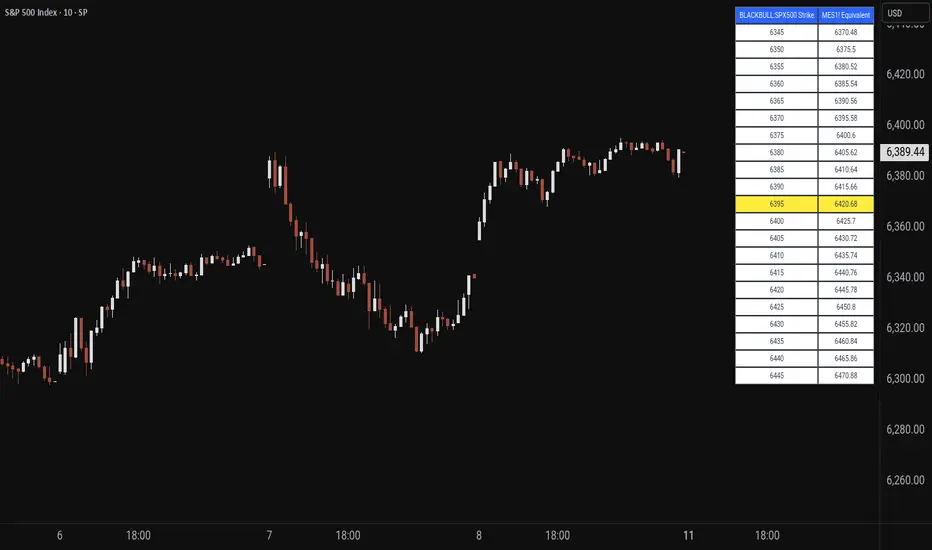
Price MapperPrice Mapper is a dynamic trading tool designed to map strike prices between two related financial instruments using real-time ratio calculations. The indicator displays a customizable table showing strike levels for your primary ticker alongside their equivalent mapped prices for a secondary instrument, making it invaluable for cross-market analysis, pairs trading, and hedging strategies. Whether you're comparing an ETF to its underlying futures, analyzing currency pairs, or exploring relationships between correlated assets, Price Mapper provides instant visual mapping of how price movements in one instrument translate to equivalent levels in another. The ratio calculation updates daily using 12:00 PM New York time closing prices, ensuring consistent reference points while maintaining relevance to current market conditions.
The tool automatically centers around the current market price and allows complete customization of display parameters including strike increments, number of price levels, decimal precision, and table positioning. Advanced color customization options let you highlight the current price level and adjust the appearance to match your trading setup. Price Mapper eliminates the mental math typically required when trading related instruments, instantly showing you equivalent entry and exit levels across different markets. This makes it particularly powerful for options traders working with ETFs and futures, forex traders analyzing currency correlations, or any trader looking to understand precise price relationships between connected financial instruments.
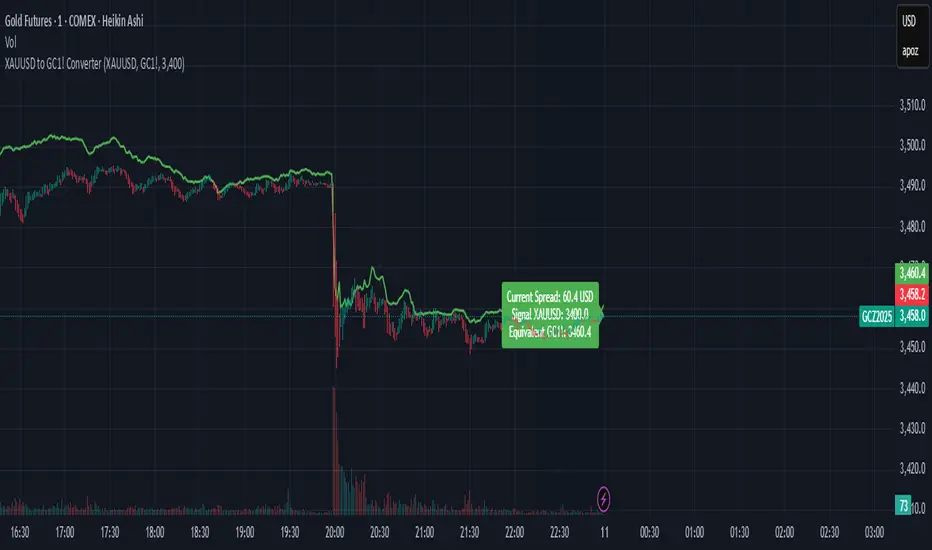
XAUUSD to GC1! ConverterThis simple utility indicator compares the spot gold price (XAUUSD) with the COMEX gold futures contract (GC1!).
It calculates the current spread between the two instruments and allows you to input a signal price on XAUUSD to instantly see the equivalent price on GC1!.
Perfect for traders who receive alerts on spot gold but execute on futures, ensuring seamless price adaptation.
GLD GC Price Converter Its primary function is to fetch the prices of the Gold ETF (ticker: GLD) and Gold Futures (ticker: GC1!) and then project significant price levels from one or both of these assets onto the chart of whatever instrument you are currently viewing.
Core Functionality & Features
Dual Asset Tracking: The script simultaneously tracks the prices of GLD and Gold Futures (GC).
Dynamic Price Level Projection: The script's main feature is its ability to calculate and draw horizontal price levels. It determines a "base price" (e.g., the nearest $100 level for GC) and then draws lines at specified increments above and below it. The key is that these levels are projected onto the current chart's price scale.
On-Chart Information Display:
Price Table: A customizable table can be displayed in any corner of the chart, showing the current prices of GLD and GC. It can also show the daily percentage change for GC, colored green for positive changes and red for negative ones.
Last Price Label: It can show a label next to the most recent price bar that displays the current prices of both GLD and GC.
Extensive Customization: The user has significant control over the indicator's appearance and behavior through the settings panel.
This includes:
Toggling the display for GLD and GC levels independently.
Adjusting the multiplier for the price levels (e.g., show levels every $100 or $50 for GC).
Changing the colors, line styles (solid, dashed, dotted), and horizontal offset for the labels.
Defining the number of price levels to display.
Controlling the text size for labels and the table.
Choosing whether the script updates on every tick or only once per candle close for better performance.

ATR+CCI Monetary Risk Tool - TP/SL⚙️ ATR+CCI Monetary Risk Tool — Volatility-aware TP/SL & Position Sizing
Exact prices (no rounding), ATR-percentile dynamic stops, and risk-budget sizing for consistent execution.
🧠 What this indicator is
A risk-first planning tool. It doesn’t generate orders; it gives you clean, objective levels (Entry, SL, TP) and position size derived from your risk budget. It shows only the latest setup to keep charts readable, and a compact on-chart table summarizing the numbers you actually act on.
✨ What makes it different
Dynamic SL by regime (ATR percentile): Instead of a fixed multiple, the SL multiplier adapts to the current volatility percentile (low / medium / high). That helps avoid tight stops in noisy markets and over-wide stops in quiet markets.
Risk budgeting, not guesswork: Size is computed from Account Balance × Max Risk % divided by SL distance × point value. You risk the same dollars across assets/timeframes.
Precision that matches your instrument: Entry, TP, SL, and SL Distance are displayed as exact prices (no rounding), truncated to syminfo.mintick so they align with broker/exchange precision.
Symbol-aware point value: Uses syminfo.pointvalue so you don’t maintain tick tables.
Non-repaint option: Work from closed bars to keep the plan stable.
🔧 How to use (quick start)
Add to chart and pick your timeframe and symbol.
In settings:
Set Account Balance (USD) and Max Risk per Trade (%).
Choose R:R (1:1 … 1:5).
Pick ATR Period and CCI Period (defaults are sensible).
Keep Dynamic ATR ON to adapt SL by regime.
Keep Use closed-bar values ON to avoid repaint when planning.
Read the labels (Entry/TP/SL) and the table (SL Distance, Position Size, Max USD Risk, ATR Percentile, effective SL Mult).
Combine with your entry trigger (price action, levels, momentum, etc.). This indicator handles risk & targets.
📐 How levels are computed
Bias: CCI ≥ 0 ⇒ long, otherwise short.
ATR Percentile: Percent rank of ATR(atrPeriod) over a lookback window.
Effective SL Mult:
If percentile < Low threshold ⇒ use Low SL Mult (tighter).
If between thresholds ⇒ use Base SL Mult.
If percentile > High threshold ⇒ use High SL Mult (wider).
Stop-Loss: SL = Entry ± ATR × SL_Mult (minus for long, plus for short).
Take-Profit: TP = Entry ± (Entry − SL) × R (R from the R:R dropdown).
Position Size:
USD Risk = Balance × Risk%
Contracts = USD Risk ÷ (|Entry − SL| × PointValue)
For futures, quantity is floored to whole contracts.
Exact prices: Entry/TP/SL and SL Distance are not rounded; they’re truncated to mintick so what you see matches valid price increments.
📊 What you’ll see on chart
Latest Entry (blue), TP (green), SL (red) with labels (optional emojis: ➡️ 🎯 🛑).
Info Table with:
Bias, Entry, TP, SL (exact, truncated to mintick)
SL Distance (exact, truncated)
Position Size (contracts/units)
Max USD Risk
Point Value
ATR Percentile and effective SL Mult
🧪 Practical examples
High-volatility session (e.g., XAUUSD, 1H): ATR percentile is high ⇒ wider SL, smaller size. Reduces churn from normal noise during macro events.
Range-bound market (e.g., EURUSD, 4H): ATR percentile low ⇒ tighter SL, better R:R. Helps you avoid carrying unnecessary risk.
Index swing planning (e.g., ES1!, Daily): Non-repaint levels + risk budgeting = consistent sizing across days/weeks, easier to review and journal.
🧭 Why traders should use it
Consistency: Same dollar risk regardless of instrument or volatility regime.
Clarity: One-trade view forces focus; you see the numbers that matter.
Adaptivity: Stops calibrated to the market’s current behavior, not last month’s.
Discipline: A visible checklist (SL distance, size, USD risk) before you hit buy/sell.
🔧 Input guide (practical defaults)
CCI Period: 100 by default; use as a bias filter, not an entry signal.
ATR Period: 14 by default; raise for smoother, lower for more reactive.
ATR Percentile Lookback: 200 by default (stable regime detection).
Percentile thresholds: 33/66 by default; widen the gap to change how often regimes switch.
SL Mults: Start ~1.5 / 2.0 / 2.5 (low/base/high). Tune by asset.
Risk % per trade: Common pro ranges are 0.25–1.0%; adjust to your risk tolerance.
R:R: Start with 1:2 or 1:3 for balanced skew; adapt to strategy edge.
Closed-bar values: Keep ON for planning/live; turn OFF only for exploration.
💡 Best practices
Combine with your entry logic (structure, momentum, liquidity levels).
Review ATR percentile and effective SL Mult across sessions so you understand regime shifts.
For futures, remember size is floored to whole contracts—safer by design.
Journal trades with the table snapshot to improve risk discipline over time.
⚠️ Notes & limitations
This is not a strategy; it does not place orders or alerts.
No slippage/commissions modeled here; build a strategy() version for backtests that mirror your broker/exchange.
Displayed non-price metrics use two decimals; prices and SL Distance are exact (truncated to mintick).
📎 Disclaimer
For educational purposes only. Not financial advice. Markets involve risk. Test thoroughly before trading live.

Cumulative Volume Delta (SB-1) 2.0
📈 Cumulative Volume Delta (CVD) — Stair-Step + Threshold Alerts
🔍 Overview
This Cumulative Volume Delta (CVD) tool visualizes aggressive buying and selling pressure in the market by plotting candlestick-style bars based on volume delta. It helps traders understand which side — buyers or sellers — is exerting more control on lower timeframes and highlights momentum shifts through stair-step patterns and delta threshold breaks. Resets to zero at EOD
Ideal for futures traders, scalpers, and intraday strategists looking for orderflow-based confirmation.
🧠 What Is CVD?
CVD (Cumulative Volume Delta) measures the difference between market buys and sells over a specific timeframe. When the delta is rising, it suggests buyers are being more aggressive. Falling delta suggests seller dominance.
This script aggregates volume delta from a lower timeframe and plots it in a higher timeframe context, allowing you to track microstructure shifts within larger candles.
📊 Features
✅ CVD Candlesticks
Each bar represents volume delta as an OHLC-style candle using:
Open: Delta at the start of the bar
High/Low: Peak delta range
Close: Final delta value at bar close
Teal candles = Net buying pressure
Red candles = Net selling pressure
✅ Threshold Levels (Key Visual Zones)
The script includes horizontal dashed lines at:
+5,000 and +10,000 → Signify strong buying pressure
-5,000 and -10,000 → Signify strong selling pressure
0 line → Neutrality line (no net pressure)
These levels act as volume-based support/resistance zones and breakout confirmation tools. For example:
A CVD cross above +5,000 shows buyers taking control
A CVD cross above +10,000 implies strong bullish momentum
A CVD cross below -5,000 or -10,000 signals intense selling pressure
📈 Stair-Step Pattern Detection
Detects two specific volume-based continuation setups:
Bullish Stair-Step: Both the high and low of the CVD candle are higher than the previous candle
Bearish Stair-Step: Both the high and low of the CVD candle are lower than the previous candle
These patterns often appear during trending moves and serve as confirmation of strength or continuation.
Visual markers:
🟢 Green triangles below bars = Bullish stair-step
🔴 Red triangles above bars = Bearish stair-step
🔔 Alert Conditions
Get real-time alerts when:
Bullish Stair-Step is detected
Bearish Stair-Step is detected
CVD crosses above +5,000
CVD crosses below -5,000
📢 Alerts only trigger on crossover, not every time CVD remains above or below. This avoids repetitive notifications.
⚙️ Inputs & Customization
Anchor Timeframe: The higher timeframe to which CVD data is applied (default: 1D)
Lower Timeframe: The timeframe used to calculate the CVD delta (default: 5 minutes)
Optional Override: Use custom timeframe toggle to force your own micro timeframe
📌 How to Use This CVD Indicator (Step-by-Step Guide)
✅ 1. Confirm Bias Using the Zero Line
The zero line (0 CVD) represents neutral pressure — neither buyers nor sellers are dominating.
Use it as your first filter:
🔼 If CVD is above 0 and rising → Buyer control
🔽 If CVD is below 0 and falling → Seller control
🧠 Tip: CVD rising while price is consolidating may signal hidden buyer interest.
✅ 2. Watch for Crosses of Key Levels: +5,000 and +10,000
These levels act as momentum thresholds:
Level Signal Type What It Means
+5,000 Buyer breakout Buyers are starting to dominate
+10,000 Strong bull bias Strong institutional or algorithmic buying flow
-5,000 Seller breakout Sellers are taking control
-10,000 Strong bear bias Heavy selling pressure is entering the market
Wait for CVD to cross above +5K or below -5K to confirm the active side.
Use these crossovers as entry triggers, breakout confirmations, or trade filters.
🔔 Alerts fire only when the level is first crossed, not every bar above/below.
✅ 3. Use Stair-Step Patterns for Continuation Confirmation
The indicator shows stair-step patterns using triangle signals:
🟢 Green triangle below bar = Bullish stair-step
Suggests a higher high and higher low in delta → buyers stepping up
🔴 Red triangle above bar = Bearish stair-step
Suggests lower highs and lower lows in delta → selling pressure building
Use stair-step signals:
To confirm a continuation of trend
As an entry or add-on signal
Especially after a threshold breakout
🧠 Example: If CVD breaks above +5K and forms bullish stairs → confirms strong trend, ideal for momentum entries.
✅ 4. Combine with Price Action or Structure
CVD works best when used with price, not in isolation. For example:
📉 Price makes a new low but CVD doesn’t → potential bullish divergence
📈 CVD surges while price lags → buyers are absorbing, breakout likely
Use it with:
VWAP
Orderblocks
Liquidity sweeps
Break of market structure/MSS/BOS
✅ 5.
Set Anchor Timeframe = Daily
Set Lower Timeframe = 5 minutes (default)
This lets you:
See intraday flow inside daily bars
Confirm whether a daily candle is being built on net buying or selling
🧠 You’re essentially seeing intra-bar aggression within a bigger time structure.
🧭 Example Trading Setup
Bullish Scenario:
CVD is rising and above 0
CVD crosses above +5,000 → alert fires
Green stair-step appears
Price breaks local resistance or liquidity sweep completes
✅ Consider long entry with structure and CVD alignment
🎯 Place stops below last stair-step or structural low
📌 Final Notes
This tool does not repaint and is designed to work in real-time across all futures, crypto, and equity instruments that support volume data. If your symbol does not provide volume, the script will notify you.
Use it in confluence with VWAP, liquidity zones, or structure breaks for high-confidence trades.

SITFX_FuturesSpec_v17SITFX_FuturesSpec_v17 – Universal Futures Contract Library
Full-scale futures contract specification library for Pine Script v6. Covers CME, CBOT, NYMEX, COMEX, CFE, Eurex, ICE, and more – including minis, micros, metals, energies, FX, and bonds.
Key Features:
✅ Instrument‑agnostic: ES/MES, NQ/MNQ, YM/MYM, RTY/M2K, metals, energies, FX, bonds
✅ Full contract data: Tick size, tick value, point value, margins
✅ Continuation‑safe: Single‑line logic, no arrays or continuation errors
✅ Foundation for SITFX tools: Gann, Fibs, structure, and risk modules
Usage example:
import SITFX_FuturesSpec_v17/1 as fs
spec = fs.get(syminfo.root)
label.new(bar_index, high, str.format("{0}: Tick={1}, Value=${2}", spec.name, spec.tickSize, spec.tickValue))

NDX Levels Adjusted to Active TickerThis indicator allows you to plot custom NDX levels directly on the NQ1! (E-mini NASDAQ-100 Futures) chart, automatically adjusting for the spread between NDX and NQ1!. This is particularly useful for traders who perform technical analysis on NDX but execute trades on NQ1!.
Features:
Input up to three NDX key levels to track (e.g., 23000, 24000, 25000).
The script adjusts these levels in real-time based on the current spread between NDX and NQ1!
Displays the spread in the chart header for quick reference
Plots updated horizontal lines that move with the spread
Includes optional labels showing the spread periodically to reduce clutter
Supports Multiple Tickers: NQ1!, QQQ, NAS100 and NAS100USD.
Ideal for futures traders who want SPX context while trading NQ1!, QQQ, NAS100 or NAS100USD..

HSI First 30m Candle Strategy (5m Chart)## HSI First Candle Breakout Strategy
USE on 10m TF for max profit rate.
**The HSI First Candle Breakout Strategy** is a systematic trading approach tailored for Hang Seng Index Futures during the main Hong Kong day session. The strategy is designed to capture early market momentum by reacting to the first significant move of the day.
### How It Works
- **Reference Candle:** At the start of each day session (09:00), the high and low of the first 15-minute candle are recorded.
- **Breakout Trigger:**
- A **buy (long) trade** is initiated if price breaks above the first candle’s high.
- A **sell (short) trade** is initiated if price breaks below the first candle’s low.
- **Stop Loss & Take Profit:**
- Stop-loss is placed on the opposite side of the reference candle.
- Take-profit target is set at a distance equal to the size of the reference candle (1R).
- **Filters:**
- Skip the day if the first candle’s range exceeds 200 index points.
- Only the first triggered direction is traded per session.
- All trades are closed before the market closes if neither target nor stop is hit.
- **Execution:** The strategy works best on intraday charts (5m or 15m) and is ideal for traders seeking disciplined, systematic intraday setups.
### Key Features
- Captures the day’s initial momentum burst.
- Strict risk management with predefined stops and targets.
- One trade per day, reducing overtrading and noise.
- Clear-cut, rule-based, and objective system—no discretion required.
**This strategy offers a transparent and robust framework for traders to systematically capture high-probability breakouts in the Hang Seng Index Futures market.**

Cross-Correlation Lead/Lag AnalyzerCross-Correlation Lead/Lag Analyzer (XCorr)
Discover which instrument moves first with advanced cross-correlation analysis.
This indicator analyzes the lead/lag relationship between any two financial instruments using rolling cross-correlation at multiple time offsets. Perfect for pairs trading, market timing, and understanding inter-market relationships.
Key Features:
Universal compatibility - Works with any two symbols (stocks, futures, forex, crypto, commodities)
Multi-timeframe analysis - Automatically adjusts lag periods based on your chart timeframe
Real-time correlation table - Shows current correlation values for all lag scenarios
Visual lead/lag detection - Color-coded plots make it easy to spot which instrument leads
Smart "Best" indicator - Automatically identifies the strongest relationship
How to Use:
Set your symbols in the indicator settings (default: NQ1! vs RTY1!)
Adjust correlation length (default: 20 periods for smooth but responsive analysis)
Watch the colored lines:
• Red/Orange: Symbol 2 leads Symbol 1 by 1-2 periods
• Blue: Instruments move simultaneously
• Green/Purple: Symbol 1 leads Symbol 2 by 1-2 periods
Check the table for exact correlation values and the "Best" relationship
Interpreting Results:
Correlation > 0.7: Strong positive relationship
Correlation 0.3-0.7: Moderate relationship
Correlation < 0.3: Weak/no relationship
Highest line indicates the optimal timing relationship
Popular Use Cases:
Index Futures : NQ vs ES, RTY vs IWM
Sector Rotation : XLF vs XLK, QQQ vs SPY
Commodities : GC vs SI, CL vs NG
Currency Pairs : EURUSD vs GBPUSD
Crypto : BTC vs ETH correlation analysis
Technical Notes:
Cross-correlation measures linear relationships between two time series at different time lags. This implementation uses Pearson correlation with adjustable periods, calculating correlations from -2 to +2 period offsets to detect leading/lagging behavior.
Perfect for quantitative analysts, pairs traders, and anyone studying inter-market relationships.

Drunken Bird Inspiration for the support and resistance plateau lines came from AnotherDAPTrader.
The TSL Drunken Bird is an enhanced technical analysis tool for swing traders on TradingView, based on the original Accurate Swing Trading System by ceyhun. It generates buy and sell signals when price crosses a dynamic Trailing Stop Loss (TSL) level derived from recent highs and lows. This version introduces plateau detection for support and resistance lines, dynamic label expiration to reduce clutter, customizable line styles and decay, and improved HTF confluence for trend-aligned trading. Visual elements include signal labels, horizontal lines, a colored TSL plot, and optional bar/background coloring. Alerts are available for buy/sell crossovers, making it suitable for assets like NASDAQ E-mini futures, stocks, forex, and more.
This script adapts and expands upon ceyhun's original codetradingview.com, adding significant features such as tolerance-based plateau identification for support/resistance, label management with timeframe-aware expiration (~7 days), cross-count decay for lines, and expanded customization options. Inspiration for the support and resistance plateau lines came from AnotherDAPTrader. Released under the Mozilla Public License 2.0.Key
Features
Swing Signals: "BUY" and "SELL" labels on price crossovers/crossunders of the TSL, with a user-defined lookback (default 3).
HTF Confluence: Filters signals based on higher timeframe trend (e.g., "EXIT LONG" instead of "SELL" if HTF is bullish); toggleable.
HTF Options: Select from 5m, 15m, 30m, 1h, 4h, Daily, Weekly, or Monthly.
Plateau Detection: Identifies flat highs/lows (with tolerance) for resistance/support lines, plotted as dotted/solid/dashed with customizable colors, thickness, and decay after crosses (default 2).
Horizontal Lines: Green (buy) and red (sell) lines at signal closes, extending right until crossed; toggle between short (no extension limit) or long visualization.
TSL Visualization: Colored line (green if close >= TSL, red otherwise) for dynamic levels.
Bar/Background Coloring: Optional green/red coloring based on price vs. TSL.
Label Expiration: All labels (signals and plateaus) auto-delete after ~7 days (timeframe-adjusted, default 1008 bars).
Alerts: Triggers for "Buy Signal" and "Sell Signal" on crossovers.
How to Use
Add to Chart: Paste the Pine Script into TradingView's editor and add to your chart.
Configure Settings:
Swing: Lookback for highs/lows (min 1).
Plateau Tolerance: Flatness allowance (default 0.0).
Use HTF Confluence: Enable for trend filtering.
Higher Time Frame: Choose timeframe string.
Barcolor/Bgcolor: Toggle coloring.
Show Plateau Lines: Enable support/resistance.
Line Styles/Colors/Thickness: Customize buy/sell and plateau visuals.
Plateau Line Decay: Crosses before stopping extension.
Label Expiration: Bars for auto-deletion (~7 days).
Interpret Elements:
Labels: "BUY"/"SELL" (green/red), "EXIT SHORT"/"EXIT LONG" (orange) on signals; "Res"/"Sup" on plateaus.
Lines: Extend right until conditions met (cross for buy/sell, decay threshold for plateaus).
TSL Plot: Monitors trend shifts.
Set Alerts: Use "Buy Signal" or "Sell Signal" conditions for notifications.
Testing: Apply to volatile assets; adjust Swing for signal frequency, tolerance for plateau sensitivity.
Ideal Use Cases
Swing trading on 1m–1h charts for entries/exits aligned with HTF trends.
Identifying support/resistance in ranging markets via plateaus.
Scalping with short lookbacks or longer swings with HTF enabled.
Manual or alert-based trading on futures, stocks, or forex.
Why It's Valuable
This indicator builds on ceyhun's core TSL logic with practical enhancements for modern trading: clutter reduction via expiration/decay, visual customization, and plateau-based S/R for better context. It promotes disciplined, trend-aware decisions while maintaining simplicity.
Note: Optimized for any timeframe/asset; test in demo. Not financial advice—use with risk management.

4 diffs (CB & IBIT Premium)📊 Script Name: 4 diffs (CB & IBIT Premium)
Version: Pine Script® v6
Overlay: Yes (table displayed on chart)
🧠 What it Does:
This script tracks four important Bitcoin price differentials to monitor spot/perpetual/futures price inefficiencies and ETF premium/discounts, and displays them in a live table on the chart. It helps traders identify arbitrage opportunities or institutional pricing signals.
📈 Displayed Metrics:
Coinbase Premium
→ Difference between Coinbase spot and Binance spot prices.
→ Use case: US vs. offshore spot market divergence.
Coinbase Spot vs Binance Perpetual
→ Difference between Coinbase spot and Binance perpetual price.
→ Use case: Spot-perp basis, often used for funding rate insights or market stress.
Bybit vs Binance Perpetual
→ Difference between Bybit perp and Binance perp price.
→ Use case: Compare derivative pricing across major offshore exchanges.
IBIT Premium (CME vs ETF-implied)
→ Compares CME futures price vs. IBIT’s implied spot BTC value
→ IBIT implied BTC = IBIT ETF price ÷ (BTC held / shares outstanding)
→ Use case: Gauge institutional premium/discount and ETF arbitrage clues.
🛠️ Customization:
Text color of the table is adjustable via the input setting.
📌 Visual Output:
A fixed 2×4 table appears in the top-right corner of the chart.
Each row shows a label and the live price difference in USD.

[FS] Time & Cycles Time & Cycles
A comprehensive trading session indicator that helps traders identify and track key market sessions and their price levels. This tool is particularly useful for forex and futures traders who need to monitor multiple trading sessions.
Key Features:
• Multiple Session Support:
- London Session
- New York Session
- Sydney Session
- Asia Session
- Customizable TBD Session
• Session Visualization:
- Clear session boxes with customizable colors
- Session labels with adjustable visibility
- Support for sessions crossing midnight
- Timezone-aware calculations
• Price Level Tracking:
- Daily High/Low levels
- Weekly High/Low levels
- Previous session High/Low levels
- Customizable history depth for each level type
• Customization Options:
- Adjustable colors for each session
- Customizable border styles
- Label visibility controls
- Timezone selection
- History level depth settings
• Technical Features:
- High-performance calculation engine
- Support for multiple timeframes
- Efficient memory usage
- Clean and intuitive visual display
Perfect for:
• Forex traders monitoring multiple sessions
• Futures traders tracking market hours
• Swing traders identifying key session levels
• Day traders planning their trading hours
• Market analysts studying session patterns
The indicator helps traders:
- Identify active trading sessions
- Track session-specific price levels
- Monitor market activity across different time zones
- Plan trades based on session boundaries
- Analyze price action within specific sessions
Note: This indicator is designed to work across all timeframes and is optimized for performance with minimal impact on chart loading times.
