Fractal Dimension Index - FDIThe FDI is a method which assigns a number to the line on your chart. The number will be between 1.0 and 2.0. The closer prices move in a one-dimensional straight line, the closer the FDI moves to 1.0. The more closely prices resemble a two-dimensional plane, the closer the FDI moves to 2.0.
A trend causes the FDI to move down, and we can expect the trend to end when the FDI reaches the 1.35 level. The FDI does not tell us if the trend will reverse sharply, or if prices will begin to range. It only tells us that prices should go back to acting like a fractal soon.
As the market ranges, the FDI will move up. When the FDI reaches the 1.50 level, we can expect a new trend to begin. The FDI does not tell us which way prices will break, only that a break should be coming soon.
Buscar en scripts para "Fractal"


Williams Fractals Dynamic Horizontal LinesWilliams Fractals with Dynamic Horizontal Lines
Overview
This script identifies Williams Fractals (support and resistance points) on any chart and automatically draws horizontal lines at those fractal levels.
The lines extend right and disappear when price breaks them — giving a clean and real-time view of key support and resistance levels.
Features
Detects upward fractals (potential resistances).
Detects downward fractals (potential supports).
Draws horizontal lines at each fractal point.
Automatically deletes a line when:
Price closes above a resistance.
Price closes below a support.
Clean and lightweight — minimal performance impact.
Inputs
Setting Description Default
Periods (n) Number of candles on each side required to confirm a fractal (minimum 2). 2
How It Works
Fractal Detection:
An up fractal is confirmed when a candle has the highest high compared to its neighbors.
A down fractal is confirmed when a candle has the lowest low compared to its neighbors.
Custom logic supports different "ties" — not just strict greater-than or less-than comparisons.
Drawing Lines:
When an up fractal is detected → a red horizontal resistance line is drawn.
When a down fractal is detected → a green horizontal support line is drawn.
Lines are drawn starting at the fractal candle and extend right across the chart.
Dynamic Line Deletion:
Every new candle is checked:
If high > resistance line → delete that resistance line.
If low < support line → delete that support line.
Only unbroken lines are kept on the chart, providing live, updated support/resistance zones.
Visual Elements
Up Fractal: 🡅 Triangular marker (teal color) above the fractal candle.
Down Fractal: 🡇 Triangular marker (red color) below the fractal candle.
Resistance Line: Red horizontal line.
Support Line: Green horizontal line.
Technical Details
Version: Pine Script v6
Arrays Used:
To store and manage active lines (line arrays).
To track the price associated with each line (float arrays).
Error Handling:
Backward iteration is handled using a while loop instead of a for loop to comply with Pine Script restrictions.
Offset Handling:
Fractal markers are plotted with an offset of -n bars for visual alignment.
Possible Enhancements (Future Ideas)
Sensitivity Settings: Allow a small margin (buffer) to define breakouts.
Extend Options: Let users choose between extending "infinite" or "limited" bars.
Custom Alerts: Generate alerts when fractal levels are broken.
Multi-timeframe Support: Detect fractals from higher timeframes on lower timeframe charts.
Example Usage
Swing Trading:
Use the fractal lines to identify and react to key breakouts or breakdowns dynamically.
Intraday Trading:
Spot live support/resistance on smaller timeframes for quick trades.
Trend Reversal Spotting:
Notice when a major fractal level is broken, possibly indicating trend changes.
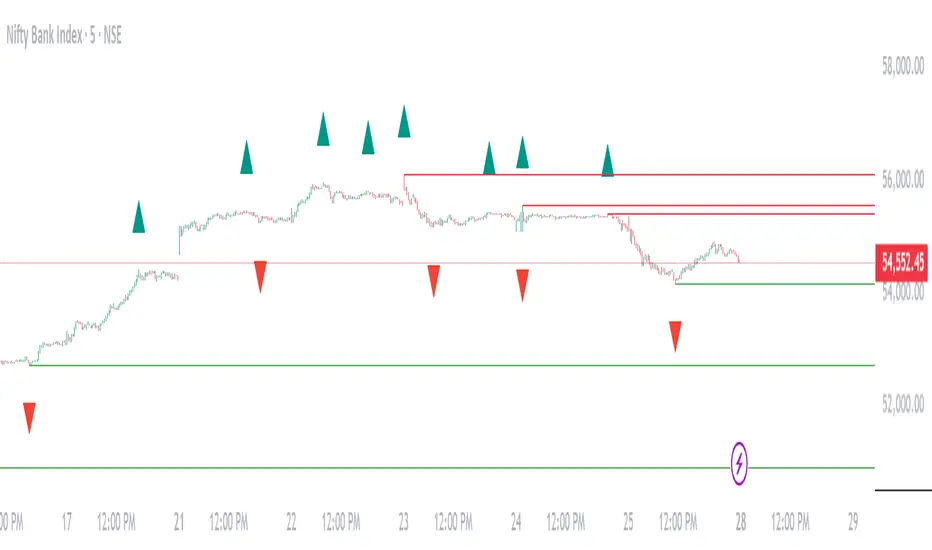
Example Visual — Williams Fractals Dynamic Lines
Price Chart View:
What This Diagram Shows:
▲ Up Fractals:
Form resistance lines.
Line extends until price breaks above it.
▼ Down Fractals:
Form support lines.
Line extends until price breaks below it.
Lines are removed from the chart as soon as broken.
📈 Real Chart Example
Here's a rough idea how it will look live on your TradingView chart:
Feature Visual
Up Fractal 🔺 Green triangle above bar
Resistance Line ➖ Horizontal red line across the chart
Down Fractal 🔻 Red triangle below bar
Support Line ➖ Horizontal green line across the chart
Line Break 🚫 Line disappears when price crosses
HPH's FractalTradesThis indicator is based on some dark fractal magic.
Not really, it's inspired by Vladimir Poltoratskiy and basically just waits for the price to go higher or lower than a previous fractal. If that's the case and all the additional settings allow the trade to take place, it is entered with the stop loss at the last opposite fractal of were it was entered (so if we enter a trade because the price went higher than the last up fractal, the sl is at the last down fractal).
The trades are visualised with a stop loss and 3 take profits levels (at a 1:1, 2,1:1 and 4:1 risk/reward ratio). The stop loss will trail once a certain take profit level is reached. Enjoy!
The settings:
LiveVersion : If ticked it will use close for stop losses and take profits. If unticked high and low will be used. Neither is accurate when backtesting as there is no intrabar data...
CancelEarly : Swings trade in the opposite direction when an opposite signal is received. If unticked the trade will continue until a tp or sl is hit.
ShowStats : Show a table in the top right displaying how many times the stop losses or take profits got hit.
FractalPeriods : Number of bars that are required for a fractal. E.g. if it's 2, 2 bars need to be lower on the left and right of a candle for it to print an up fractal.
MinFractalDiv : If this is bigger than 0, it will not allow new fractals to print unless they are at least a percentage based amount bigger than the last one. So this can be used to filter out fractals that are in the same range. Bigger value = more aggressive filtering!
TicksOnFractal : Tick based offset to add onto the fractals to enter trades. E.g. if it's 5 and the price goes above an up fractal, it needs to go up 5 more ticks to enter a trade.
UseFilter, FilterMultMin and FilterMultMax : If ticked, trades are limited to the once in the specified range (distance of the stop loss). E.g. if FilterMultMax is 0.05, the stop loss can not be bigger than 5% of the assets price for the trade to take place.

Double Top/Bottom Fractals DetectorDouble Top/Bottom Detector with Williams Fractals (Extended + Early Signal)
This indicator combines the classic Williams Fractals methodology with an enhanced mechanism to detect potential reversal patterns—namely, double tops and double bottoms. It does so by using two separate detection schemes:
Confirmed Fractals for Pattern Formation:
The indicator calculates confirmed fractals using the traditional Williams Fractals rules. A fractal is confirmed if a bar’s high (for an up fractal) or low (for a down fractal) is the highest or lowest compared to a specified number of bars on both sides (default: 2 bars on the left and 2 on the right).
Once a confirmed fractal is identified, its price (high for tops, low for bottoms) and bar index are stored in an internal array (up to the 10 most recent confirmed fractals).
When a new confirmed fractal appears, the indicator compares it with previous confirmed fractals. If the new fractal is within a user-defined maximum bar distance (e.g., 20 bars) and the price difference is within a specified tolerance (default: 0.8%), the indicator assumes that a double top (if comparing highs) or a double bottom (if comparing lows) pattern is forming.
A signal is then generated by placing a label on the chart—SELL for a double top and BUY for a double bottom.
Early Signal Generation:
To capture potential reversals sooner, the indicator also includes an “early signal” mechanism. This uses asymmetric offsets different from the confirmed fractal calculation:
Signal Right Offset: Defines the candidate bar used for early signal detection (default is 1 bar).
Signal Left Offset: Defines the number of bars to the left of the candidate that must confirm the candidate’s price is the extreme (default is 2 bars).
For an early top candidate, the candidate bar’s high must be greater than the highs of the bars specified by the left offset and also higher than the bar immediately to its right. For an early bottom candidate, the corresponding condition applies for lows.
If the early candidate’s price level is within the acceptable tolerance when compared to any of the previously stored confirmed fractals (again, within the allowed bar distance), an early signal is generated—displayed as SELL_EARLY or BUY_EARLY.
The early signal block can be enabled or disabled via a checkbox input, allowing traders to choose whether to use these proactive signals.
Key Parameters:
n:
The number of bars used to confirm a fractal. The fractal is considered valid if the bar’s high (or low) is higher (or lower) than the highs (or lows) of the preceding and following n bars.
maxBarsApart:
The maximum number of bars allowed between two fractals for them to be considered part of the same double top or bottom pattern.
tolerancePercent:
The maximum allowed percentage difference (default: 0.8%) between the high (or low) values of two fractals to qualify them as matching for the pattern.
signalLeftOffset & signalRightOffset:
These parameters define the asymmetric offsets for early signal detection. The left offset (default: 2) specifies how many bars to look back, while the right offset (default: 1) specifies the candidate bar’s position.
earlySignalsEnabled:
A checkbox option that allows users to enable or disable early signal generation. When disabled, the indicator only uses confirmed fractal signals.
How It Works:
Fractal Calculation and Plotting:
The confirmed fractals are calculated using the traditional method, ensuring robust identification by verifying the pattern with a symmetrical offset. These confirmed fractals are plotted on the chart using triangle shapes (upwards for potential double bottoms and downwards for potential double tops).
Pattern Detection:
Upon detection of a new confirmed fractal, the indicator checks up to 10 previous fractals stored in internal arrays. If the new fractal’s high or low is within the tolerance range and close enough in terms of bars to one of the stored fractals, it signifies the formation of a double top or double bottom. A corresponding SELL or BUY label is then placed on the chart.
Early Signal Feature:
If enabled, the early signal block checks for candidate bars based on the defined asymmetric offsets. These candidates are evaluated to see if their high/low levels meet the early confirmation criteria relative to nearby bars. If they also match one of the confirmed fractal levels (within tolerance and bar distance), an early signal is issued with a label (SELL_EARLY or BUY_EARLY) on the chart.
Benefits for Traders:
Timely Alerts:
By combining both confirmed and early signals, the indicator offers a proactive approach to detect reversals sooner, potentially improving entry and exit timing.
Flexibility:
With adjustable parameters (including the option to disable early signals), traders can fine-tune the indicator to better suit different markets, timeframes, and trading styles.
Enhanced Pattern Recognition:
The dual-layered approach (confirmed fractals plus early detection) helps filter out false signals and captures the essential formation of double tops and bottoms more reliably.

Ichimoku Cloud MasterIchimoku Cloud Master aims to provide the ichimoku trader with easy alert functionality to not miss out on valuable trade setups. The key purpose of this script is to better visualise crucial moments in Ichimoku trading. These alerts should not be used for botting in my opinion as they always need a human to confirm the ichimoku market structure. For example, is the Kijun-Sen flat and too far away from price? A good ichimoku trader will not enter at such a point in time.
Explanation of script:
Chikou(lagging span): pink line, this is price plotted 26 bars ago. People ignore the power of this it is crucial to see how chikou behaves towards past price action as seen in the chart below where we got an entry at red arrow because chikou bounced from past fractal bottom.
Kijun-Sen(base line): Black line or color coded line. This is the equilibrium of last 26 candles. To me this is the most important line in the system as it attracts price.
Kijun = (Highest high of 26 periods + Lowest low of 26 periods) ÷ 2
Tenkan-Sen(conversion line): Blue line. This is the equilibrium of last 9 candles. In a strong uptrend price stays above this line.
Tenkan = (Highest high of 9 periods + Lowest low of 9 periods) ÷ 2
Senkou A (Leading span A)= Pink cloud line, this is the average of the 2 components projected 26 bars in the future.
Senkou A = (Tenkan + Kijun) ÷ 2
Senkou B (Leading span B) = Green cloud line, this is the 52 day equilibrium projected 26 bars in the future.
Senkou B = (Highest high of prior 52 periods + Lowest low of prior 52 periods) ÷ 2
Notice how the distance between Chikou and the cloud is also 52 bars. This is all part of Hosoda's numbers which I am not going to explain here.
Fractals: These are the black triangles you find at key turning point. If you want to know how they work reseach williams fractals. I've used fractals with a period of 9 as it is an ichimoku number. These fractals are useful when working with ichimoku wave theory. Again I will not explain that here but in further education
Fractal Support: Ability to extend lines from the fractals which can be used as an entry/exit mechanism in your trading. For example wait for tenkan to cross kijun and then enter on fractal breakout.
Signals:
Crossing of Chikou (lagging span) with past Kijun-Sen: this will color code the Bars / Kijun-Sen (you can turn this off in options)
The script also has a signal for this, this will be the green and purple diamonds. Where green is bullish and purple is bearish.
wy is this important?
When current price plotted 26 candles back (chikou) crosses over the past equilibrium (kijun-sen) this usualy means price has moved past resistance levels where sellers come in. This indicates a switch in market structure and price is bullish from this point, this is the same in the other direction.
Kumo Twist: when the kumo cloud (future) has a crossover from for example green to red (bull to bear). The script plots these using the colored cross symbols as seen in the picture above. A chikou cross + a Kumo twist at same bar of next to eachother below the cloud can be a great entry sign: this would be an entry after cross in the chart above.
Kijun Bounce: when in an uptrend the price retraces back to Kijun-Sen and starts to go back up. These are marked by the yellow circles as seen in chart below:
low below Kijun-Sen and close above it
Strong Trend: when Tenkan is above Kijun, price above cloud, future cloud green, chikou above close, chikou above Kijun we establish a strong bullish trend. For bearish the exact opposite. The script has a function to send an alert at the start of such trends and to plot them with small colored circles above the bars.
Customisation:
I've added options to disable specific aspects of the indicator for those traders who do not want to use all aspects of the indicator. In the customisation tab I've given each part a clear title so you can use your own colors/shapes.
The perfect entry?
Further info:
Look into my education pane, I will be adding education in the future. The chance of me making a more advanced version of the script including line forecasting etc is rather high so watch out for that.
For those who want to master this system I recommend reading the book:
How to make money with the ichimoku system by Balkrishna M. Sadekar
Or the originals books by Hosoda the inventor of Ichimoku if you can get your hands on them and can read Japanese.
Almost all info about the ichimoku system you find on the internet will lose you money because they reduce the system to simple signals that do not generate money.
I will be providing educational material on tradingview using this indicator.

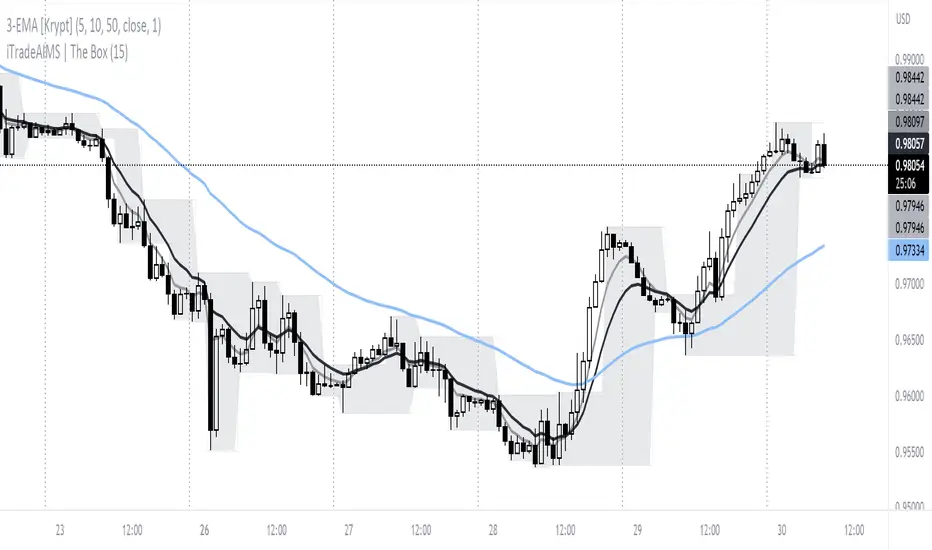
iTradeAIMS | The BOX IndicatorIntroduction to iTradeAIMS The Box Indicator
Here I will attempt to give a brief introduction to this amazing indicator that has revolutionised my trading since 2009.
Everything in the universe is energy and energy follows the path of least resistance. When it moves it heavily influenced by a structure.
When energy flows it reacts to the underlying structure. Electricity flows through copper wires easily compared to "my arm".
A river flows smoothly on flat plains of the land but becomes violent when flowing down a mountain. Why is this? Why does it change its behaviour?
The Science of Chaos Brings us here. Everything in the universe has an internal or underlying structure. That structure is often, but not always, hidden.
The Market has an underlying Unseen Structure. And it can be revealed by using this indicator. TSX:TSL
Anatomy of the Box
The iTradeAIMS Boxes are formed using the high and low of the fractals.
A new AIMS Box will be created whenever price makes a new high or low Fractal.
The bottom of the AIMS Box – the Lower AIMS Level - is created when a low Fractal is formed i.e. the low of a candle is lower than two candles to the left and two candles to the right.
What is the Underlying Structure of the Market?
The underlying structure of the Market is Elliott Wave .
And the Underlying Structure of the Elliott Wave is the Fractals.
This BOX is an indicator based on the Fractals.
The Upper and Lower Levels require a minimum of five bars with the top of the box being the upper Fractal; the bottom of the box, the lower Fractal
The AIMS Levels are the high and low of the AIMS Box – the upper and lower Fractals.
This indicator, by itself, provided the concept that revolutionised my trading.
What are the Benefits of Using AIMS iTradeAIMS The Box?
1. Identify Trend:
The Box will also help you identify Trending Markets.
The Stepping Up pattern it creases is an indication of UPTREND .
The Stepping Down pattern indicates DOWNTREND .
2. Identify Entry Points
The Box will help you identify Entry Points into the market.
There are two ways it helps you make entries into the market.
a) breakout entry
b) trend following entry
3. Identify Range-Bound Market
The Box helps identify a sideways range-bound market.
When the box is not creating either a stepping up or stepping down pattern, it usually indicates to a sideways or rangebound market on that time frame.
4. Help you Make Entries: Calculate Correct Positions Size and Risk Size
The BOX is the structure of the market that offers the best method of How to calculate Risk Per Trade based on the market generated information.
Calculate your Entry Level and Stop Loss level using the Box Levels on either side of the box.
Buying the Box:
Set a Buy Order a Point above the Box and Stop Loss a point below the Box Low.
Selling the Box
Set a Sell Order a Point Below the Box Low and Stop Loss a Point Above the Box High.
TSLA Entries and Exits for Tesla Stock
I took this trade on the box high of this stock OII
I shared the Idea on TradingView as a Buy Signal on OII
Check the BitCoin Entry Here
5. Stop Loss Trailing Mechanism to Lock in Profits
The box levels are used for Trailing Stops.
For Long (Buy) Orders use the box low as a stop loss level for trailing and locking-in profits.
For Shorts (Sell) Orders, use the Box High levels for trailing stop and lock in profits.
6. Support and Resistance
The Box Levels (upper and lower) clearly shows support and resistance – where price approached a level and could not go further, forcing it to retrace on itself.
Pay attention to how box levels create ranges and also indicate trends.
How to Use this Indicator with other Indicators?
This indicator is great on its own but even greater if used in conjunction with iTradeAIMS The Wave and The Gator and The Magic Purple (Script Available FREE to use on iTradeAIMS Profile)
> The market always creates an AIMS Box before it turns around.
> Every trend starts and ends with an AIMS Box.
> Entries are always taken on the breakout of the AIMS Box.
How to Get Access to This Script?
Enjoy and accept it as my gift to the TradingView Community from iTradeAIMS | This Indicator is now available to everyone for FREE.
Credits: I learned the method from Bill Williams of Profitunity.com All credits, thanks, gratitude, positive vibes, and prayers goes to Dr Williams 🥇 (RIP) and his family ❤.
Alligator + Fractals + Divergent & Squat Bars + Signal AlertsThe indicator includes Williams Alligator, Williams Fractals, Divergent Bars, Market Facilitation Index, Highest and Lowest Bars, maximum and minimum peak of Awesome Oscillator, and signal alerts based on Bill Williams' Profitunity strategy.
MFI and Awesome Oscillator
According to the Market Facilitation Index Oscillator, the Squat bar is colored blue, all other bars are colored according to the Awesome Oscillator color, except for the Fake bars, colored with a lighter AO color. In the indicator settings, you can enable the display of "Green" bars (in the "Green Bars > Show" field). In the indicator style settings, you can disable changing the color of bars in accordance with the AO color (in the "AO bars" field), including changing the color for Fake bars (in the "Fake AO bars" field).
MFI is calculated using the formula: (high - low) / volume.
A Squat bar means that, compared to the previous bar, its MFI has decreased and at the same time its volume has increased, i.e. MFI < previous bar and volume > previous bar. A sign of a possible price reversal, so this is a particularly important signal.
A Fake bar is the opposite of a Squat bar and means that, compared to the previous bar, its MFI has increased and at the same time its volume has decreased, i.e. MFI > previous bar and volume < previous bar.
A "Green" bar means that, compared to the previous bar, its MFI has increased and at the same time its volume has increased, i.e. MFI > previous bar and volume > previous bar. A sign of trend continuation. But a more significant trend confirmation or warning of a possible reversal is the Awesome Oscillator, which measures market momentum by calculating the difference between the 5 Period and 34 Period Simple Moving Averages (SMA 5 - SMA 34) based on the midpoints of the bars (hl2). Therefore, by default, the "Green" bars and their opposite "Fade" bars are colored according to the color of the Awesome Oscillator.
According to Bill Williams' Profitunity strategy, using the Awesome Oscillator, the third Elliott wave is determined by the maximum peak of AO in the range from 100 to 140 bars. The presence of divergence between the maximum AO peak and the subsequent lower AO peak in this interval also warns of a possible correction, especially if the AO crosses the zero line between these AO peaks. Therefore, the chart additionally displays the prices of the highest and lowest bars, as well as the maximum or minimum peak of AO in the interval of 140 bars from the last bar. In the indicator settings, you can hide labels, lines, change the number of bars and any parameters for the AO indicator - method (SMA, Smoothed SMA, EMA and others), length, source (open, high, low, close, hl2 and others).
Bullish Divergent bar
🟢 A buy signal (Long) is a Bullish Divergent bar with a green circle displayed above it if such a bar simultaneously meets all of the following conditions:
The high of the bar is below all lines of the Alligator indicator.
The closing price of the bar is above its middle, i.e. close > (high + low) / 2.
The low of the bar is below the low of 2 previous bars or below the low of one previous bar, and the low of the second previous bar is a lower fractal (▼). By default, Divergent bars are not displayed, the low of which is lower than the low of only one previous bar and the low of the 2nd previous bar is not a lower fractal (▼), but you can enable the display of any Divergent bars in the indicator settings (by setting the value "no" in the " field Divergent Bars > Filtration").
The following conditions strengthen the Bullish Divergent bar signal:
The opening price of the bar, as well as the closing price, is higher than its middle, i.e. Open > (high + low) / 2.
The high of the bar is below all lines of the open Alligator indicator, i.e. the green line (Lips) is below the red line (Teeth) and the red line is below the blue line (Jaw). In this case, the color of the circle above the Bullish Divergent bar is dark green.
Squat Divergent bar.
The bar following the Bullish Divergent bar corresponds to the green color of the Awesome Oscillator.
Divergence on Awesome Oscillator.
Formation of the lower fractal (▼), in which the low of the Divergent bar is the peak of the fractal.
Bearish Divergent bar
🔴 A signal to sell (Short) is a Bearish Divergent bar under which a red circle is displayed if such a bar simultaneously meets all the following conditions:
The low of the bar is above all lines of the Alligator indicator.
The closing price of the bar is below its middle, i.e. close < (high + low) / 2.
The high of the bar is higher than the high of 2 previous bars or higher than the high of one previous bar, and the high of the second previous bar is an upper fractal (▲). By default, Divergent bars are not displayed, the high of which is higher than the high of only one previous bar and the high of the 2nd previous bar is not an upper fractal (▲), but you can enable the display of any Divergent bars in the indicator settings (by setting the value "no" in the " field Divergent Bars > Filtration").
The following conditions strengthen the Bearish Divergent bar signal:
The opening price of the bar, as well as the closing price, is below its middle, i.e. open < (high + low) / 2.
The low of the bar is above all lines of the open Alligator indicator, i.e. the green line (Lips) is above the red line (Teeth) and the red line is above the blue line (Jaw). In this case, the color of the circle under the Bearish Divergent bar is dark red.
Squat Divergent bar.
The bar following the Bearish Divergent bar corresponds to the red color of the Awesome Oscillator.
Divergence on Awesome Oscillator.
Formation of the upper fractal (▲), in which the high of the Divergent bar is the peak of the fractal.
Alligator lines crossing
Bars crossing the green line (Lips) of the open Alligator indicator is the first warning of a possible correction (price rollback) if one of the following conditions is met:
If the bar closed below the Lips line, which is above the Teeth line, and the Teeth line is above the Jaw line, while the closing price of the previous bar is above the Lips line.
If the bar closed above the Lips line, which is below the Teeth line, and the Teeth line is below the Jaw line, while the closing price of the previous bar is below the Lips line.
The intersection of all open Alligator lines by bars is a sign of a deep correction and a warning of a possible trend change.
Frequent intersection of Alligator lines with each other is a sign of a sideways trend (flat).
Signal Alerts
To receive notifications about signals when creating an alert, you must select the condition "Any alert() function is call", in which case notifications will arrive in the following format:
D — timeframe, for example: D, 4H, 15m.
🟢 BDB⎾ - a signal for a Bullish Divergent bar to buy (Long), triggers once after the bar closes and includes additional signals:
/// — if Alligator is open.
⏉ — if the opening price of the bar, as well as the closing price, is above its middle.
+ Squat 🔷 - Squat bar or + Green ↑ - "Green" bar or + Fake ↓ - Fake bar.
+ AO 🟩 - if after the Divergent bar closes, the oscillator color change for the next bar corresponds the green color of the Awesome Oscillator. ┴/┬ — AO above/below the zero line. ∇ — if there is divergence on AO in the interval of 140 bars from the last bar.
🔴 BDB⎿ - a signal for a Bearish Divergent bar to sell (Short), triggers once after the bar closes and includes additional signals:
/// — if Alligator is open.
⏊ — if the opening price of the bar, as well as the closing price, is below its middle.
+ Squat 🔷 - Squat bar or + Green ↑ - "Green" bar or + Fake ↓ - Fake bar.
+ AO 🟥 - if after the Divergent bar closes, the oscillator color change for the next bar corresponds to the red color of the Awesome Oscillator. ┴/┬ — AO above/below the zero line. ∇ — if there is divergence on AO in the interval of 140 bars from the last bar.
Alert for bars crossing the green line (Lips) of the open Alligator indicator (can be disabled in the indicator settings in the "Alligator > Enable crossing lips alerts" field):
🔴 Crossing Lips ↓ - if the bar closed below the Lips line, which is above than the other lines, while the closing price of the previous bar is above the Lips line.
🟢 Crossing Lips ↑ - if the bar closed above the Lips line, which is below the other lines, while the closing price of the previous bar is below the Lips line.
The fractal signal is triggered after the second bar closes, completing the formation of the fractal, if alerts about fractals are enabled in the indicator settings (the "Fractals > Enable alerts" field):
🟢 Fractal ▲ - upper (Bearish) fractal.
🔴 Fractal ▼ — lower (Bullish) fractal.
⚪️ Fractal ▲/▼ - both upper and lower fractal.
↳ (H=high - L=low) = difference.
If you redirect notifications to a webhook URL, for example, to a Telegram bot, then you need to set the notification template for the webhook in the indicator settings in the "Webhook > Message" field (contains a tooltip with an example), in which you just need to specify the text {{message}}, which will be automatically replaced with the alert text with a ticker and a link to TradingView.
‼️ A signal is not a call to action, but only a reason to analyze the chart to make a decision based on the rules of your strategy.
***
Индикатор включает в себя Williams Alligator, Williams Fractals, Дивергентные бары, Market Facilitation Index, самый высокий и самый низкий бары, максимальный и минимальный пик Awesome Oscillator, а также оповещения о сигналах на основе стратегии Profitunity Билла Вильямса.
MFI и Awesome Oscillator
В соответствии с осциллятором Market Facilitation Index Приседающий бар окрашен в синий цвет, все остальные бары окрашены в соответствии с цветом Awesome Oscillator, кроме Фальшивых баров, которые окрашены более светлым цветом AO. В настройках индикатора вы можете включить отображение "Зеленых" баров (в поле "Green Bars > Show"). В настройках стиля индикатора вы можете выключить изменение цвета баров в соответствии с цветом AO (в поле "AO bars"), в том числе изменить цвет для Фальшивых баров (в поле "Fake AO bars").
MFI рассчитывается по формуле: (high - low) / volume.
Приседающий бар означает, что по сравнению с предыдущим баром его MFI снизился и в тоже время вырос его объем, т.е. MFI < предыдущего бара и объем > предыдущего бара. Признак возможного разворота цены, поэтому это особенно важный сигнал.
Фальшивый бар является противоположностью Приседающему бару и означает, что по сравнению с предыдущим баром его MFI увеличился и в тоже время снизился его объем, т.е. MFI > предыдущего бара и объем < предыдущего бара.
"Зеленый" бар означает, что по сравнению с предыдущим баром его MFI увеличился и в тоже время вырос его объем, т.е. MFI > предыдущего бара и объем > предыдущего бара. Признак продолжения тренда. Но более значимым подтверждением тренда или предупреждением о возможном развороте является Awesome Oscillator, который измеряет движущую силу рынка путем вычисления разницы между 5 Периодной и 34 Периодной Простыми Скользящими Средними (SMA 5 - SMA 34) по средним точкам баров (hl2). Поэтому по умолчанию "Зеленые" бары и противоположные им "Увядающие" бары окрашены в соответствии с цветом Awesome Oscillator.
По стратегии Profitunity Билла Вильямса с помощью осциллятора Awesome Oscillator определяется третья волна Эллиота по максимальному пику AO в интервале от 100 до 140 баров. Наличие дивергенции между максимальным пиком AO и следующим за ним более низким пиком AO в этом интервале также предупреждает о возможной коррекции, особенно если AO переходит через нулевую линию между этими пиками AO. Поэтому на графике дополнительно отображаются цены самого высокого и самого низкого баров, а также максимальный или минимальный пик АО в интервале 140 баров от последнего бара. В настройках индикатора вы можете скрыть метки, линии, изменить количество баров и любые параметры для индикатора AO – метод (SMA, Smoothed SMA, EMA и другие), длину, источник (open, high, low, close, hl2 и другие).
Бычий Дивергентный бар
🟢 Сигналом на покупку (Long) является Бычий Дивергентный бар над которым отображается зеленый круг, если такой бар соответствует одновременно всем следующим условиям:
Максимум бара ниже всех линий индикатора Alligator.
Цена закрытия бара выше его середины, т.е. close > (high + low) / 2.
Минимум бара ниже минимума 2-х предыдущих баров или ниже минимума одного предыдущего бара, а минимум второго предыдущего бара является нижним фракталом (▼). По умолчанию не отображаются Дивергентные бары, минимум которых ниже минимума только одного предыдущего бара и минимум 2-го предыдущего бара не является нижним фракталом (▼), но вы можете включить отображение любых Дивергентных баров в настройках индикатора (установив значение "no" в поле "Divergent Bars > Filtration").
Усилением сигнала Бычьего Дивергентного бара являются следующие условия:
Цена открытия бара, как и цена закрытия, выше его середины, т.е. Open > (high + low) / 2.
Максимум бара ниже всех линий открытого индикатора Alligator, т.е. зеленая линия (Lips) ниже красной линии (Teeth) и красная линия ниже синей линии (Jaw). В этом случае цвет круга над Бычьим Дивергентным баром окрашен в темно-зеленый цвет.
Приседающий Дивергентный бар.
Бар, следующий за Бычьим Дивергентным баром, соответствует зеленому цвету Awesome Oscillator.
Дивергенция на Awesome Oscillator.
Образование нижнего фрактала (▼), у которого минимум Дивергентного бара является пиком фрактала.
Медвежий Дивергентный бар
🔴 Сигналом на продажу (Short) является Медвежий Дивергентный бар под которым отображается красный круг, если такой бар соответствует одновременно всем следующим условиям:
Минимум бара выше всех линий индикатора Alligator.
Цена закрытия бара ниже его середины, т.е. close < (high + low) / 2.
Максимум бара выше маскимума 2-х предыдущих баров или выше максимума одного предыдущего бара, а максимум второго предыдущего бара является верхним фракталом (▲). По умолчанию не отображаются Дивергентные бары, максимум которых выше максимума только одного предыдущего бара и максимум 2-го предыдущего бара не является верхним фракталом (▲), но вы можете включить отображение любых Дивергентных баров в настройках индикатора (установив значение "no" в поле "Divergent Bars > Filtration").
Усилением сигнала Медвежьего Дивергентного бара являются следующие условия:
Цена открытия бара, как и цена закрытия, ниже его середины, т.е. open < (high + low) / 2.
Минимум бара выше всех линий открытого индикатора Alligator, т.е. зеленая линия (Lips) выше красной линии (Teeth) и красная линия выше синей линии (Jaw). В этом случае цвет круга под Медвежьим Дивергентным Баром окрашен в темно-красный цвет.
Приседающий Дивергентный бар.
Бар, следующий за Медвежьим Дивергентным баром, соответствует красному цвету Awesome Oscillator.
Дивергенция на Awesome Oscillator.
Образование верхнего фрактала (▲), у которого максимум Дивергентного бара является пиком фрактала.
Пересечение линий Alligator
Пересечение барами зеленой линии (Lips) открытого индикатора Alligator является первым предупреждением о возможной коррекции (откате цены) при выполнении одного из следующих условий:
Если бар закрылся ниже линии Lips, которая выше линии Teeth, а линия Teeth выше линии Jaw, при этом цена закрытия предыдущего бара находится выше линии Lips.
Если бар закрылся выше линии Lips, которая ниже линии Teeth, а линия Teeth ниже линии Jaw, при этом цена закрытия предыдущего бара находится ниже линии Lips.
Пересечение барами всех линий открытого Alligator является признаком глубокой коррекции и предупреждением о возможной смене тренда.
Частое пересечение линий Alligator между собой является признаком бокового тренда (флэт).
Оповещения о сигналах
Для получения уведомлений о сигналах при создании оповещения необходимо выбрать условие "При любом вызове функции alert()", в таком случае уведомления будут приходить в следующем формате:
D — таймфрейм, например: D, 4H, 15m.
🟢 BDB⎾ — сигнал Бычьего Дивергентного бара на покупку (Long), срабатывает один раз после закрытия бара и включает дополнительные сигналы:
/// — если Alligator открыт.
⏉ — если цена открытия бара, как и цена закрытия, выше его середины.
+ Squat 🔷 — Приседающий бар или + Green ↑ — "Зеленый" бар или + Fake ↓ — Фальшивый бар.
+ AO 🟩 — если после закрытия Дивергентного бара, изменение цвета осциллятора для следующего бара соответствует зеленому цвету Awesome Oscillator. ┴/┬ — AO выше/ниже нулевой линии. ∇ — если есть дивергенция на AO в интервале 140 баров от последнего бара.
🔴 BDB⎿ — сигнал Медвежьего Дивергентного бара на продажу (Short), срабатывает один раз после закрытия бара и включает дополнительные сигналы:
/// — если Alligator открыт.
⏊ — если цена открытия бара, как и цена закрытия, ниже его середины.
+ Squat 🔷 — Приседающий бар или + Green ↑ — "Зеленый" бар или + Fake ↓ — Фальшивый бар.
+ AO 🟥 — если после закрытия Дивергентного бара, изменение цвета осциллятора для следующего бара соответствует красному цвету Awesome Oscillator. ┴/┬ — AO выше/ниже нулевой линии. ∇ — если есть дивергенция на AO в интервале 140 баров от последнего бара.
Сигнал пересечения барами зеленой линии (Lips) открытого индикатора Alligator (можно отключить в настройках индикатора в поле "Alligator > Enable crossing lips alerts"):
🔴 Crossing Lips ↓ — если бар закрылся ниже линии Lips, которая выше остальных линий, при этом цена закрытия предыдущего бара находится выше линии Lips.
🟢 Crossing Lips ↑ — если бар закрылся выше линии Lips, которая ниже остальных линий, при этом цена закрытия предыдущего бара находится ниже линии Lips.
Сигнал фрактала срабатывает после закрытия второго бара, завершающего формирование фрактала, если оповещения о фракталах включены в настройках индикатора (поле "Fractals > Enable alerts"):
🟢 Fractal ▲ — верхний (Медвежий) фрактал.
🔴 Fractal ▼ — нижний (Бычий) фрактал.
⚪️ Fractal ▲/▼ — одновременно верхний и нижний фрактал.
↳ (H=high - L=low) = разница.
Если вы перенаправляете оповещения на URL вебхука, например, в бота Telegram, то вам необходимо установить шаблон оповещения для вебхука в настройках индикатора в поле "Webhook > Message" (содержит подсказку с примером), в котором в качестве текста сообщения достаточно указать текст {{message}}, который будет автоматически заменен на текст оповещения с тикером и ссылкой на TradingView.
‼️ Сигнал — это не призыв к действию, а лишь повод проанализировать график для принятия решения на основе правил вашей стратегии.

Evolution Ranger V2This indicator plots 4H and 15M ranges and fractals.
The ranges are formed by the fractals and breaks of these candles
It also shows in a label if the trend BIAS on the 4H is "UC, NFT, FT or SFT" (Long or Short)
This will give the user a BIAS for the coming trading day. So when price breaks out of the plotted range, you'll have a new bias trend change
If it trading within the range, the trend bias remains the same
UC = unconfirmed Bias => wait
NFT= No follow through => Take only trades in the opposite direction from the break
FT = Follow through. => Wait for price to retrace to the other side of the 4H range, than trade in the direction of the BIAS
SFT = Strong follow through => Take trades in the direction of the BIAS anywhere in the 4H range
It draws all the range lines you need, so you don't have to.
4H Range (also on 15M), on the 15M; external and internal ranges.
Lots of possibilities:
-Plots the fractals, so you don't need another indicator. (Option to let the fractals repaint or not)
-4H Fractal Range lines and BIAS (previous fractal break line) and a 4H-BIAS label both on the M15 and 4H charts. No more switching between 4H and 15M charts needed.
-Option to switch on/off historic ranges.
-BIAS label shows 'UC, NFT, FT and SFT' - Long and Short
-Lots of alerts, break of 4H range, 15M external and internal ranges. You can go wild with it. Select 'Alert Once per bar'
-Option to show the 'Inside bar' and in a different candle colour.
-Option to toggle the repaint of fractal when the current candle has not closed yet.
-Option to show the BIAS label only for a confirmed bar while trading in live markets. When 'Off' the BIAS label repaints, but gives information on what might come, when the current bar closes.
-Most of the lines can be adjusted for colour and style to your own liking.

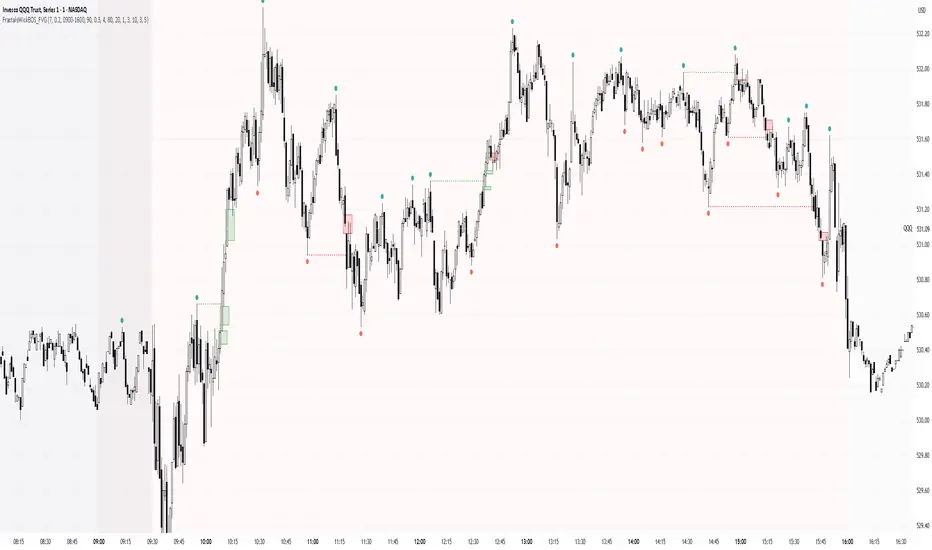
Simple Fractals with Wick Filter & BOSThis advanced fractal indicator combines traditional Williams Fractal analysis with sophisticated wick filtering and Break of Structure (BOS) detection to identify high-probability reversal points and structural breaks in price action.
🔍 How It Works
Fractal Detection: Uses the classic Williams Fractal methodology to identify swing highs and lows. A fractal high occurs when a candle's high is greater than N periods before and after it. Similarly, a fractal low occurs when a candle's low is lower than N periods on both sides.
Wick Filtering: Only displays fractals where the rejection wick meets a minimum threshold, ensuring the fractal represents genuine price rejection rather than minor fluctuations.
Break of Structure (BOS): Monitors when strong candles close beyond previous fractal levels within a specified lookback period, indicating potential trend changes or continuation patterns.
⚙️ Parameter Guide
Periods (Default: 7) - Controls fractal sensitivity
Wick Threshold (Default: 0.4 / 40%) - Minimum wick size relative to total candle range
BOS Lookback Bars (Default: 90) - How far back to monitor fractal levels for potential breaks
Strong Candle Body % (Default: 0.5 / 50%) - Minimum body size required to trigger BOS, Higher values reduce false signals but may miss some valid breaks
📊 Visual Elements
Colored Dots: Small circles mark validated fractals
Top Wick Fractals: Customizable color (default red) above bars
Bottom Wick Fractals: Customizable color (default green) below bars
BOS Lines: Dotted horizontal lines connecting fractal origin to break point
Green Lines: Bullish BOS (price closes above fractal high)
Red Lines: Bearish BOS (price closes below fractal low)
Faded Fractals (Optional): Shows all fractals that didn't meet wick requirements for comparison
🔔 Alerts
The indicator includes built-in alerts for:
High fractal formation with sufficient wick
Low fractal formation with sufficient wick
Swing PointsEnglish:
The indicator shows the fractals where stop-losses may be located and can be used to trade from their taking.
You can adjust the length of the fractal (the number of bars with which it is surrounded on both sides, to confirm the validity).
You can also display lines from fractal points for clarity.
To keep the chart clean, you can enable deletion of already taken fractals.
Example of use with deleted fractals and without lines:
Русский:
Индикатор показывает фракталы где могут находиться стоп-лоссы и его можно использовать для торговли от их снятия.
Можно настраивать длину фрактала (количество баров, которыми он окружен с обеих сторон, для подтверждения валидности).
Так же можно выводить линии от фрактальных точек для наглядности.
Для сохранения чистоты графика можно включить удаление уже снятых фракталов.
Пример использования с удалением снятых фракталов и без линий:
Khaos-Smart-FractalsKhaos-Smart-Fractals
This indicator draws fractals as well as drawing fractal breaks. A fractal break is when a bar closes beyond the last painted fractal at the time.
There are two types of fractal breaks.
1) First Fractal Breaks (FFB) which is the first break of a fractal in a new trend direction. Thereby signifying a new trend direction.
2) Continuation Fractal Breaks (cFB) which are fractal breaks that occur after a FFB, in the FFB trend direction, thereby signify a continuing of the trend direction.
The indicator paints an Triangle Up for Bullish Fractals, and a Triangle Down for Bearish Fractals.
The indicator will paint First Fractal Breaks with a Flag Icon and a label “FFB”.
The indicator will paint Continuation Fractal Breaks with a sequencing letters, where A is the first Continuation Fractal Break, “B” is the second, and “C” is the third and so on…
There are two dash levels to the right of the current price bar, these are at levels of the highest high of the last two bullish fractals, and the lowest low of the last 2 bear fractals. This can be used for trailing stops.
First Fractal Break Alerts are fully supported, via email, sms, and desktop notification, via TradingView
LEGAL STUFF:
Risk Disclosure
Futures , forex, stock, crypto and derivative trading contains substantial risk and is not for every investor. An investor could potentially lose all or more than the initial investment. Risk capital is money that can be lost without jeopardizing ones’ financial security or life style. Only risk capital should be used for trading and only those with sufficient risk capital should consider trading. Past performance is not necessarily indicative of future results
Hypothetical Performance Disclosure
Hypothetical performance results have many inherent limitations, some of which are described below. no representation is being made that any account will or is likely to achieve profits or losses similar to those shown; in fact, there are frequently sharp differences between hypothetical performance results and the actual results subsequently achieved by any particular trading program. One of the limitations of hypothetical performance results is that they are generally prepared with the benefit of hindsight. In addition, hypothetical trading does not involve financial risk, and no hypothetical trading record can completely account for the impact of financial risk of actual trading. for example, the ability to withstand losses or to adhere to a particular trading program in spite of trading losses are material points which can also adversely affect actual trading results. There are numerous other factors related to the markets in general or to the implementation of any specific trading program which cannot be fully accounted for in the preparation of hypothetical performance results and all which can adversely affect trading results

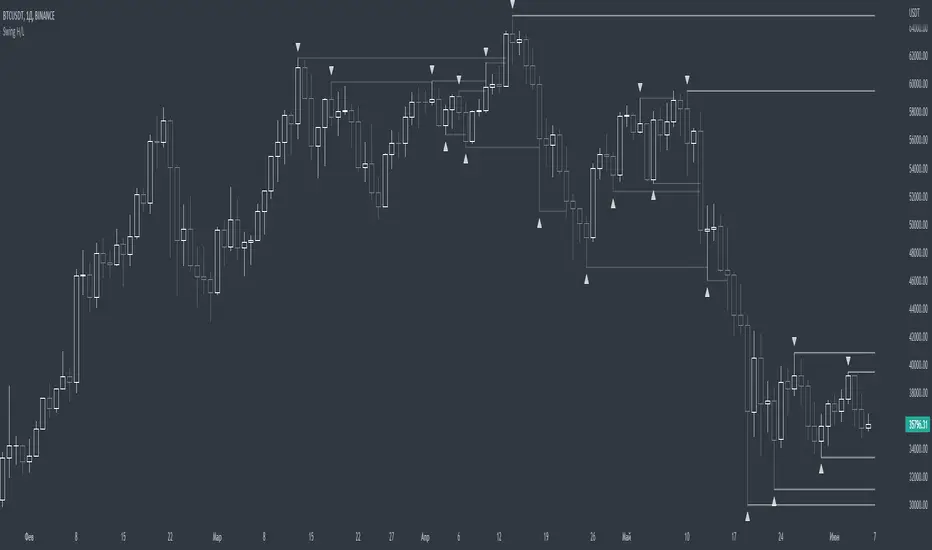
Williams FractalsBoaBias Fractals High & Lows is an indicator based on Bill Williams' fractals that helps identify key support and resistance levels on the chart. It displays horizontal lines at fractal highs (red) and lows (green), which extend to the current bar. Lines automatically disappear if the price breaks through them, leaving only the relevant levels. Additionally, the indicator shows the price values of active fractals on the price scale for convenient monitoring.
Key Features:
Customizable Fractals: Choose between 3-bar or 5-bar fractals (default: 3-bar).
Period: Adjust the number of periods for calculation
Visualization: Red lines for highs (resistance), green for lows (support). Lines are fixed on the chart and persist during scrolling or scaling changes.
Alert System: Notifications for the formation of a new fractal high/low and for level breaks (Fractal High Formed, Fractal Low Formed, Fractal High Broken, Fractal Low Broken).
How to Use:
Add the indicator to the chart.
Configure parameters: select the fractal type (3 or 5 bars) and period.
Set up alerts in TradingView to receive notifications about new fractals or breaks.
Use the lines as levels for entry/exit positions, stop-losses, or take-profits in fractal-based strategies.
Troubleshooting: If Levels Are Not Fixed on the Chart
If the levels (fractal lines) do not stay fixed on the chart and fail to move with it during scrolling or scaling (e.g., they remain stationary while the chart shifts), this is typically due to the indicator's scale settings in TradingView. The indicator may be set to "No scale," causing the lines to desynchronize from the chart's price scale.
What to Do:
Locate the Indicator Label: On the chart, find the indicator label in the top-left corner of the pane (or where "BoaBias Fractals High & Lows" is displayed).
Right-Click the Label: Click the right mouse button on this label.
Adjust the Scale:
In the context menu, look for the "Scale" or "Pin to scale" option.
If it shows "Pin to scale (now no scale)" or similar, select "Pin to right scale" (or "Pin to left scale," depending on your chart's main price scale—usually the right).
Refresh the Chart: After changing the setting, refresh the chart (press F5 or reload the page), or toggle the indicator off and on again to apply the changes.
After this, the lines should move and scale with the chart during scrolling (horizontal or vertical) or zooming. If the issue persists, check:
TradingView Limits: The indicator may draw too many lines (maximum ~500 per script). If there are many historical fractals, older lines might not display.
Chart Settings: Ensure the chart is not in logarithmic scale (if applicable) or that auto-scaling is enabled.
Indicator Version: Verify you are using the latest script version (Pine Script v6) and check for errors in the TradingView console.
This indicator is ideal for traders working with Bill Williams' chaos theory or those seeking dynamic support/resistance levels. It is based on standard fractals but with enhancements for convenience: automatic removal of broken levels and integration with the price scale.
Note: The indicator does not provide trading signals on its own — use it in combination with other tools. Test on historical data before real trading.
Code written in Pine Script v6. Original template: Mit Nayi.

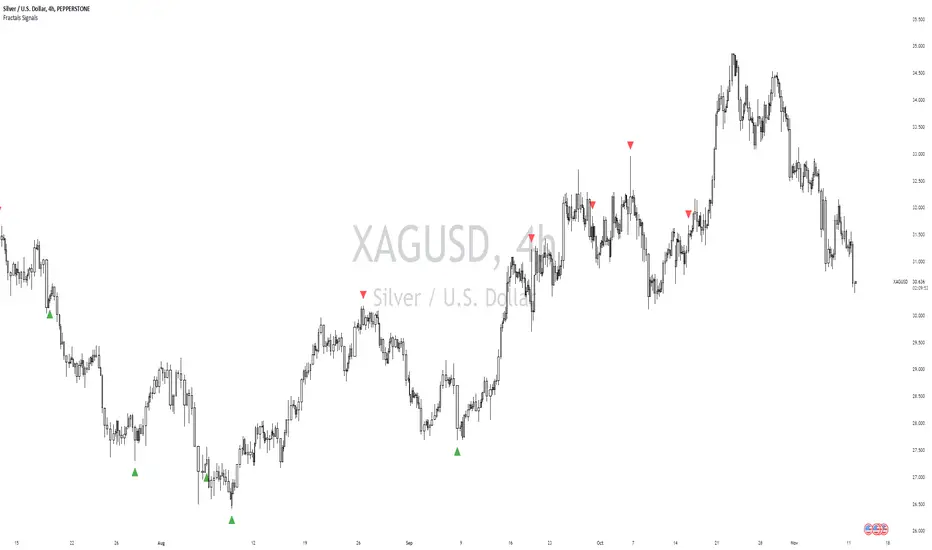
William Fractals + SignalsWilliams Fractals + Trading Signals
This indicator identifies Williams Fractals and generates trading signals based on price sweeps of these fractal levels.
Williams Fractals are specific candlestick patterns that identify potential market turning points. Each fractal requires a minimum of 5 bars (2 before, 1 center, 2 after), though this indicator allows you to customize the number of bars checked.
Up Fractal (High Point) forms when you have a center bar whose HIGH is higher than the highs of 'n' bars before and after it. For example, with n=2, you'd see a pattern where the center bar's high is higher than 2 bars before and 2 bars after it. The indicator also recognizes patterns where up to 4 bars after the center can have equal highs before requiring a lower high.
Down Fractal (Low Point) forms when you have a center bar whose LOW is lower than the lows of 'n' bars before and after it. For example, with n=2, you'd see a pattern where the center bar's low is lower than 2 bars before and 2 bars after it. The indicator also recognizes patterns where up to 4 bars after the center can have equal lows before requiring a higher low.
Trading Signals:
The indicator generates signals when price "sweeps" these fractal levels:
Buy Signal (Green Triangle) triggers when price sweeps a down fractal. This requires price to go BELOW the down fractal's low level and then CLOSE ABOVE it . This pattern often indicates a failed breakdown and potential reversal upward.
Sell Signal (Red Triangle) triggers when price sweeps an up fractal. This requires price to go ABOVE the up fractal's high level and then CLOSE BELOW it. This pattern often indicates a failed breakout and potential reversal downward.
Customizable Settings:
1. Periods (default: 10) - How many bars to check before and after the center bar (minimum value: 2)
2. Maximum Stored Fractals (default: 1) - How many fractal levels to keep in memory. Older levels are removed when this limit is reached to prevent excessive signals and maintain indicator performance.
Important Notes:
• The indicator checks the actual HIGH and LOW prices of each bar, not just closing prices
• Fractal levels are automatically removed after generating a signal to prevent repeated triggers
• Signals are only generated on bar close to avoid false triggers
• Alerts include the ticker symbol and the exact price level where the sweep occurred
Common Use Cases:
• Identifying potential reversal points
• Finding stop-hunt levels where price might reverse
• Setting stop-loss levels above up fractals or below down fractals
• Trading failed breakouts/breakdowns at fractal levels
MTF Fibonacci Pivots with Mandelbrot FractalsMTF Fibonacci Pivots with Mandelbrot Fractals: Advanced Market Structure Analysis
Overview
The MTF Fibonacci Pivots with Mandelbrot Fractals indicator represents a significant advancement in technical analysis by combining multi-timeframe Fibonacci pivot levels with sophisticated fractal pattern recognition. This powerful tool identifies key support and resistance zones while predicting potential price reversals with remarkable accuracy.
Key Capabilities
This indicator provides traders with three distinct layers of market structure analysis:
Automatic Timeframe Adaptation: The primary pivot set automatically adjusts to your chart's timeframe, ensuring relevant support and resistance levels for your specific trading horizon.
1-Year Fibonacci Pivots: The second layer displays yearly pivots that reveal long-term market cycles and institutional price levels that often act as significant reversal points.
3-Year Fibonacci Pivots: The third layer unveils major market structure zones that typically remain relevant for extended periods, offering strategic context for position trading and long-term investment decisions.
Predictive Technology
What truly distinguishes this indicator is its advanced predictive capability powered by:
Mandelbrot Fractal Pattern Recognition: The indicator implements a sophisticated fractal detection algorithm that identifies recurring price patterns across multiple timeframes. Unlike conventional fractal indicators, it incorporates noise filtering and adaptive sensitivity to market volatility.
Tesla's 3-6-9 Principle Integration: The system incorporates Nikola Tesla's mathematical principle through a cubic Mandelbrot equation (Z_{n+1} = Z_n^3 + C where Z_0 = 0), creating a unique approach to pattern recognition that aligns with natural market rhythms.
Historical Pattern Matching: When a current price pattern exhibits strong similarity to historical formations, the indicator generates predictive targets with confidence ratings. Each prediction undergoes rigorous validation against multiple parameters including trend alignment, volatility context, and mathematical coherence.
Visual Intelligence System
The indicator's visual presentation enhances trading decision-making through:
Confidence-Based Visualization: Predictions display with intuitive star ratings, percentage confidence scores, and contextual information including price movement magnitude and estimated time to target.
Adaptive Color Harmonization: The color system intelligently adjusts to provide optimal visibility while maintaining a professional appearance suitable for any chart setup.
Trend Alignment Indicators: Each prediction includes references to the broader trend context, helping traders avoid counter-trend trades unless the reversal signal carries exceptional strength.
Strategic Applications
This indicator excels in multiple trading scenarios:
Intraday Trading: Identify high-probability reversal zones with precise timing
Swing Trading: Anticipate significant market turns at key structural levels
Position Trading: Recognize major cycle shifts for strategic entry and exit
The automatic 1-year and 3-year Fibonacci pivots provide institutional-grade reference points that typically define major market movements. These longer timeframes reveal critical zones that might be invisible on shorter-term analysis, giving you a significant edge in understanding where price is likely to encounter substantial buying or selling pressure.
This innovative approach to market analysis combines classical Fibonacci mathematics with cutting-edge fractal theory to create a comprehensive market structure visualization system that illuminates both present support/resistance levels and future price targets with exceptional clarity.
Setting Up MTF Fibonacci Pivots with Mandelbrot Fractals
Initial Setup
Adding this indicator to your TradingView charts is straightforward:
Navigate to the "Indicators" button on your chart toolbar
Search for "MTF Fibonacci Pivots with Mandelbrot Fractals"
Select the indicator to add it to your chart
A configuration panel will appear with various setting categories
Recommended Settings
The indicator comes pre-configured with optimal default settings, but you may want to adjust them based on your trading style:
For Day Trading (Timeframes 1-minute to 1-hour)
Pivots Timeframe 1: Auto (automatically adapts to your chart)
Pivots Timeframe 2: Daily
Pivots Timeframe 3: Weekly
Fractal Sensitivity: 2-3
Fractal Lookback Period: 20
Prediction Strength: 2
Color Theme: High Contrast or Dark Mode
For Swing Trading (Timeframes 4-hour to Daily)
Pivots Timeframe 1: Daily
Pivots Timeframe 2: Weekly
Pivots Timeframe 3: Monthly
Fractal Sensitivity: 1-2
Fractal Lookback Period: 30
Prediction Strength: 2-3
Color Theme: Default or Dimmed
For Position Trading (Timeframes Daily to Weekly)
Pivots Timeframe 1: Weekly
Pivots Timeframe 2: Monthly
Pivots Timeframe 3: Quarterly
Fractal Sensitivity: 1
Fractal Lookback Period: 50
Prediction Strength: 1
Color Theme: Monochrome or Pastel
Restoring Default Settings
If you've adjusted settings and wish to return to the defaults:
Right-click on the indicator name on your chart
Select "Settings" from the context menu
In the settings dialog, look for the "Reset All" button at the bottom
Confirm the reset when prompted
Alternatively, you can remove the indicator and add it again for a fresh start with default settings.
Advanced Settings Guidance
Visual Appearance
Use Gradient Colors: Enable for better visual differentiation between pivot levels
Color Transparency: 15% provides an optimal balance between visibility and chart clutter
Line Width: 1-2 for cleaner charts, 3+ for enhanced visibility
Fractal Analysis
Enable Fractal Analysis: Keep enabled for prediction capabilities
Fractal Box Spacing: Higher values (5-10) for cleaner displays, lower values (1-3) for more signals
Maximum Forecast Bars: 20 is optimal for most timeframes, adjust higher for longer predictions
Performance Considerations
Enable Self-Optimization: Keep enabled to maintain smooth chart performance
Resource Priority: Use "Balanced" for most computers, "Performance" for older systems
Force Pivot Display: Enable only when checking specific historical periods
Common Setup Mistakes to Avoid
Setting all timeframes too close together (e.g., Daily, Daily, Weekly) reduces the multi-timeframe advantage
Using high fractal sensitivity (4+) on noisy markets creates excessive signals
Setting fractal box spacing too low causes cluttered prediction boxes
Disabling self-optimization may cause performance issues on complex charts
Using incompatible color themes for your chart background reduces visibility
The indicator's power comes from its default 1-year and 3-year Fibonacci pivot settings, which highlight institutional levels while the auto-timeframe setting adapts to your trading horizon. These carefully balanced defaults provide an excellent starting point for most traders.
For optimal results, I recommend making minimal adjustments at first, then gradually customizing settings as you become familiar with the indicator's behavior in your specific markets and timeframes.
Screenshots:

Williams Fractals with Buy/Sell Signals🧠 Concept:
This indicator is based on the concept of fractal swing highs and lows, commonly used in Bill Williams’ trading methods. A fractal forms when a candle’s high or low is higher/lower than a set number of candles on both sides. This structure helps identify local market turning points.
⚙️ Inputs:
Fractal Sensitivity (swingSensitivity):
Number of candles required on each side of the central bar to validate a fractal.
For example, if set to 2, a swing high is detected when a bar’s high is higher than the previous 2 bars and the next 2 bars.
✅ Features:
Fractal Detection:
Plots white triangles above swing highs (down fractals).
Plots white triangles below swing lows (up fractals).
Buy/Sell Signals:
Buy Signal: Triggered when the candle closes above the most recent down fractal.
Sell Signal: Triggered when the candle closes below the most recent up fractal.
Signals alternate — a Buy must follow a Sell and vice versa to reduce noise.
Signal Labels:
"BUY" label appears below the candle in green.
"SELL" label appears above the candle in red.
Alerts:
Real-time alerts are available for both Buy and Sell signals via alertcondition().
📌 Use Case:
This indicator can help you:
Detect short-term reversals.
Confirm breakouts or structure shifts.
Time entries with clear logic based on price action.
TIME-SPLT ACADEMY INDICATOR# TIME-SPLT ACADEMY CISD + FVG + TSM FRACTALS - Comprehensive Market Structure Analysis Tool
## Overview
This indicator combines three essential market structure analysis components into a unified trading tool: Change in State Direction (CISD), Fair Value Gaps (FVG), and TSM Fractals. This integration provides traders with a complete framework for identifying market structure breaks, price imbalances, and key pivot levels on any timeframe.
## Component 1: CISD (Change in State Direction)
**What it is:** CISD identifies significant breaks in market structure by tracking when price decisively breaks above previous swing highs (bullish CISD) or below previous swing lows (bearish CISD). This concept is fundamental to understanding trend changes and continuation patterns.
**How it works:**
- Monitors swing highs and lows using customizable pivot periods
- Tracks when price closes above a previous swing high (bullish structure break)
- Tracks when price closes below a previous swing low (bearish structure break)
- Draws horizontal lines from the pivot point to the break point with "CISD" labels
- Works on multiple timeframes simultaneously
**Trading Applications:**
- Identifies trend changes and continuation signals
- Provides entry signals on structure breaks
- Helps determine market bias and direction
## Component 2: FVG (Fair Value Gaps)
**What it is:** Fair Value Gaps are price imbalances that occur when there's a gap between the high of one candle and the low of another candle two periods later, with the middle candle not filling this gap. These represent areas where price moved inefficiently and often return to "fill" the gap.
**How it works:**
- Analyzes 3-candle patterns to identify gaps
- Bearish FVG: Gap between low and high where price dropped leaving unfilled space above
- Bullish FVG: Gap between high and low where price rose leaving unfilled space below
- Tracks 8 different candle body combinations for each direction (up, down, doji patterns)
- Monitors gap mitigation when price returns to fill the imbalance
- Changes color when gaps are partially or fully mitigated
**Gap Detection Logic:**
- Bearish FVG patterns: DDD, DDJ, JDD, UDJ, JDU, UDD, DDU, UDU
- Bullish FVG patterns: DUD, DUJ, JUD, UUJ, JUU, UUD, DUU, UUU
- (D=Down candle, U=Up candle, J=Doji candle)
**Trading Applications:**
- High-probability reversal zones when price returns to FVGs
- Support and resistance levels
- Target areas for limit orders
- Risk management reference points
## Component 3: TSM Fractals
**What it is:** TSM Fractals identify significant pivot highs and lows using Williams Fractal methodology. These mark potential reversal points and key support/resistance levels.
**How it works:**
- Identifies fractal highs: peaks where the center candle's high is higher than surrounding candles
- Identifies fractal lows: valleys where the center candle's low is lower than surrounding candles
- Uses customizable lookback periods (default 15) for fractal identification
- Displays horizontal lines with "$" symbols at fractal levels
- Maintains a configurable number of recent fractals on the chart
**Trading Applications:**
- Key support and resistance levels
- Potential reversal zones
- Confluence with other analysis tools
- Stop loss placement reference points
## Why This Combination Works
**Synergistic Analysis:** Each component provides different but complementary information:
1. **CISD** shows when market structure changes, indicating trend shifts or continuation
2. **FVGs** reveal where price has moved inefficiently and may return for rebalancing
3. **Fractals** highlight key pivot points that often act as support/resistance
**Trading Edge:** The combination allows for:
- **Entry Confirmation:** Wait for CISD breaks near unfilled FVGs at fractal levels
- **Risk Management:** Use FVG boundaries and fractal levels for stop placement
- **Target Selection:** Project moves to opposite FVGs or fractal levels
- **Market Context:** Understand whether you're trading with or against structure
## Key Features
**Multi-Timeframe CISD:**
- Customizable timeframe settings (Minute, Hour, Day, Week, Month)
- Adjustable swing length for pivot identification
- Customizable line styles, widths, and colors
- Optional alerts on structure breaks
**Advanced FVG Management:**
- Automatic gap size filtering
- Real-time mitigation tracking
- Color-coded active vs. mitigated gaps
- Optional pip value labels
- Large gap alerts for significant imbalances
**Intelligent Fractal Display:**
- Configurable fractal periods
- Maximum fractal count management
- Clean visual presentation
- Historical fractal preservation
## Settings & Customization
**CISD Settings:**
- Timeframe selection and multipliers
- Swing length adjustment (default 7)
- Line styling options
- Color customization for bullish/bearish breaks
- Alert toggle options
**FVG Settings:**
- Show/hide toggles for each direction
- Minimum gap size filtering
- Alert threshold for large gaps
- Color schemes for active and mitigated gaps
- Optional size labels in pips
**Fractal Settings:**
- Fractal period adjustment (default 15)
- Maximum display count (default 10)
- Show/hide toggle
## Educational Value
This indicator teaches traders to:
- Understand market structure concepts
- Recognize price inefficiencies
- Identify key pivot points
- Combine multiple analysis methods
- Develop systematic trading approaches
## Use Cases
**Swing Trading:** Identify major structure breaks with FVG confluence
**Day Trading:** Use lower timeframe CISDs with intraday FVGs
**Scalping:** Quick entries at FVG mitigation near fractal levels
**Position Trading:** Higher timeframe structure analysis with major FVGs
## Technical Implementation
- Utilizes Pine Script v6 for optimal performance
- Efficient array management for historical data
- Real-time calculations without repainting
- Memory-optimized box and line management
- Multi-timeframe data handling with proper security functions
This comprehensive tool eliminates the need for multiple separate indicators, providing everything needed for complete market structure analysis in one cohesive package. The educational component helps traders understand not just what the signals are, but why they work and how to use them effectively in different market conditions.

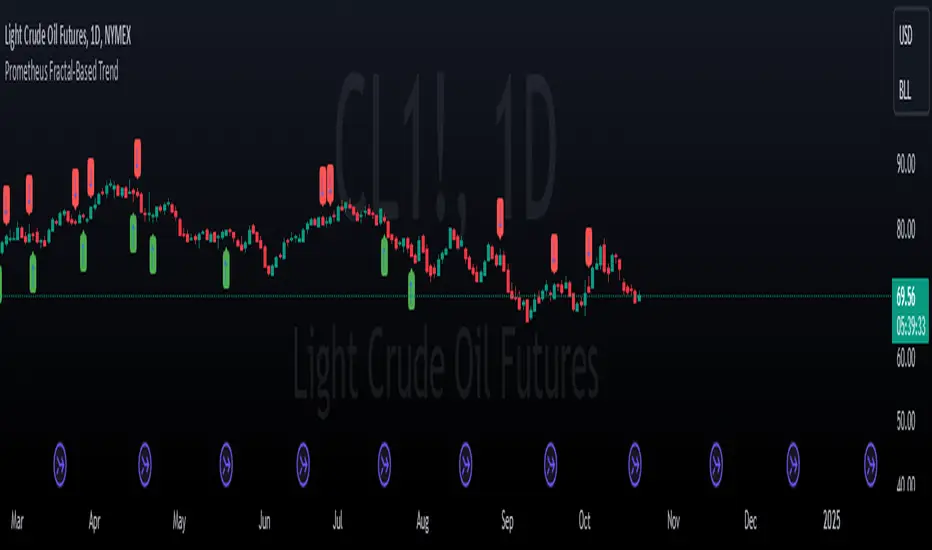
Prometheus Fractal-Based TrendThe Fractal-Based Trend indicator is a tool that uses fractals to try and detect which direction an underlying will continue to go.
Calculation:
A bullish fractal occurs when the current bar's high is lower than the previous bar high, and the previous bar's high is higher than both the high from two bars ago and the high from three bars ago.
A bearish fractal happens when the current bar's low is higher than the previous bar's low, and the previous bar's low is lower than both the low from two bars ago and the low from three bars ago.
When a bullish or bearish fractal forms, the corresponding value stored is the previous bar high for a bearish fractal or the previous bar's low for a bullish fractal.
The trade scenarios are when these fractals occur, a green or red label being plotted on the chart for whatever direction it predicts.
Trade examples:
We see on this daily chart of AMEX:SPY that the fractals represent the potential for a directional trade that can last a few days. The more volatile a chart is the more of these fractals we can see.
We see on this 5 minute chart for NASDAQ:TSLA there is way more activity, there are more sporadic candles on a lower time frame, so we can see more anomalies in the price action.
We see this to be true for BITSTAMP:BTCUSD even on a daily time frame, since it is very volatile. There are a lot of these labels plotted.
This is the perspective we aim to provide. We encourage traders to not follow indicators blindly. No indicator is 100% accurate. This one can give you a different perspective of price strength with volatility. We encourage any comments about desired updates or criticism!
[HM] Fibonacci Fractals Absolute Auto v20221114Basically:
F - Fibonacci levels
F - fractals: retracement of retracement
A - absolute: based on two fixed points instead user chosen Fibonacci points
A - auto: automatically draws based on volatility
Explanation:
This script will automatically trace TWO Fibonacci levels from these points:
- ALL TIME HIGH (ATH) and ALL TIME LOW ( ATL ) prices
This is our first Fibonacci FRACTAL retracement and the line caption will show ONE character:
"↥" for 0.618
"↧" for 0.382
The FRACTAL with two lines will define THREE regions.
The second Fibonacci FRACTAL retracement will show TWO characters:
the same "↥" "↧" characters with:
"a" if the price is between TOP region of previous fractal
"b" if the price is between MIDDLE region of previous fractal
"c" if the price is between BOTTOM region of previous fractal
The third Fibonacci FRACTAL will show THREE characters and so on.
Delimited by volatility (otherwise this script will go to 10th fractal maximum).
OPTIONS to give a try:
- use ALL TIME HIGH and ZERO prices (instead ATH and ATL )
- use a non-Fibonacci retracement:
---> "⅓": 1/3 and 2/3 levels instead 0.618 and 0.382 (based on chess master Hindenburg Melão article hint)
---> "fibonaccing": 0.764 and 0.236 levels (based on Brazilian trader Marco Antonio Rossi method hint)
#script under development, sugestions and questions are welcome.

Williams Fractals with Alerts by MrTuanDoanCustom William Fractals for alerts and educational purpose.
Added custom alerts for Williams Fractals.
Also added filter to show less fractals on chart.
The simple idea how I use fractals in Binary Option is to determine temporary resistance and support.
Simple strategy:
- Mark Resistance/Support on higher time frame (e.g. 5M)
- Set an alert for new fractal
- Whenever a new fractal that appears close to your marked Resistance/Support, go to lower time frame (e.g. 1M)
- Wait for rejection at the level that lower than new down fractal (or higher than new up fractal).
- Enter with the same expiry of lower time frame.
Good luck and happy trading. :-)

All-in-One (PHT)All-in-One (PHT) — Modular Multi-Tool Market Analyzer (Pine Script v6)
All-in-One (PHT) is a complete, modular market-analysis toolkit designed for traders who want clean, reliable, and professional-grade charting - in a single indicator.
Built using Pine Script® v6 and structured with reusable PHT-Libraries (EMA Band, Bollinger Band, Fractal, Session), this indicator delivers clarity, precision, and consistent performance across all markets and timeframes.
Unlike traditional indicators that mix logic and visuals, AIO (PHT) uses a fully modular architecture. All calculations come from dedicated libraries, and this main script focuses purely on visual output and clean plotting.
This ensures:
Stable plot references
Zero repainting in all included modules
High performance even with complex overlays
Easy extensibility for future upgrades
🔥 Included Modules
1. EMA Band (PHT Library)
A triple-EMA band designed for trend clarity and structure.
Provides:
EMA of High
EMA of Close
EMA of Low
Band fill visualization
Ideal for identifying trend strength, momentum pockets, and mean-reversion zones.
2. Bollinger Band Suite
A complete Bollinger framework with:
SMA / EMA / WMA midline options
Dual standard-deviation envelopes
Multi-zone band fills (upper, middle, lower)
User-controlled visibility for each layer
Perfect for volatility detection, squeeze identification, and precision envelope trading.
3. Fractal Engine (High/Low Pivots)
Fast, reliable fractal detection using user-defined left/right periods.
Features:
Pivot Highs & Pivot Lows
Multiple marker sizes (Tiny → Large)
Zero-lag plotting with proper offset handling
Useful for swing structure, breakout confirmation, and automated level marking.
4. Market Session Tracker
A powerful session-mapping module that visually highlights market sessions with:
Dynamic session boxes
High & Low markers
Persistent historical sessions
Auto-managed labels, lines, and live updates
Timezone-aware session boundaries (supports IANA zones)
Designed for identifying daily ranges, session liquidity, volatility pockets, and market timing.
🧠 Why This Indicator Is Different
Most “all-in-one” tools mix plotting, logic, and calculations in a single heavy script, causing lag, reference instability, and repainting issues.
All-in-One (PHT) solves this by using a Pine v6 library architecture:
Each component is computed in its own library
The main script handles only visuals
No hidden code, no repainting tricks
Maximum clarity and maintainability
This design mirrors professional software architecture:
clear separation of logic, visuals, and user interface.
🎯 Ideal For
Trend traders
Scalpers & intraday traders
Swing and positional traders
Volatility analysts
Structure-based price action traders
Anyone who wants multiple high-quality tools in one clean indicator
Whether you analyze markets manually or build algorithmic systems, AIO (PHT) provides a solid foundation.
⚙️ Features at a Glance
Fully modular Pine v6 design
Complete EMA band engine
Advanced Bollinger band system (multi-deviation, multi-fill)
Configurable fractal high/low markers
Smart session boxing with history
Clean visuals and transparent settings
No repainting
Fully customizable colors & visibility
Optimized for performance
💡 How to Use
Choose the modules you want to display (EMA, BB, Fractals, Sessions).
Adjust lengths, deviations, or fractal periods as per your trading style.
Use session boxes to understand volatility timing.
Combine bands + fractals for advanced structure-based decisions.
The indicator is designed to overlay on price for maximum clarity.
🚀 Future Upgrades
The PHT framework supports smooth future expansion. Planned modules include:
ATR/volatility engines
Trend switches
Supertrend/Donchian plugins
Volume profile extensions
Updates will remain backward compatible across all modules.
⭐ Summary
All-in-One (PHT) is not just another overlay — it’s a complete multi-tool trading framework built using professional engineering practices in Pine Script v6.
If you want cleaner charts, smarter signals, and a high-performance modular system, this indicator gives you everything in one reliable package.

ST Fractals With Percentage DifferenceThis indicator identifies Williams Fractals on your price chart, helping traders spot potential reversal points and short-term highs and lows. This changes default value to 1 and adds percentage difference similar to ST Fractals option on MT5
How It Works:
Up Fractals (▲): Plotted above a candle that is higher than its surrounding candles — a potential short-term top.
Down Fractals (▼): Plotted below a candle that is lower than its surrounding candles — a potential short-term bottom.
Fractals are only drawn if the price difference from the next candle exceeds a minimum percentage, to avoid signals caused by small fluctuations.
The script ensures that both up and down fractals never appear on the same candle, keeping your chart clear.
Settings:
Periods (n): Determines how many candles before and after are considered to find a fractal. Default: 2.
Min % Difference: Filters out insignificant fractals by requiring a minimum difference from the next candle. Default: 0.01%.
Usage Tips:
Can be used to identify support and resistance levels.
Often combined with trend indicators or moving averages to confirm reversals.
Works best in markets with clear trends or volatility, rather than very flat markets.
Visuals:
Green triangle ▲ → Up Fractal (potential top)
Red triangle ▼ → Down Fractal (potential bottom)
