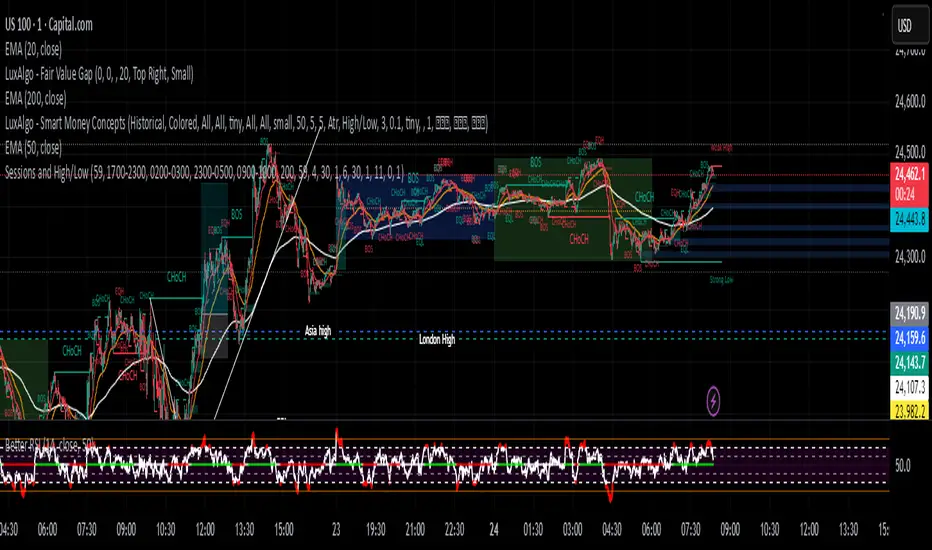
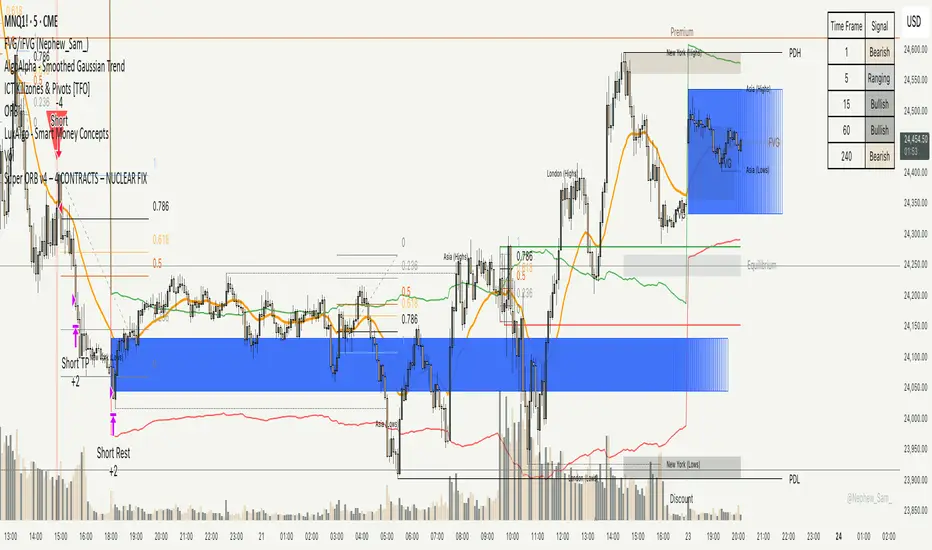
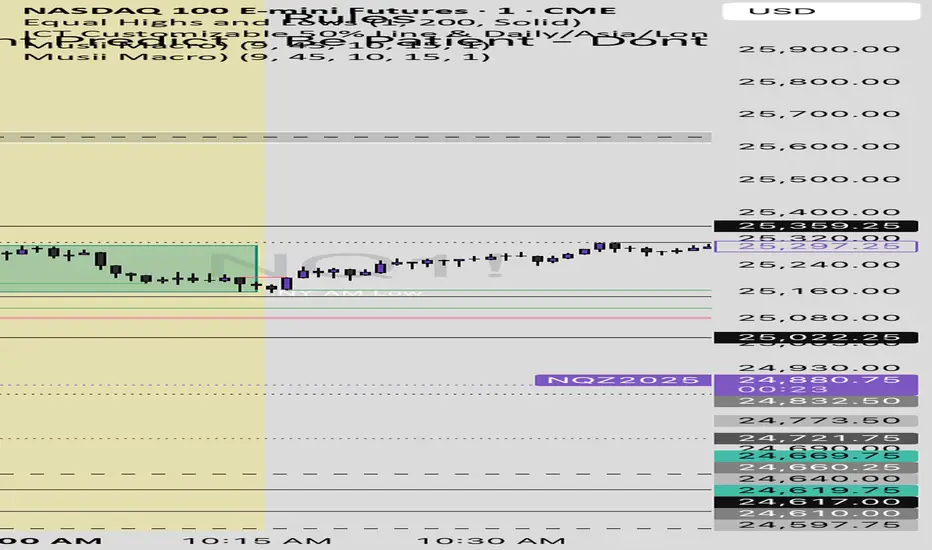
Trading Sessions Low and HighVisualize and analyze different trading sessions (Tokyo, London, New York) on your charts.
Key Features:
Colored Session Zones: Displays colored rectangles to visually identify each active trading session
Smart High/Low Lines:
Draws horizontal lines at the highest and lowest points of each session
These lines automatically extend forward in time until a candle crosses them
Helps identify support/resistance levels created during each session
Detailed Session Information:
Range (difference between highest and lowest points)
Average price of the session
Open and close lines
Full Customization:
Choose the number of historical sessions to display (e.g., last 10, 20 sessions)
Line style and width for high/low lines
Enable/disable each element independently
Trading Benefits:
Identify liquidity zones created during each session
Spot key levels that continue to influence price after a session closes
Analyze volatility and price behavior across different sessions
Detect breakouts of important levels established during previous sessions
Indicador Pine Script®