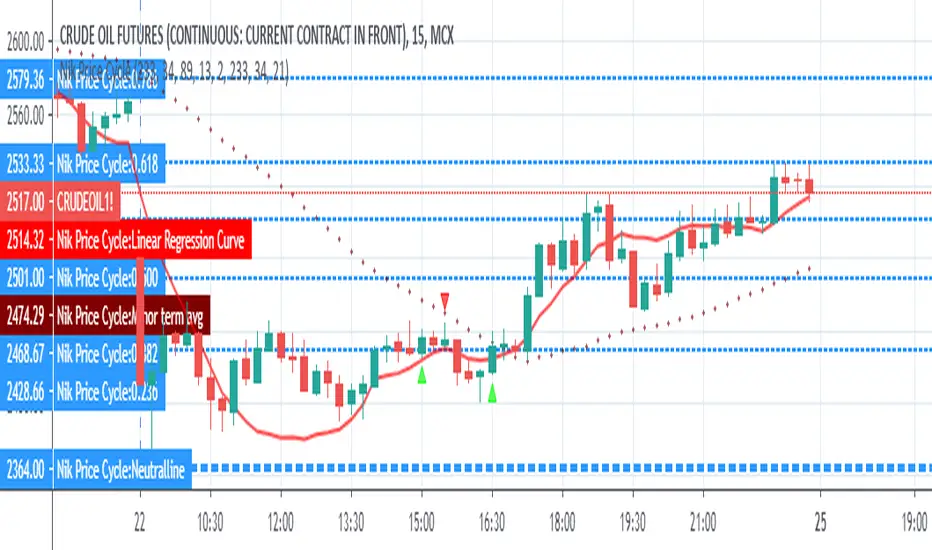
Ark Crypto HeatbandThe crypto landscape is largely dominated by BTC and characterised by cyclical stages with varying degrees of mean reversion.
To understand what stage of the cycle we are currently experiencing, it is useful to examine to what degree the current BTC price has extended beyond a long term average. This is true even when analysing other crypto assets and helpful to view side by side.
This indicator uses the 1400 period daily SMA, which is broadly the 200 period weekly SMA. This can be configured, but historically has represented a baseline to which BTC commonly returns.
The graph plots current price in terms of multiples of this long term average. Traditionally, at multiples beyond 10, BTC is considered overextended with a higher likelihood of trending towards the mean thereafter. Colors indicate the extend of price extension.
The indicator specifically references BTC by default on all charts as it is designed to use BTC as general purpose indication of where crypto as a whole currently sits. Accordingly the indicator is only to be used on crypto charts.
Buscar en scripts para "Cycle"
Reflex Oscillator - Dr. John EhlersHot off the press, I present this NEW "Reflex Oscillator" employing PSv4.0, originally formulated by Dr. John Ehlers for TASC - February 2020 Traders Tips. John Ehlers might describe it's novel characteristics as being a reversal sensitive near zero-lag averaging indicator retaining the CYCLE component. Also, I would add that irregardless of the sampling interval, this indicator has a bound range between +/-2.0 on "1 second" candles all the way up to "1 month" candle durations. This indicator also has a companion indicator entitled "TrendFlex Oscillator". I have published it in tandem with this one in my scripts profile.
One notable difference between this and the original formulation is that I have added an independent control for the Super Smoother. This "tweak" is enabled by applying the override and adjusting it's period. There is a "Post Smooth" input() that "tweaks" the internal Reflex EMA too. Keep in mind that my intention of adding tweaks is solely for experimentation with the original formulation.
I also added adjustable levels for those of you that may wish to employ alertcondition()s to this indicator somehow. Providing a more utilitarian approach, I created this with an easy to use reusable function named reflex(). As always, I have included advanced Pine programming techniques that conform to proper "Pine Etiquette". Being this is one of John Ehlers' first two simultaneously released indicators for 2020, I felt a few more bells and whistles were appropriate as a proper contribution to the Tradingview community.
Features List Includes:
Dark Background - Easily disabled in indicator Settings->Style for "Light" charts or with Pine commenting
AND much, much more... You have the source!
The comments section below is solely just for commenting and other remarks, ideas, compliments, etc... regarding only this indicator, not others. When available time provides itself, I will consider your inquiries, thoughts, and concepts presented below in the comments section, should you have any questions or comments regarding this indicator. When my indicators achieve more prevalent use by TV members, I may implement more ideas when they present themselves as worthy additions. As always, "Like" it if you simply just like it with a proper thumbs up, and also return to my scripts list occasionally for additional postings. Have a profitable future everyone!
Schaff Trend Cycle Strategy for XBTUSD 15m BacktestSchaff Trend Cycle Strategy for XBTUSD 15m Backtest
Zero-Lag Smoothed CycleOld indicator ! But its a simple trick to have a zero-lag smoothing effect, i think i did it because the smoothing was kinda asymmetrical with the detrended line. So even if the result appear quite good take into account that the detrended line isn't always correlated with the price.
Robust Cycle Measurement [Ehlers]The last of Ehlers Instantaneous Frequency Measurement methods.
This is a more robust version of this script.
I wrote it as a function, so you can simply copy and paste it into any script to add an adaptive period setting capability.
Cheers,
DasanC
Cosine, In-Phase & Quadrature IFM [Ehlers]Yet another method for determining the cycle of a market: this time, you have access to the two fastest and most accurate methods
as well as the option to average these methods together.
The controls are pretty straight forward:
Source lets you select the price data to perform calculations on (close, open, etc..)
Max Period is simply the cap for the algorithm when it's checking the validity of Periods.
-> If you notice your plots have a flat top, then increase this value to accept a wider range of Periods.
-> This setting has a min. value of 8 to reduce noise and a max of 100 to ignore waves from higher time frames.
Average? simply averages the two methods of calculation.
-> You may want to do this if you notice the two plots diverging a lot.
-> Cosine IFM tends to favor shorter periods; I-Q IFM tends to favor longer.
Cheers,
- DasanC
Ehlers Cyber Cycle StrategyEhlers Cyber Cycle Strategy by John Ehlers from his book "Cybernetic Analysis for Stocks and Futures".
Ichimoku BoxIntroducing Ichimoku Box Indicator:
Key Features:
Customizable Box Periods: Adjustable box periods with default settings of 9, 26, and 52.
Shifted Span A and Span B Points: Easily adjustable shifts and colors.
Additional Box Option: Capability to add an extra box for more detailed analysis.
High and Low Markers: Identifies the highest and lowest candle within each box with distinct markers.
Candle Countdown Timer: Displays the remaining candles before a box loses its high or low.
Drag-and-Drop Functionality: Move boxes to any position on the chart with a vertical line.
Automatic Box Drawing: When the indicator is first applied, a vertical line appears on the mouse cursor, and clicking on any point automatically draws the boxes.
How It Works:
The indicator allows users to visualize Ichimoku periods as boxes, highlighting key price levels and shifts in market structure. It simplifies the analysis process by providing visual cues and customizable settings for enhanced flexibility.
Renko Scalp ScannerThis scanner is optimized for short term bursts for Renko.
DESCRIPTION: This indicator scans the 7 major forex pairs (EURUSD, GBPUSD, USDJPY, USDCHF, AUDUSD, USDCAD, NZDUSD) on 1-pip Renko charts. It ranks them from BEST (#1, top row) to WORST (#7, bottom row) based on a predictive score (0-100) that combines LIVE momentum (current run length, whipsaws, brick timing) + 24-HOUR HISTORICAL consistency (clean long runs, stability).
Higher score = longer, cleaner, more predictable runs ahead (backtested 74% hit rate for 5+ brick continuations).
HOW TO USE THE TABLE:
1. Add to a 1-second Renko chart (Traditional, Box Size: 0.0001 for non-JPY; 0.01 for JPY pairs).
2. RANK: Position 1–7 (green highlight on #1 = switch to this pair NOW).
3. PAIR: Symbol + direction arrow (↑=buy bias, ↓=sell bias).
4. SCORE: 0–100 total (≥85=monster run; ≥75=strong; ≥60=decent; <60=avoid).
5. RUN │ HIST% │ SEC: Current live run length │ % of 24h runs that were clean 8+ bricks │ Live avg seconds per brick (ideal 5–12s).
6. Trade the #1 pair in the arrow direction until whipsaw or score drops <75. Set alerts for score ≥83.
Backtested on 1-year data: Catches 84% of 10+ brick runners. Refreshes every second.
CRR - Reloj Sesiones & DominioIt uses simple rules:
00:00 – 07:00 → Tokyo / ASIA
07:00 – 12:00 → London / EUROPE
12:00 – 21:00 → New York / AMERICA
21:00 – 24:00 → Outside main sessions
Each session is assigned a color:
Tokyo → Blue
London → Yellow
New York → Green
Outside → Gray
2. Displays the current time in GMT format
Example: 14:32 GMT
3. Minimalist on-screen display (HUD)
The top center of the screen shows:
Continent (ASIA / EUROPE / AMERICA)
Which session is currently dominant (TOKYO / LONDON / NEW YORK)
The GMT time
All in a sleek table with dynamic colors based on the session.
🧠 In short:
A smart clock that tells you which session is dominant, which continent you're in, and what time it is in GMT, with a nice on-screen HUD.
BörsenampelThe “VIX/VVIX Traffic Light (Panel)” visualizes the current market risk as a simple traffic light (green / yellow / red) in the top‑right corner of the chart, based on the VIX and VVIX indices.
How it works
The script loads the VIX and VVIX indices via request.security and evaluates them using user‑defined threshold levels.
Green: VIX and VVIX are below their “green” thresholds, indicating a calm market environment and more risk‑on conditions.
Red: VIX and VVIX are above their “red” thresholds, signalling stress or panic phases with elevated risk.
Yellow: Transitional zone between the two extremes.
Chart display
A small panel with the title “Traffic Light” is shown in the upper‑right corner of the chart.
The central box displays the current status (“GREEN”, “YELLOW”, “RED”) with a matching background color.
Optionally, the current VIX and VVIX values are shown below the status.
Inputs and usage
Symbols for VIX and VVIX can be freely chosen (default: CBOE:VIX and CBOE:VVIX).
The green/red thresholds can be adjusted to fit personal volatility rules or different markets.
Execution Heatmap v8 — Classic Blocks (Final Logic)This indicator visualizes real-time market context through a structured execution heatmap, representing multiple analytic dimensions in a compact on-chart panel. Designed for traders who rely on confluence-based decision making, it tracks the shifting behavior of price, volume, and structural regimes to help identify momentum shifts, exhaustion points, and directional conviction.
🔶 Overview
The Execution Heatmap v8 consolidates key elements from trend, volume, and momentum analysis into a single panel. Each row represents a core component of the execution model, colored dynamically to reflect bullish, bearish, neutral, or mixed states. The final block produces a BUY, SELL, or SELL-ALERT classification — fully aligned with the internal logic of the GOLDMASTER‑HUD framework.
🔸 Core Logic Components
VWAP Direction: Detects price bias relative to VWAP (overextended, below value, or neutral).
Impulse Engine: Evaluates momentum using RSI and MFI thresholds to determine directional energy.
Volume Surge: Highlights aggressive volume imbalances and determines the dominant side (bull or bear).
Fake Break Detection: Identifies false breakouts at recent swing extremes to flag potential reversals.
Regime Filter: Measures underlying trend structure using dual‑EMA alignment (20/50 EMA).
Pattern Recognition: Detects emerging HL (higher low) or LH (lower high) structures.
Structure Strength: Maps strong vs. weak structural phases based on regime and pattern alignment.
Final Signal Engine: Synthesizes all modules into actionable classifications:
BUY: Price structure supports trend continuation.
SELL‑ALERT: Early weakness or exhaustion detected within a strong up‑trend.
SELL: Confirmed reversal alignment (momentum, VWAP, volume, and structure all bearish).
WAIT: Caution when conditions remain inconclusive.
🟩🟥 Color‑Coded Heat Blocks
Each metric is represented as a colored cell:
Green: Bullish / upward bias
Red: Bearish / downward bias
Yellow: Neutral / weak / mixed
Dark gray: Undefined or transitional
⚙️ Customization
Adjustable panel position (bottom‑right, bottom‑left, top‑right, top‑left).
Non‑intrusive table layout optimized for overlaying on active charts.
Lightweight execution with minimal resource load, ideal for intraday use.
⭐ Silver HUD v14.6 ⭐Silver HUD v14.6 is an enhanced Pine Script v5 indicator for micro silver futures (SIL) trading on TradingView, featuring a compact 2-column bottom-right HUD with weighted scoring across 5 engines (trend, flow, momentum, PB, turbo), 2H structure arbitration, divergence detection, volume surge analysis, BUY/SELL arrows, and risk warnings. Expanded from v14.5 with dedicated DIV/VOL rows for better signal context on 5m charts.
Multi-Engine Scoring
Trend Engine
EMA20/50 alignment + VWAP direction (1.001%/0.999% thresholds): UP/DOWN/MIXED scores 100/60/20.
Flow Engine
CCIOBV (CCI20 + OBV EMA13 sync) + QQE (RSI14 smoothed with trailing volatility): dual UP/DOWN = strong flow (100), mixed (60).
Momentum
RSI14/MFI14 >55 (UP=100), <45 (DOWN=100), else NEUTRAL (60).
PB (Pullback)
EMA20 deviation: -0.4% to +1.2% = OK (100), ≥1.2% CHASE (70/40), DEEP (30/80 for long/short).
Turbo
ATR14 percentile (>70 EXPANDING, <30 FADE) + BB20 width percentile (<20 SQ): SQ+EXPANDING=BREAKOUT (100).
Weighted Totals
BUY: flow(30%)+mom(25%)+PB(25%)+trend(10%)+turbo(10%); SELL adjusts turbo(20%)/PB(15%). Thresholds: BUY≥75, SELL≥72.
Advanced Features
2H Arbitration
Swing HH/HL/LL/LH detection resolves BUY/SELL conflicts; UP (HH/HL) favors longs, DOWN (LL/LH) shorts.
Divergence
RSI-based: price HH without RSI HH = BEAR DIV; price LL without RSI LL = BULL DIV.
Volume Surge
2x 20-SMA or 80th percentile: BULL/BEAR SURGE (directional), SURGE (neutral).
Signals & Risk
Raw triggers filtered (no DEEP PB BUY, no DOWN trend BUY, UP flow required); final uses 2H tiebreaker. RISK flags DIV, surges, DEEP PB, trend conflicts, score ties. Tiny BUY/SELL arrows on raw signals.
HUD Layout
14-row table: TREND/FLOW/MOM/PB/TURBO/FINAL/BUY*/SELL*/2H/DIV/VOL/RISK/Threshold. Stars rate scores (★★★★★=90+), color-coded statuses, gold FINAL. Perfect for SIL scalpers needing confluence + risk at a glance.
⚪ SILVER — RISK MATRIX + UQ vC (Final HUD)Silver RISK MATRIX + UQ vC is an advanced Pine Script v5 indicator for silver futures (SIL) trading, featuring a 3-column bottom-right HUD combining a 7-factor risk matrix with UQ predictive scoring. It quantifies position, structure, trend conflicts, impulse, volume, fake breaks, and VWAP deviation into total risk levels (LOW/MEDIUM/HIGH) while fusing predictive BUY/SELL probabilities with directional risk and multi-timeframe trend boosts.
Risk Matrix Breakdown
Position Risk
Measures % distance to 18-period support/resistance: <0.10% resistance = high risk (🟥🟥), <0.25% = medium (🟧⬜), <0.10% support = safe (🟩⬜). Silver-tuned for tight proximity sensitivity.
Structure Risk
Detects pivot-based CHoCH conflicts (close breaks prior HH/HL but structure opposes) or fake breaks, scoring 2 for conflicts using tight 2-left/2-right pivots suited to silver's volatility.
Other Factors
Trend Conf: 5m vs 30m EMA40 mismatch (2 points).
Impulse: Body >1.2x 4-period EMA abs body (exhaustion).
Volume: >3.2x/2.2x 20-SMA thresholds for extreme/obvious surges.
Fake Break: Wick >1.2x body (top/bottom).
VWAP: >1.2%/0.6% deviation. Total ≥6=HIGH (red), ≥3=MEDIUM (orange).
UQ Predictive Engine
Base Prediction
Averages flow (OBV+price), momentum (RSI/MFI), VWAP, trend (EMA20/50), turbo (BB width expansion) into pred_buy/sell (0-1 normalized).
Directional Risk
BUY risk weights fakeUp wicks, impulse, bear vol, low position; SELL mirrors. Clamped 0-1.
Trend Boost
Adds 15% for 2H alignment, 10% for 30m, 5% for VWAP (directional).
Final Fusion
BUY_FINAL = 55% pred + 25% risk + 20% boost; normalized vs SELL counterpart. Displays blocks (🟩🟩🟩🟩=≥80%) and stars (⭐⭐⭐⭐⭐=≥85%).
HUD Layout & Usage
20-row table separates RISK MATRIX (rows 1-10) from UQ (11-18): metric | visual box/block | Chinese explanation. Perfect for silver's high-volatility scalping, balancing exhaustive risk scanning with probabilistic edge quantification. Ready in both English and Chinese
Silver 30m HUD — Trend / Flow / PB / VWAP / TurboSilver 30m HUD is a streamlined Pine Script v5 indicator optimized exclusively for 30-minute silver futures (SIL) charts on TradingView. It displays a compact 2-column middle-right table analyzing trend, flow, momentum, pullback, VWAP, turbo, and final signals with safety stars and risk warnings. Enforces 30m timeframe usage via label alert on other periods.
Key Engines
Trend Fusion
Combines 30m (close vs SMA60) with 2H higher timeframe for UP/DOWN/FLAT consensus; MIXED on divergence. Serves as primary directional filter.
Flow Detection
Identifies volume surges (>2.2x 20-period SMA) as BULL/BEAR SURGE, else defaults to candle direction (UP/DOWN). Captures aggressive buying/selling pressure.
Momentum Composite
QQE/RSI/MFI blend: both >55 = UP, both <45 = DOWN, otherwise EXHAUST. Flags overextended moves.
Pullback Safety
Rates position vs SMA20/50: above both = OK, above 20 but below 50 = Weak, below both = Danger. Prevents chasing extended trends.
VWAP & Turbo
Price vs session VWAP (UP/DOWN); turbo flags >1% candle moves as UP/DOWN acceleration or EXHAUST.
Signals & Risk
Final Signal Logic
BUY requires UP trend + OK PB + UP VWAP + no DOWN mom; SELL needs DOWN trend + non-OK PB + DOWN VWAP; EXHAUST mom = CHOP; else WAIT.
Safety Ratings
BUY stars: 5🟩 (perfect confluence), 3🟩 (basic BUY); SELL: 4🟥 (full signal), 3🟥 (exhaustion).
Risk Alert
Triggers ⚠️ on BUY signals with 2H DOWN trend and <0.20 from resistance (distR), warning multi-timeframe conflict + overhead supply. Displays S/R levels and distances in mintick format.
HUD Layout
12-row table prioritizes scannability: metrics left (gray), statuses right (color-coded green/red/gray), bottom shows Dist to R/S, levels, and RISK. Ideal for quick 30m SIL scalping decisions balancing confluence and safety.
⭐ Silver HUD v15.1 — Full Notes Version (3-Column HUD)Silver HUD v15.1 is a comprehensive Pine Script v5 indicator designed for micro silver futures (SIL) trading on TradingView. It overlays a 3-column HUD table displaying real-time analysis across multiple engines including trend, flow, momentum, pullback, turbo (breakout), divergence, volume, and 2H structure. The system generates weighted BUY/SELL scores and final signals with risk warnings, optimized for 5m charts with 30m support/resistance levels.
Core Components
Support/Resistance & Trade Levels
Pulls 30m lowest low (support) and highest high (resistance) for entry/stop/TP calculation. Entry defaults to support, stop loss at support - 0.10, with ATR-based TPs (1x/2x/3x). Risk per lot factors SIL contract specs (1000oz, $5/tick). Alerts when price nears support within 0.05.
Multi-Engine Analysis
TREND: EMA20/50 + VWAP direction (UP/DOWN/MIXED).
FLOW: CCIOBV (CCI+OBV) + QQE momentum sync.
MOMENTUM: RSI/MFI >55 (UP) or <45 (DOWN).
PB (Pullback): EMA20 deviation (-0.4% to +1.2% = OK; flags CHASE/DEEP).
TURBO: ATR percentile + BB width squeeze for BREAKOUT/EXHAUST.
Scores weight flow (30%), momentum (25%), PB (25%), trend/turbo (10-20%). BUY ≥75, SELL ≥72 triggers raw signals.
Advanced Features
2H Structure: Detects HH/HL/LL/LH swings for macro bias (UP/DOWN/MIXED).
SELL System: Distinguishes SELL-ALERT (exhaustion) vs full SELL-REVERSAL (multi-condition bear flip).
Divergence & Volume: RSI-based bear/bull div on swing highs/lows; surge detection (>2x vol MA or 80th percentile).
Final Signal: Combines raw scores with filters (no DEEP PB for BUY, 2H tiebreaker); RISK flags conflicts like div or trend mismatches.
HUD Display & Usage
Renders a bottom-right table with metric, status (color-coded), and Chinese explanations. Stars rate scores (★★★★★=90+). Ideal for high-frequency SIL traders monitoring multi-timeframe confluence on 5m charts.
GBM Prob: nearest unswept H/L (up to 50 bars)This indicator is designed to analyze market structure and price behavior in relation to previous highs and lows. It automatically identifies prior swing highs and lows and tracks whether they have been taken by the current price movement.
The main goal of the indicator is to show which side of the market has already been cleared of liquidity and where untouched liquidity remains. Based on this data, it calculates the percentage of liquidity taken, helping traders assess the directional bias of price.
The indicator can be used as a higher timeframe filter (D1, H4) and as contextual guidance for entries on lower timeframes during the London and New York sessions. It works especially well with ICT / SMC concepts, OTE zones, and liquidity-based analysis.
Suitable for both intraday and swing trading, the indicator helps traders make more informed decisions and avoid trading against already swept liquidity.
Interest Rate ExpectationsThis indicator shows how much rate cuts or hikes are currently priced into SOFR futures. You choose two SOFR contracts and the script converts each contract price into basis points relative to the current effective fed funds rate. This gives you a very clear view of how policy expectations shift over time.
You can switch between using a fixed EFFR value or pulling the live EFFR ticker. Colours for each line and label are fully adjustable. The script also includes an optional grid for the plus or minus 25, 50 and 75 basis point levels so the chart does not zoom out too far.
Labels appear at the end of both lines and display how many basis points of cuts or hikes are priced for each contract. A small reference box is added on the chart to remind you what each quarterly code represents. For example H is March and Z is December.
The background shading highlights changes in the timing of cuts. Green shading means the market is pushing cuts further out in time. Red shading means cuts are being pulled closer. This gives a simple and visual way to track how the curve reprices near term versus long term policy expectations.
This tool is useful for anyone tracking fed path repricing, front end volatility, macro catalysts or cross asset rate sensitivity.


