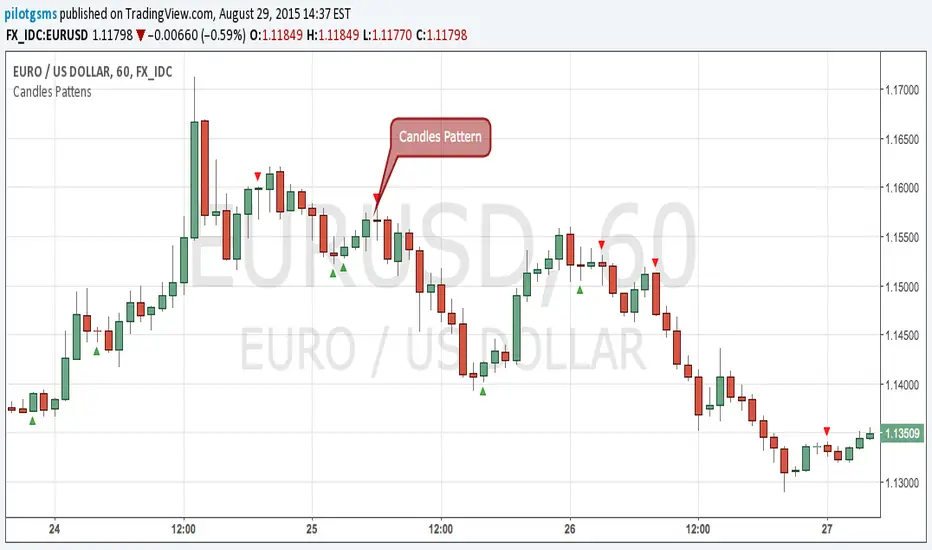
Candles Pattens (v. 1.14)This script sows you candlestick patterns in real-time.
At that moment script knows Bearish/Bullish Engulf and Doji Points.
You can recommend me which pattens you want to see in next version at comment section below
Buscar en scripts para "Candlestick"
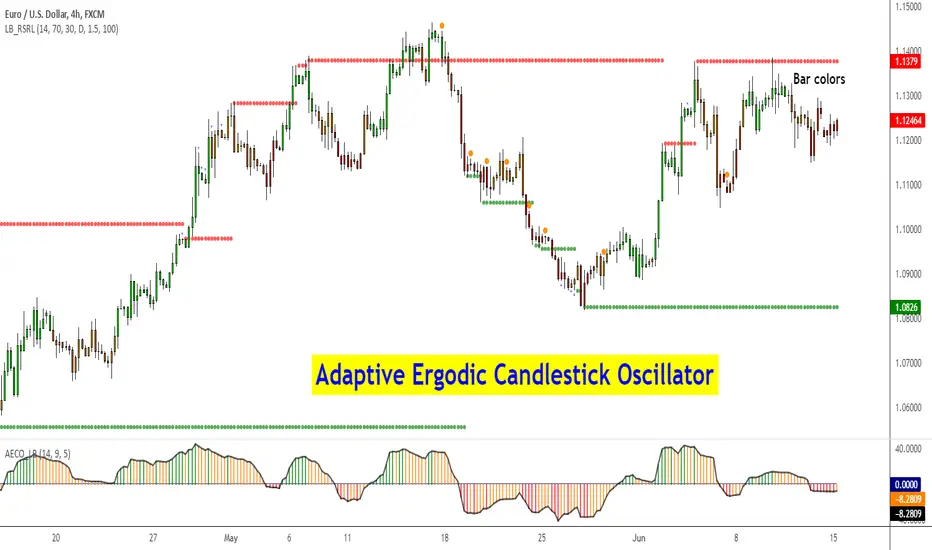
Adaptive Ergodic Candlestick Oscillator [LazyBear]This updates Blau's excellent Candlestick oscillator to be adaptive by using the length of a scaled stochastic indicator and an exponent (for calculating the smoothing coefficient) to obtain the moving average.
Check out the options page for configurable variables.
More info on Ergodic Oscillator:
Book: "Momentum, Direction and Divergence" by William Blau
List of my public indicators: bit.ly
List of my app-store indicators: blog.tradingview.com
Binary Option Arrows (example) [TheMightyChicken]An example of binary option arrows for candlestick patterns bearish and bullish harami. With results as colored background and an option to choose your expiration (one candle by default). It's just an example for those who has their own strategy and wants to make nice arrows in their chart. All you need to do is rewrite piece of script in lines 9:13 - feel free to ask me for any help, but I believe it's all clear.
Disclaimer: It's just an example how to script arrows for binary option and I am not responsible for any loss of money by using this particular strategy.
I wish happy and successful trading! ;)

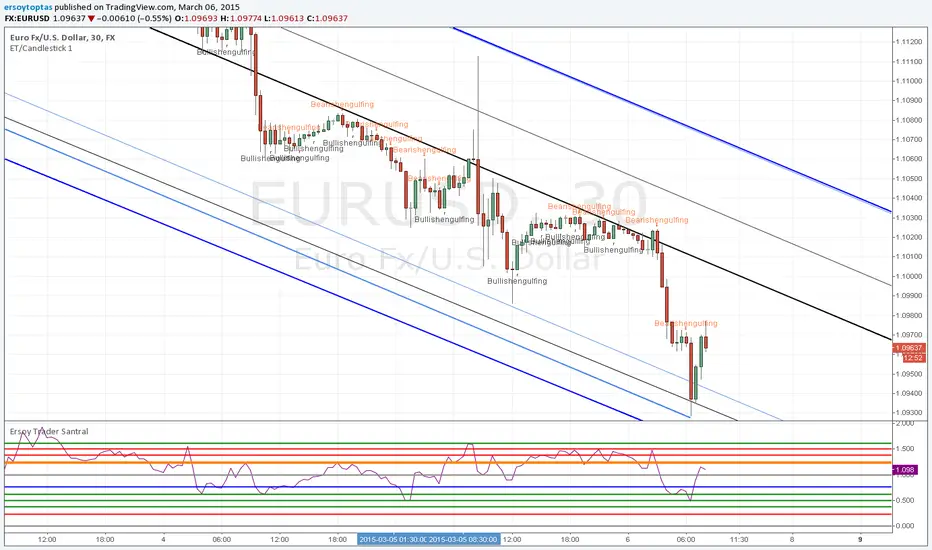
ET/Candlestick 1website: www.ersoytoptas.com
Newspaper : tr.investing.com
Please ... First !!! Your analysis after sicript
Indicator: Intrady Momentum IndexThe Intraday Momentum Index (IMI), developed by Tushar Chande, is a cross-breed between RSI and candlestick analysis. IMI determines the candle type that dominated the recent price action, using that to pinpoint the extremes in intraday momentum.
As the market tries to bottom after a sell off, there are gradually more candles with green bodies, even though prices remain in a narrow range. IMI can be used to detect this shift, because its values will increase towards 70. Similarly, as the market begins to top, there will be more red candles, causing IMI to decline towards 20. When the market is in trading range, IMI values will be in the neutral range of 40 to 60.
Usually intraday momentum leads interday momentum. QStick can show interday momentum, it complements IMI. You will find it in my published indicators.
I have added volatility bands based OB/OS, in addition to static OB/OS levels. You can also turn on IMI Ehlers smoothing. BTW, all parameters are configurable, so do check out the options page.
List of my other indicators:
-
- Google doc: docs.google.com


Previous Day High/Low - by Praveen Sigrohavery helpful tool if you consider previous day high and low important to use as benchmark for the next big move.

ABCD Strategy (v7 Ready)//@version=6
indicator("ABCD Strategy v7 – MTF S/R Filter", overlay=true, max_lines_count=300, max_labels_count=300)
//━━━━━━━━━━━━━━━━━━━━━
// INPUTS
//━━━━━━━━━━━━━━━━━━━━━
pivotLen = input.int(5, "Swing Strength", minval=2)
bcMin = input.float(0.618, "BC Min Fib")
bcMax = input.float(0.786, "BC Max Fib")
cdMin = input.float(1.272, "CD Min Extension")
cdMax = input.float(1.618, "CD Max Extension")
htfTF = input.timeframe("240", "Higher Timeframe (S/R)")
srLookback = input.int(200, "HTF S/R Lookback")
srTolerance = input.float(0.002, "S/R Zone Tolerance (0.2%)")
showSR = input.bool(true, "Show HTF S/R Zones")
showTargets = input.bool(true, "Show Targets")
//━━━━━━━━━━━━━━━━━━━━━
// HIGHER TF SUPPORT / RESISTANCE
//━━━━━━━━━━━━━━━━━━━━━
htfHigh = request.security(syminfo.tickerid, htfTF, ta.highest(high, srLookback))
htfLow = request.security(syminfo.tickerid, htfTF, ta.lowest(low, srLookback))
srHighZoneTop = htfHigh * (1 + srTolerance)
srHighZoneBottom = htfHigh * (1 - srTolerance)
srLowZoneTop = htfLow * (1 + srTolerance)
srLowZoneBottom = htfLow * (1 - srTolerance)
//━━━━━━━━━━━━━━━━━━━━━
// DRAW HTF ZONES
//━━━━━━━━━━━━━━━━━━━━━
if showSR
box.new(bar_index - 5, srHighZoneTop, bar_index + 5, srHighZoneBottom,
bgcolor=color.new(color.red, 85), border_color=color.red)
box.new(bar_index - 5, srLowZoneTop, bar_index + 5, srLowZoneBottom,
bgcolor=color.new(color.green, 85), border_color=color.green)
//━━━━━━━━━━━━━━━━━━━━━
// SWING DETECTION
//━━━━━━━━━━━━━━━━━━━━━
ph = ta.pivothigh(high, pivotLen, pivotLen)
pl = ta.pivotlow(low, pivotLen, pivotLen)
var float A = na
var float B = na
var float C = na
var float D = na
var int Ab = na
var int Bb = na
var int Cb = na
var int Db = na
if not na(pl)
A := B
Ab := Bb
B := C
Bb := Cb
C := low
Cb := bar_index
if not na(ph)
A := B
Ab := Bb
B := C
Bb := Cb
C := high
Cb := bar_index
//━━━━━━━━━━━━━━━━━━━━━
// ABCD LOGIC
//━━━━━━━━━━━━━━━━━━━━━
ab = math.abs(B - A)
bc = math.abs(C - B)
bcFib = bc / ab
validBC = bcFib >= bcMin and bcFib <= bcMax
bull = C > B
cdMinPrice = bull ? C - bc * cdMin : C + bc * cdMin
cdMaxPrice = bull ? C - bc * cdMax : C + bc * cdMax
inDzone = low <= cdMaxPrice and high >= cdMinPrice
//━━━━━━━━━━━━━━━━━━━━━
// MTF STRUCTURE FILTER
//━━━━━━━━━━━━━━━━━━━━━
nearResistance = close <= srHighZoneTop and close >= srHighZoneBottom
nearSupport = close <= srLowZoneTop and close >= srLowZoneBottom
structureOK =
(bull and nearSupport) or
(not bull and nearResistance)
//━━━━━━━━━━━━━━━━━━━━━
// FINAL D CONFIRMATION
//━━━━━━━━━━━━━━━━━━━━━
if validBC and inDzone and structureOK
D := close
Db := bar_index
//━━━━━━━━━━━━━━━━━━━━━
// TARGETS
//━━━━━━━━━━━━━━━━━━━━━
tp1 = bull ? D + math.abs(D - C) * 0.382 : D - math.abs(D - C) * 0.382
tp2 = bull ? D + math.abs(D - C) * 0.618 : D - math.abs(D - C) * 0.618
//━━━━━━━━━━━━━━━━━━━━━
// DRAW PATTERN
//━━━━━━━━━━━━━━━━━━━━━
if not na(D)
line.new(Ab, A, Bb, B, width=2, color=color.blue)
line.new(Bb, B, Cb, C, width=2, color=color.orange)
line.new(Cb, C, Db, D, width=2, color=color.green)
label.new(Db, D, "D (HTF CONFIRMED)", style=label.style_label_down, color=color.yellow)
if showTargets
line.new(Db, tp1, Db + 12, tp1, color=color.green)
line.new(Db, tp2, Db + 12, tp2, color=color.teal)
alertcondition(validBC and inDzone and structureOK,
"ABCD v7 Confirmed",
"ABCD Pattern confirmed at Higher-Timeframe Support/Resistance — wait for price action.")

Wick & Body % with upper wick thresholdA simple indicator to give the sizes of wicks and main body of the last candle as percentage of high - low. No negative figures. If the candle is red, the table will be red and vice versa. Table could be located as per user preference. Upper wick threshold is user defined and will be red beyond the threshold.

No Wick Candle AlertNo Wick Candle Alert is a price-action indicator designed to identify strong momentum candles with no lower wick, signaling decisive buying or selling pressure.
This indicator automatically scans the chart and highlights:
Bullish candles with no lower wick (open = low)
Bearish candles with no lower wick (close = low)
When such a candle appears:
A clear visual marker is plotted slightly away from the candle (so it does not overlap)
An automatic alert is triggered to notify you in real time
🔹 Key Features
Detects true no-wick candles with precision
Works on any market (Forex, Crypto, Indices, Stocks)
Designed for 15-minute timeframe price action (can be adapted)
Non-repainting alerts (confirmed candle close)
Clean and minimal chart display
🔹 How Traders Use It
No-wick candles often indicate strong institutional pressure and can be used for:
Momentum confirmation
Breakout validation
Entry timing in price-action strategies
Confluence with support & resistance or session opens
🔹 Alerts
Once enabled, the indicator sends an alert immediately after the candle closes, allowing you to react without watching the screen.

Wick Analysis Chart [LTS]Wick Analysis Chart - Advanced Price Rejection Visualization
Overview
The Wick Analysis Chart is a specialized oscillator that measures and visualizes price rejection strength by analyzing candle wicks relative to their body sizes. Unlike traditional wick analysis that uses raw price differences, this indicator converts wick measurements into percentage ratios, making them comparable across different instruments, timeframes, and market conditions.
The indicator emphasizes significant price rejections by incorporating volume-weighted calculations with selectable scaling methods (linear, logarithmic, or square root), while filtering out noise through multiple customizable filters including ATR-based volatility filtering, wick size thresholds, and doji detection.
What Makes This Original
This indicator combines several unique analytical approaches not commonly found together:
Percentage-based wick ratios rather than absolute price measurements, enabling cross-instrument and cross-timeframe comparisons
Volume weighting applied BEFORE filtering to ensure high-volume rejections aren't excluded
Three distinct volume scaling methods (linear, logarithmic, square root) to accommodate different trading styles and prevent chart compression
Multi-layer filtering system combining ATR volatility thresholds, minimum wick size requirements, and doji detection
Intelligent plot ordering that ensures smaller wick components remain visible when displaying both upper and lower wicks simultaneously
Color-coded rejection direction showing bullish rejections (lower wick dominant) versus bearish rejections (upper wick dominant)
How It Works
Core Calculation
The indicator calculates wick-to-body ratios as percentages:
Total Wick % = (Upper Wick + Lower Wick) / Body Size × 100
Upper Wick % = Upper Wick / Body Size × 100
Lower Wick % = Lower Wick / Body Size × 100
A 200% total wick value means the combined wicks are twice the size of the candle body, indicating strong price rejection.
Volume Weighting
Volume weighting is applied to emphasize rejections that occur on significant volume. The indicator offers three scaling methods:
Linear Scaling: Direct volume multiplier (2x volume = 2x display value). Best for dramatic emphasis on volume spikes. Suitable for scalping and intraday trading where volume surges signal important levels.
Logarithmic Scaling: Diminishing returns on extreme volume using the formula: multiplier = 1 + log(volume ratio). A 10x volume spike produces only ~3.3x emphasis. Best for preventing chart compression while maintaining volume awareness. Ideal for swing trading and multi-timeframe analysis.
Square Root Scaling: Balanced approach using square root of volume ratio. A 4x volume spike produces 2x emphasis. Provides middle ground between linear and logarithmic. Suitable for most day trading applications.
Filtering System
Three independent filters work together to eliminate noise:
ATR Filter: Removes candles whose total range is below a specified percentage of the Average True Range. This filters out low-volatility consolidation periods, focusing analysis on meaningful price movements.
Wick Size Filter: Removes candles whose volume-weighted wick percentage is below the threshold. This ensures only significant rejections are displayed, even if the candle met the ATR requirement.
Doji Filter: Automatically filters candles where the body is smaller than the specified percentage of total range. Doji candles produce extreme wick ratios that can skew the chart scale.
Calculation Flow
1. Calculate base wick-to-body percentages
2. Apply volume weighting using selected scaling method
3. Check ATR filter (if enabled)
4. Check wick size filter using volume-weighted values (if enabled)
5. Check doji filter
6. Display final values if all filters pass
How To Use
Display Configuration
Total Wick Value: Shows combined upper and lower wick size. Color indicates rejection direction - green when lower wick dominates (buyers rejected downside), red when upper wick dominates (sellers rejected upside).
Upper Wick Value: Isolated upper wick measurement. Useful for identifying supply zones and resistance rejection.
Lower Wick Value: Isolated lower wick measurement. Useful for identifying demand zones and support rejection.
When both upper and lower wicks are displayed simultaneously, the indicator automatically plots them in size order so the smaller value remains visible.
Volume Weighting Setup
Enable volume weighting and select your preferred scaling method based on trading style:
Linear: Maximum emphasis on volume, accepts potential chart compression
Logarithmic: Minimal chart compression, subtle volume emphasis
Square Root: Balanced approach for most applications
Adjust Volume Average Length based on your timeframe (shorter for intraday, longer for swing trading).
Filter Configuration
ATR Filter: Start with 80% to focus on above-average volatility moves. Increase to 100%+ for only the most volatile candles, or decrease to 60-70% to include more data.
Wick Size Filter: Start with 50% to show wicks at least half the body size. Increase to 75-100% for only the most significant rejections, or decrease to 25% for more sensitivity.
Doji Threshold: Default 5% works well for most markets. Increase for markets with frequent small-bodied candles.
Reference Levels
100% Line (Equilibrium): Represents 1:1 wick-to-body ratio. Values above this line indicate wicks larger than the body.
Extreme Level: User-defined threshold for alerts. Default 500% means wicks are 5x the body size. Adjust based on your instrument and filter settings with volume weighting enabled.
Trading Applications
Identifying Key Levels: Large wick percentages with high volume often mark important support/resistance levels where significant orders absorbed price movement.
Trend Exhaustion: Increasing wick percentages at trend extremes, especially with declining volume weighting, can signal momentum loss.
Breakout Validation: Breakout candles with small wicks (low percentage values) suggest conviction, while large wicks suggest rejection and potential false breakouts.
Session Analysis: Compare wick percentages across different trading sessions to identify when the most significant rejections occur.
Mean Reversion Setups: Extreme wick percentages above your threshold level, particularly when colored green (bullish rejection) at support or red (bearish rejection) at resistance, can signal high-probability reversal zones.
Alerts
The indicator includes an alert condition that triggers when the total wick value exceeds the extreme level. Configure the extreme level based on your backtesting to match your instrument's characteristics and filter settings.
Settings Summary
Display Options
Show Total/Upper/Lower Wick Value: Toggle visibility
Color selections for bullish/bearish total wicks and upper/lower components
Volume Weighting
Apply Volume Weighting: Enable/disable volume emphasis
Volume Average Length: Period for volume SMA comparison (default: 20)
Volume Scaling Method: Linear/Logarithmic/Square Root
ATR Filter
Apply ATR Filter: Enable/disable volatility-based filtering
ATR Length: Period for ATR calculation (default: 14)
Filter Percent: Minimum candle range as % of ATR (default: 80%)
Wick Size Filter
Apply Wick Size Filter: Enable/disable wick size threshold
Minimum Wick %: Minimum volume-weighted wick percentage (default: 50%)
Advanced
Doji Threshold: Body size as % of range for doji detection (default: 5%)
Reference Levels
Show Reference Levels: Toggle horizontal reference lines
Extreme Level: Threshold for extreme wick values and alerts (default: 500%)

Indicador de Vela de Apertura NY 4HEn 4H muestra la apertura de la vela del horario de nueva york y el cierre de la misma.

papa experiment//@version=6
indicator("Edufx AMD", shorttitle="Edufx AMD", overlay=true)
// ───── Inputs ─────
timezone = input.string("America/New_York", "Timezone")
enableDailyCycles = input.bool(true, "Enable Daily Cycles")
colorAcc = input.color(color.new(color.gray, 80), "Accumulation")
colorManip = input.color(color.new(color.red, 80), "Manipulation")
colorDist = input.color(color.new(color.green, 80), "Distribution")
// ───── Daily Anchor (NY 8PM) ─────
var int dayStart = na
if na(dayStart) or time >= dayStart + 86400000
dayStart := timestamp(timezone, year, month, dayofmonth, 20, 0)
accEnd = dayStart + 9 * 60 * 60 * 1000
manEnd = dayStart + 15 * 60 * 60 * 1000
distEnd = dayStart + 24 * 60 * 60 * 1000
// ───── State ─────
var float accLo = na
var float accHi = na
var float manLo = na
var float manHi = na
var float disLo = na
var float disHi = na
var bool accDone = false
var bool manDone = false
var bool disDone = false
// ───── Daily AMD ─────
if enableDailyCycles
// Accumulation
if time >= dayStart and time < accEnd
accLo := na(accLo) ? low : math.min(accLo, low)
accHi := na(accHi) ? high : math.max(accHi, high)
if time >= accEnd and not accDone and not na(accLo)
box.new(dayStart, accHi, accEnd, accLo,
xloc=xloc.bar_time, bgcolor=colorAcc, border_color=colorAcc)
accDone := true
// Manipulation
if time >= accEnd and time < manEnd
manLo := na(manLo) ? low : math.min(manLo, low)
manHi := na(manHi) ? high : math.max(manHi, high)
if time >= manEnd and not manDone and not na(manLo)
box.new(accEnd, manHi, manEnd, manLo,
xloc=xloc.bar_time, bgcolor=colorManip, border_color=colorManip)
manDone := true
// Distribution
if time >= manEnd and time < distEnd
disLo := na(disLo) ? low : math.min(disLo, low)
disHi := na(disHi) ? high : math.max(disHi, high)
if time >= distEnd and not disDone and not na(disLo)
box.new(manEnd, disHi, distEnd, disLo,
xloc=xloc.bar_time, bgcolor=colorDist, border_color=colorDist)
disDone := true
// Reset
if time >= distEnd
accLo := na
accHi := na
manLo := na
manHi := na
disLo := na
disHi := na
accDone := false
manDone := false
disDone := false

Candle DNA Rejection, Dominance & Confusion By Dany📌 Candle DNA – Rejection, Dominance & Confusion (Danish)
Indicator Description & Trading Guide
🔥 What This Indicator Does
The Candle DNA indicator analyzes each candle to classify it into three powerful market behaviors:
Rejection Candles (STR-REJ)
Dominance Candles (DOM)
Confusion Candles (CONF)
These classifications help traders identify high-probability turning points, trend continuation, and market indecision.
🧬 1. Rejection Candles (STR-REJ)
A rejection candle shows a strong rejection of price in one direction.
It occurs when the candle has a long wick and small body, signaling a strong rejection from buyers or sellers.
✅ How to Use Rejection
Buy Setup:
When a green rejection candle forms near support, it indicates buyers rejected lower prices.
Sell Setup:
When a red rejection candle forms near resistance, it indicates sellers rejected higher prices.
🎯 Profit Tip
Use rejection candles for mean reversion trades (price bouncing back after rejection).
Rejection candles near major support/resistance zones have the highest win rate.
🧠 2. Dominance Candles (DOM)
Dominance candles show strong market control.
They have very large bodies and minimal wick, indicating clear bullish or bearish control.
✅ How to Use Dominance
Buy Setup:
A green dominance candle near support indicates strong bullish control.
Sell Setup:
A red dominance candle near resistance indicates strong bearish control.
🎯 Profit Tip
Dominance candles are excellent for trend continuation trades.
When a dominance candle breaks a key level, the market often follows strongly.
🤝 3. Confusion Candles (CONF)
Confusion candles show indecision in the market.
They have small bodies and almost equal wicks on both sides.
✅ How to Use Confusion
Confusion candles usually appear before big moves.
They indicate the market is deciding its next direction.
🎯 Profit Tip
When CONF appears near support/resistance, wait for the next candle to confirm direction.
📍 Support & Resistance Filter
The indicator only produces strong signals near:
Support zones (low is near 20-period low)
Resistance zones (high is near 20-period high)
This increases the accuracy by filtering out weak signals.
⚠️ Sideways Market Filter
The indicator avoids trading in sideways markets using ATR.
✅ This means:
It only trades when the market has enough momentum
Avoids choppy price action and false signals
🧩 How to Increase Profits Using This Indicator
✔️ Best Profit Strategy
Use the indicator with multiple confirmation steps:
Step 1: Wait for a Strong Signal
STR-REJ or DOM at support/resistance
Step 2: Confirm Trend Direction
Use higher timeframe trend or moving average to confirm.
Step 3: Enter on Confirmation Candle
For more accuracy, enter on the next candle after the signal (Spot mode is recommended).
Step 4: Use Smart Risk Management
Use tight stop loss below/above the candle wick
Use RR 1:3 (recommended)
This ensures you win less but earn more per win.
🧠 Best Trading Rules (Recommended)
✅ BUY RULE
Signal is STR-REJ or DOM near support
Market is not sideways
Confirm bullish trend
Enter on next candle close
✅ SELL RULE
Signal is STR-REJ or DOM near resistance
Market is not sideways
Confirm bearish trend
Enter on next candle close
💡 Extra Profit Tips
✔️ Use it with RSI or MACD for extra confirmation
✔️ Trade only during high liquidity sessions (London/New York)
✔️ Avoid trading before major news
✔️ Combine with order blocks for higher accuracy
🏁 Summary
This indicator is built to:
Detect high-probability reversal zones
Trade trend continuation
Avoid sideways market noise
Help you increase profit with RR 1:3

Liquidity Sweep + BOS Trades [Enhanced]liquidity sweep is the main factor i ict so we are grabig liquidity sweep the we will wait for bos and when we see a complete variation we will be in

Two Consecutive Candles Alert - Toggle Alerts🔹 Overview:
This indicator identifies when two consecutive candles of the same color appear on the chart—bullish (green) or bearish (red). It highlights the second candle of the streak and optionally triggers an alert, helping traders spot short-term momentum shifts or continuation patterns.
🔹 How It Works:
Candle Detection: The script checks the last three candles.
The second candle in a pair is marked only if it follows a candle of the same color and is not part of a longer streak.
Marking:
Bullish second candles are marked with a green triangle below the bar.
Bearish second candles are marked with a red triangle above the bar.
Alerts (Optional):
Traders can enable or disable alerts independently for bullish or bearish setups using checkboxes in the settings.
Alerts are triggered only on the second candle of a two-candle streak.
🔹 Inputs / Settings:
Enable Bullish Candle Alerts ✅
Enable Bearish Candle Alerts ✅
🔹 Use Case:
Identify short-term trend momentum.
Spot potential continuation setups after two consecutive candles of the same type.
Combine with other indicators for confirmation (e.g., support/resistance, moving averages).
🔹 Notes:
The indicator marks only the second candle in a two-candle streak to avoid marking longer streaks multiple times.
Alerts are fully optional and can be toggled on or off.


Inside Day Detector//@version=5
indicator("Inside Day Detector", overlay=true)
// Yesterday's High & Low
prevHigh = high
prevLow = low
// Inside Day condition
insideDay = high < prevHigh and low > prevLow
// Plot marker
plotshape(insideDay, title="Inside Day", style=shape.triangleup, location=location.abovebar, size=size.small)
// Alert
alertcondition(insideDay, title="Inside Day Alert", message="Inside Day detected on {{ticker}}")


ORB 1m + 15mShow the opening range bound of each trading day for the first minute and first 15 minutes.

Average CandleAverage Candle is a custom indicator that plots a synthetic candle built from the average open, high, low, and close of the last X periods, providing a smoother view of price behavior and trend. It helps filter noise by summarizing recent market action into a single, representative **candle** per bar.
1. Introduction
Average Candle calculates the simple moving average of each OHLC component (Open, High, Low, Close) over a user-defined lookback period and renders that as a separate candle on the chart.
This creates a smoothed representation of price that is less affected by short-term volatility while still respecting the overall structure of the market.
By visualizing these averaged candles, traders can better identify underlying direction and momentum without removing the original price bars.
2. Key features
- Uses the average of the last X opens, highs, lows, and closes to build a synthetic candle for each bar, allowing consistent smoothing across all OHLC components.
- Colors the Average Candle bullish or bearish based on whether the average close is above or below the average open, making directional bias visually clear at a glance.
- Can be overlaid on the main chart to compare raw price candles with their averaged counterpart, helping traders distinguish meaningful swings from short-term noise.
3. How to use
- Add the indicator to your chart, choose the desired lookback length (X periods), and tune it according to your trading timeframe and style—for example, shorter lengths for more responsive signals and longer lengths for smoother trends.
- Use the Average Candle to confirm trend direction, detect potential reversals, or validate entries and exits by checking whether price action aligns with the smoothed average structure.
- Combine it with other tools such as support/resistance, volume, or momentum indicators, ensuring it is used as a complementary visualization aid rather than a standalone signal generator.
