Buscar en scripts para "Candlestick"
Candlestick Pattern Strategy with Smart Stop-Loss Management🔹 Strategy Overview
This strategy combines candlestick patterns with trend filtering and EMA channel confirmation to identify high-probability trading opportunities. It features a smart stop-loss management system that moves to breakeven once the trade reaches a predefined profit threshold.
📊 Key Features
✅ Multiple Candlestick Patterns – Detects classic reversal patterns like:
Hammer & Hanging Man
Bullish & Bearish Engulfing
Piercing Line & Dark Cloud Cover
Morning & Evening Star
Doji Star (Neutral Signal)
✅ Trend & EMA Channel Filters
Trend EMA (100-period) – Ensures trades align with the broader trend.
EMA Channel (50-period ± % range) – Filters trades within a defined volatility range.
✅ Flexible Trade Management
Fixed Target Points – Take profit at a predefined distance.
Trailing Stop to Cost – Moves stop-loss to breakeven after reaching a specified profit threshold.
✅ Customizable Trade Direction
Long Only / Short Only / Both – Adapt to bullish, bearish, or neutral markets.
✅ Time-Based Execution
Intraday Mode – Trades only within specified session hours.
Positional Mode – Holds trades beyond the session.
⚙️ Input Parameters
Trend Filter – Enable/disable trend alignment with EMA.
EMA Channel Filter – Adjust channel width for volatility control.
Candlestick Patterns – Toggle individual patterns on/off.
Target Points & Trail Trigger – Customize profit-taking and SL management.
Trade Type – Switch between intraday and positional trading.
📈 Entry Conditions
Long Entry:
Bullish candlestick pattern (Hammer, Bullish Engulfing, Piercing Line, Morning Star).
Price above Trend EMA (if enabled).
RSI < 30 (oversold confirmation).
Within EMA Channel (if enabled).
Short Entry:
Bearish candlestick pattern (Hanging Man, Bearish Engulfing, Dark Cloud Cover, Evening Star).
Price below Trend EMA (if enabled).
RSI > 70 (overbought confirmation).
Within EMA Channel (if enabled).
📉 Exit Conditions
Take Profit (TP): Fixed target based on points.
Stop-Loss (SL): Moves to breakeven after hitting the trail trigger.
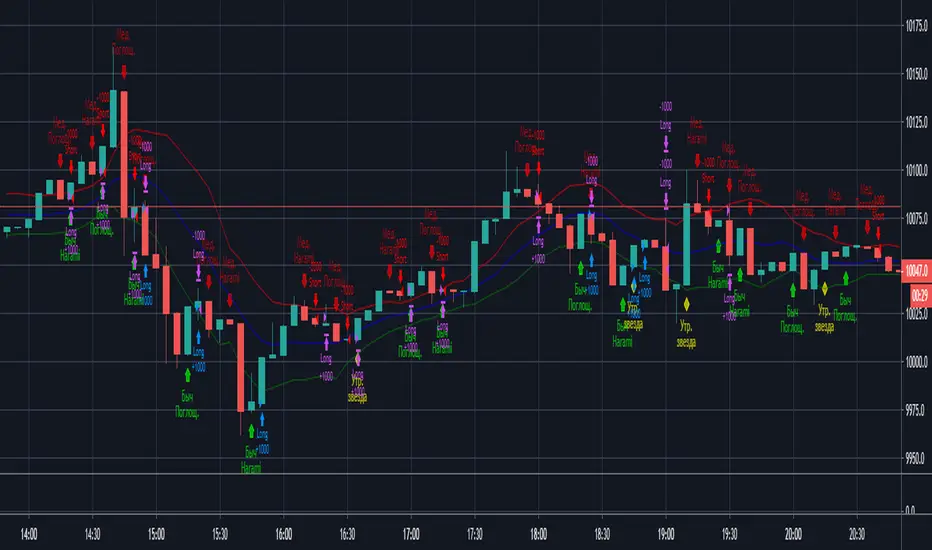
📊 Visual Indicators
Trend EMA (Orange Line) – Main trend direction.
EMA Channel (Blue Lines) – Volatility range.
Buy/Sell Labels – Entry signals below/above bars.
Doji Star (Gray Cross) – Neutral signal.
🎯 Best Suited For
Swing Traders (Positional Mode)
Intraday Traders (Scalping with tight stops)
Price Action Enthusiasts (Candlestick-based entries)
🔗 Try it out and customize it to fit your trading style! 🚀

All Candlestick Patterns StrategyThis strategy uses the tradingview built in candlestick recognition.

Candlestick Signals StrategyThis strategy allows you to pick from 9 different candlestick patterns, and test them against historical data from your chart. You can get a good idea what patterns work best for each chart by turning each pattern on and off in the settings.

Pure Morning 2.0 - Candlestick Pattern Doji StrategyThe new "Pure Morning 2.0 - Candlestick Pattern Doji Strategy" is a trend-following, intraday cryptocurrency trading system authored by devil_machine.
The system identifies Doji and Morning Doji Star candlestick formations above the EMA60 as entry points for long trades.
For best results we recommend to use on 15-minute, 30-minute, or 1-hour timeframes, and are ideal for high-volatility markets.
The strategy also utilizes a profit target or trailing stop for exits, with stop loss set at the lowest low of the last 100 candles. The strategy's configuration details, such as Doji tolerance, and exit configurations are adjustable.
In this new version 2.0, we've incorporated a new selectable filter. Since the stop loss is set at the lowest low, this filter ensures that this value isn't too far from the entry price, thereby optimizing the Risk-Reward ratio.
In the specific case of ALPINE, a 9% Take-Profit and and Stop-Loss at Lowest Low of the last 100 candles were set, with an activated trailing-stop percentage, Max Loss Filter is not active.
Name : Pure Morning 2.0 - Candlestick Pattern Doji Strategy
Author : @devil_machine
Category : Trend Follower based on candlestick patterns.
Operating mode : Spot or Futures (only long).
Trades duration : Intraday
Timeframe : 15m, 30m, 1H
Market : Crypto
Suggested usage : Short-term trading, when the market is in trend and it is showing high volatility .
Entry : When a Doji or Morning Doji Star formation occurs above the EMA60.
Exit : Profit target or Trailing stop, Stop loss on the lowest low of the last 100 candles.
Configuration :
- Doji Settings (tolerances) for Entry Condition
- Max Loss Filter (Lowest Low filter)
- Exit Long configuration
- Trailing stop
Backtesting :
⁃ Exchange: BINANCE
⁃ Pair: ALPINEUSDT
⁃ Timeframe: 30m
⁃ Fee: 0.075%
⁃ Slippage: 1
- Initial Capital: 10000 USDT
- Position sizing: 10% of Equity
- Start: 2022-02-28 (Out Of Sample from 2022-12-23)
- Bar magnifier: on
Disclaimer : Risk Management is crucial, so adjust stop loss to your comfort level. A tight stop loss can help minimise potential losses. Use at your own risk.
How you or we can improve? Source code is open so share your ideas!
Leave a comment and smash the boost button!
Thanks for your attention, happy to support the TradingView community.

Engulfing Candlestick StrategyEver wondered whether the Bullish or Bearish Engulfing pattern works or has statistical significance? This script is for you. It works across all markets and timeframes.
The Engulfing Candlestick Pattern is a widely used technical analysis pattern that traders use to predict potential price reversals. It consists of two candles: a small candle followed by a larger one that "engulfs" the previous candle. This pattern is considered bullish when it occurs in a downtrend (bullish engulfing) and bearish when it occurs in an uptrend (bearish engulfing).
Statistical Significance of the Engulfing Pattern:
While many traders rely on candlestick patterns for making decisions, research on the statistical significance of these patterns has produced mixed results. A study by Dimitrios K. Koutoupis and K. M. Koutoupis (2014), titled "Testing the Effectiveness of Candlestick Chart Patterns in Forex Markets," indicates that candlestick patterns, including the engulfing pattern, can provide some predictive power, but their success largely depends on the market conditions and timeframe used. The researchers concluded that while some candlestick patterns can be useful, traders must combine them with other indicators or market knowledge to improve their predictive accuracy.
Another study by Brock, Lakonishok, and LeBaron (1992), "Simple Technical Trading Rules and the Stochastic Properties of Stock Returns," explores the profitability of technical indicators, including candlestick patterns, and finds that simple trading rules, such as those based on moving averages or candlestick patterns, can occasionally outperform a random walk in certain market conditions.
However, Jorion (1997), in his work "The Risk of Speculation: The Case of Technical Analysis," warns that the reliability of candlestick patterns, including the engulfing patterns, can vary significantly across different markets and periods. Therefore, it's important to use these patterns as part of a broader trading strategy that includes other risk management techniques and technical indicators.
Application Across Markets:
This script applies to all markets (e.g., stocks, commodities, forex) and timeframes, making it a versatile tool for traders seeking to explore the statistical effectiveness of the bullish and bearish engulfing patterns in their own trading.
Conclusion:
This script allows you to backtest and visualize the effectiveness of the Bullish and Bearish Engulfing patterns across any market and timeframe. While the statistical significance of these patterns may vary, the script provides a clear framework for evaluating their performance in real-time trading conditions. Always remember to combine such patterns with other risk management strategies and indicators to enhance their predictive power.

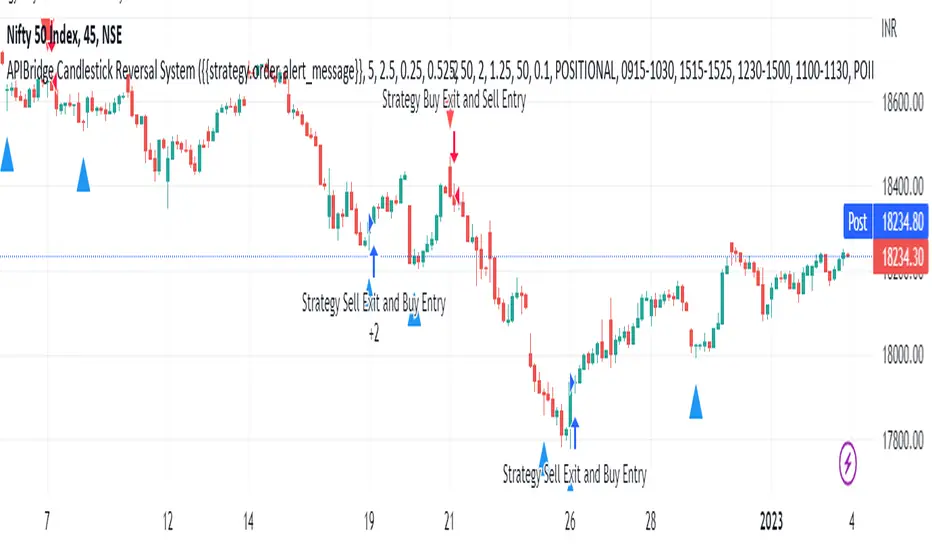
APIBridge Candlestick Reversal SystemStrategy Premise
This strategy uses the Wick Reversal System introduced in Pivot Boss and generates signals based on Candlestick Patterns.
– Wick Reversal System
– Extreme Reversal System
– Outside Reversal System
– Doji Reversal System
Wick Reversal System:
1. For a Bullish reversal wick to exist, the close of the bar should fall within the top 35% of the overall range of the candle.
2. For a bearish reversal wick to exist, the close of the bar should fall within the bottom 35% of the overall range of the candle.
Extreme Reversal System:
1. The first bar of the pattern is about two times larger than the average size of the candles in the look-back period.
2. The body of the first bar of the pattern should encompass more than 50% of the bar’s total range, but usually not more than 85%.
3. The second bar of the pattern opposes the first. If the first bar of the pattern is bullish (C > 0), then the second bar must be bearish (C < 0). If the first bar is bearish (C < 0), then the second bar must be bullish (C > 0).
Outside Reversal System:
1. The Engulfing bar of a bullish outside reversal setup has a low that is below the prior bar’s low (L < L) and a close that is above the prior bar’s high (C > H).
2. The Engulfing bar of a bearish outside reversal setup has a high that is above the prior bar’s high (H > H) and a close that is below the prior bar’s low (C < L).
3. The Engulfing bar is usually 5 to 25 percent larger than the size of the average bar in the look-back period.
Doji Reversal System:
1. The open and close prices of the Doji should fall within 10 percent of each other, as measured by the total range of the Candlestick .
2. For a Bullish Doji , the high of the Doji Candlestick should be below the ten-period Simple Moving Average (H SMA (10)).
4. For a Bearish Doji , one of the two bars following the Doji must close beneath the low of the Doji (C < L or C < L).
5. For a Bullish Doji setup, one of the two bars following the Doji must close above the high of the Doji (C > H) or C > H)
Strategy Logic
Long Entry:
When Low Pivot Point and Wick Reversal System and Bullish Wick Reversal Setup Pattern Send, LE
OR When Low Pivot Point and Extreme Reversal System and Bullish Extreme Reversal setup Send ,LE
OR When Low Pivot Point and Outside Reversal System and Bullish Outside Reversal Setup Send LE
OR When Low Pivot Point and Doji Reversal System and Bullish Doji Reversal Setup Send, LE
Long Exit:
Either when SL or Target is hit. If SL/ TGT is not hit and
When High Pivot Point and Wick Reversal System and Bearish Wick Reversal Setup Pattern Send LXSE
OR When High Pivot Point Extreme Reversal System and Bearish Extreme Reversal setup Send LXSE
OR When High Pivot Point Outside Reversal System and Bearish Outside Reversal Setup Send LXSE
OR When High Pivot Point Doji Reversal System and Bearish Doji Reversal Setup Send, LXSE
Short Entry:
When High Pivot Point and Wick Reversal System and Bearish Wick Reversal Setup Pattern Send SE
OR When High Pivot Point Extreme Reversal System and Bearish Extreme Reversal setup Send SE
OR When High Pivot Point Outside Reversal System and Bearish Outside Reversal Setup Send SE
OR When High Pivot Point Doji Reversal System and Bearish Doji Reversal Setup Send, SE
Short Exit:
Either when SL or Target is hit. If SL/ TGT is not hit and
When Low Pivot Point and Wick Reversal System and Bullish Wick Reversal Setup Pattern Send, SXLE
OR When Low Pivot Point and Extreme Reversal System and Bullish Extreme Reversal setup Send ,SXLE
OR When Low Pivot Point and Outside Reversal System and Bullish Outside Reversal Setup Send SXLE
OR When Low Pivot Point and Doji Reversal System and Bullish Doji Reversal Setup Send, SXLE
Candlestick Reversal System Algo Strategy Parameters for TradingView Charts
1.Length: This is number of bars used to calculated Ex: 14 à previous 14 candles are used
2.Backtesting : Use this to backtest the strategy between Starting and Ending Date and time , it can also be used to set trades in future time
3.Alert_Message : Need to copy while creating alert into Message Box
4.Trade Setup : Intraday / Positional (Selecct accordingly)
5.Start Time Stop Time (Session 1) : Intraday / Positional start time and end time of trade for session 1
6.End Session 1 : Define time to exit any existing position taken in session 1 so that exchange charges will not apply
7.Use Second Session : Check this to use second intraday session
8.Start Time Stop Time (Session 2) : Intraday / Positional start time and end time of trade for session 2
9.End Session 1 : Define time to exit any existing position taken in session 2 so that exchange charges will not apply
10.Use Target : check if you want to set required target if not cheque will not applicable
11.Use StopLoss : Cheque if you want to set stop loss if not cheque will not applicable
12.Trailling Stoploss : Cheque if you want to set trailing stop loss if not cheque will not applicable
13.Point Or Percentage For TG SL : Use Points or Percentage as per your choice
14.Target : Set as per the selection of (Point Or Percentage For TG SL)
15.Stop Loss : Set as per the selection of (Point Or Percentage For TG SL)
16.TSL_Type : Select as per your logic in %/ATR/Points
17.TSL_Input : Set in case you select %/Points in TSL_Type
18.ATR Length : Set as per your logic if you select ATR in the field of TSL_Type
19.ATR_Mult : Set as per your logic if you select ATR in the field of TSL_Type
20.Segment : Select segment of your logic EQ/FUTIDX/FUTSTK/OPTIDX/OPTSTK/FUTCUR/FUTCUM (Used in case of option / Futures )
21.Select Expiry Date : Select the expiry date of your trade as per the segment you selected (Used in case of option / Futures )
22.Select Expiry Month : Select the expiry Month of your trade as per the segment you selected (Used in case of option / Futures )
23.Year : Select the expiry Year of your trade as per the segment you selected (Used in case of option / Futures )
24.Quantity : Enter the quantity in which you want to trade (Used in case of option / Futures )
25.Product Type : Select MIS/Normal/ CNC as per your logic (Used in case of option / Futures )
26.Order Type : Select Market/Limit as per your logic (Used in case of option / Futures )
27.Strategy Tag : Enter the value in case you are using webhook / advance template in APIBridgeTM
28.Lotsize : Enter the lotsize as per your lotic and quentity selection (Used in case of option / Futures )
29.STEP (OTM/ATM/ ITM ) : Select OTM(+1)/ATM(0)/ ITM (-1) as per your logic works in case of options only
30.DIFFERENCE_BETWEEN 2 STRIKE : Select difference of 2 strikes you have used in APIBridge symbol setting list, like for Nifty 50 BankNifty 100
31.APIB Port : Set as per provided to you by Algoji in case of webhook / advance templet
The Segment full form is given below
EQ Equity
FUTIDX Future Index
FUTSTK Future Stock
OPTIDX Index Option
OPTSTK Stock Option
FUTCUR Futcur Currency
FUTCUM Future Commodity
Grand Master's Candlestick Dominance (ATR Enhanced)### Grand Master's Candlestick Dominance (ATR Enhanced)
**Overview**
Unleash the ancient wisdom of Japanese candlestick charting with a modern twist! This comprehensive Pine Script v5 strategy and indicator scans for over 75 classic and advanced candlestick patterns (bullish, bearish, and neutral), assigning dynamic strength scores (1-10) to each for precise signal filtering. Enhanced with Average True Range (ATR) for volatility-aware body size validation, it dominates the markets by combining timeless pattern recognition with robust confirmation layers. Whether used as a backtestable strategy or visual indicator, it empowers traders to spot high-probability reversals, continuations, and indecision setups with surgical accuracy.
Inspired by Steve Nison's *Japanese Candlestick Charting Techniques*, this tool elevates pattern analysis beyond basics—think Hammers, Engulfing patterns, Morning Stars, and rare gems like Abandoned Baby or Concealing Baby Swallow—all consolidated into intelligent arrays for real-time averaging and prioritization.
**Key Features**
- **Extensive Pattern Library**:
- **Bullish (25+ patterns)**: Hammer (8.0), Bullish Engulfing (10.0), Morning Star (7.0), Three White Soldiers (9.0), Dragonfly Doji (8.0), and more (e.g., Rising Three, Unique Three River Bottom).
- **Bearish (25+ patterns)**: Hanging Man (8.0), Bearish Engulfing (10.0), Evening Star (7.0), Three Black Crows (9.0), Gravestone Doji (8.0), and exotics like Upside Gap Two Crows or Stalled Pattern.
- **Neutral/Indecision (34+ patterns)**: Doji variants (Long-Legged, Four Price), Spinning Tops, Harami Crosses, and multi-bar setups like Upside Tasuki Gap or Advancing Block.
Each pattern includes duration tracking (1-5 bars) and ATR-adjusted body/shadow criteria for relevance in volatile conditions.
- **Smart Confirmation Filters** (All Toggleable):
- **Trend Alignment**: 20-period SMA (customizable) ensures entries align with the prevailing trend; optional higher timeframe (e.g., Daily) MA crossover for multi-timeframe confluence.
- **Support/Resistance (S/R)**: Pivot-based levels with 0.01% tolerance to confirm bounces or breaks.
- **Volume Surge**: 20-period volume MA with 1.5x spike multiplier to validate momentum.
- **ATR Body Sizing**: Filters small bodies (<0.3x ATR) and long bodies (>0.8x ATR) for context-aware pattern reliability.
- **Follow-Through**: Ensures post-pattern confirmation via bullish/bearish closes or closes beyond prior bars.
Minimum average strength (default 7.0) and individual pattern thresholds (5.0) prevent weak signals.
- **Entry & Exit Logic**:
- **Long Entry**: Bullish average strength ≥7.0 (outweighing bearish), uptrend, volume spike, near support, follow-through, and HTF alignment.
- **Short Entry**: Mirror for bearish dominance in downtrends near resistance.
- **Exits**: Bearish/neutral shift, or fixed TP (5%) / SL (2%)—pyramiding disabled, 10% equity sizing.
- Backtest range: Jan 1, 2020 – Dec 31, 2025 (editable). Initial capital: $10,000.
- **Interactive Dashboard** (Top-Right Panel):
Real-time insights including:
- Market phase (e.g., "Bullish Phase (Avg Str: 8.2)"), active pattern (e.g., "BULLISH: Bullish Engulfing (Str: 10.0, Bars: 2)"), and trend status.
- Strength breakdowns (Bull/Bear/Neutral counts & averages).
- Filter status (e.g., "Volume: ✔ Spike", "ATR: Enabled (L:0.8, S:0.3)").
- Backtest stats: Total trades, win rate, streak, and last entry/exit details (price & timestamp).
Toggle mode: Strategy (live trades) or Indicator (signals only).
- **Advanced Alerts** (15+ Toggleable Types):
Set up via TradingView's "Any alert() function call" for bar-close triggers:
- Entry/Exit signals with strength & pattern details.
- Strong patterns (≥2 bullish/bearish), neutral indecision, volume spikes.
- S/R breakouts, HTF reversals, high-confidence singles (≥8.0 strength).
- Conflicting signals, MA crossovers, ATR volatility bursts, multi-bar completions.
Example: "STRONG BULLISH PATTERN detected! Strength: 9.5 | Top Pattern: Three White Soldiers | Trend: Up".
**Customization & Usage Tips**
- **Inputs Groups**: Strategy toggles, confirmations, exits, backtest dates, and 15+ alert switches—all intuitively grouped.
- **Optimization**: Tune min strengths for aggressive (lower) or conservative (higher) trading; enable/disable filters to suit your style (e.g., disable S/R for scalping).
- **Best For**: Forex, stocks, crypto on 1H–Daily charts. Test on historical data to refine TP/SL.
- **Limitations**: No external data installs; relies on built-in TA functions. Patterns are probabilistic—combine with your risk management.
Master the candles like a grandmaster. Deploy on TradingView, backtest relentlessly, and let dominance begin! Questions? Drop a comment.
*Version: 1.0 | Updated: September 2025 | Credits: Built on Pine Script v5 with nods to Nison's timeless techniques.*

Freedom Candlestick v5.1.55 1 Alerts?Trend following futures scalping strategy. Highly complex and not beginner friendly.

Engulfing & Pin Bar Breakout StrategyOverview
This strategy automates a classic, powerful trading methodology based on identifying key candlestick reversal patterns and trading the subsequent price breakout. It is designed to be a complete, "set-and-go" system with built-in risk and position size management.
The core logic operates on the 1-Hour timeframe, scanning for four distinct high-probability reversal signals: two bullish and two bearish. An entry is only triggered when the market confirms the signal by breaking a key price level, aiming to capture momentum following a potential shift in market sentiment.
The Strategy Logic
The system is composed of two distinct modules: Bullish (Long) and Bearish (Short).
🐂 Bullish (Long) Setup
The script initiates a long trade based on the following strict criteria:
Signal: Identifies either a Hammer or a Bullish Engulfing pattern. These patterns often indicate that sellers are losing control and buyers are stepping in.
Confirmation: Waits for the very next candle after the signal.
Entry Trigger: A long position is automatically opened as soon as the price breaks above the high of the signal candle.
Stop Loss: Immediately set just below the low of the signal candle.
Take Profit: A fixed target is placed at a 1:5 Risk/Reward Ratio.
🐻 Bearish (Short) Setup
The script initiates a short trade based on the following strict criteria:
Signal: Identifies either a Shooting Star or a Bearish Engulfing pattern. These patterns suggest buying pressure is fading and sellers are taking over.
Confirmation: Waits for the very next candle after the signal.
Entry Trigger: A short position is automatically opened as soon as the price breaks below the low of the signal candle.
Stop Loss: Immediately set just above the high of the signal candle.
Take Profit: A fixed target is placed at a 1:4 Risk/Reward Ratio.
Key Feature: Automated Risk Management
This strategy is designed for disciplined trading. You do not need to calculate position sizes manually.
Fixed Risk: The script automatically calculates the correct position size to risk exactly 2% of your total account equity on every single trade.
Dynamic Sizing: The position size will adjust based on the distance between your entry price and your stop loss for each specific setup, ensuring a consistent risk profile.
How To Use
Apply the script to your chosen chart (e.g., BTC/USD).
Crucially, set your chart's timeframe to 1-Hour (H1). The strategy is specifically calibrated for this interval.
Navigate to the "Strategy Tester" tab below your chart to view backtest results, including net profit, win rate, and individual trades.
Disclaimer: This script is provided for educational and informational purposes only. It is not financial advice. All trading involves substantial risk, and past performance is not indicative of future results. Please use this tool responsibly and at your own risk.

Long-Leg Doji Breakout StrategyThe Long-Leg Doji Breakout Strategy is a sophisticated technical analysis approach that capitalizes on market psychology and price action patterns.
Core Concept: The strategy identifies Long-Leg Doji candlestick patterns, which represent periods of extreme market indecision where buyers and sellers are in equilibrium. These patterns often precede significant price movements as the market resolves this indecision.
Pattern Recognition: The algorithm uses strict mathematical criteria to identify authentic Long-Leg Doji patterns. It requires the candle body to be extremely small (≤0.1% of the total range) while having long wicks on both sides (at least 2x the body size). An ATR filter ensures the pattern is significant relative to recent volatility.
Trading Logic: Once a Long-Leg Doji is identified, the strategy enters a "waiting mode," monitoring for a breakout above the doji's high (long signal) or below its low (short signal). This confirmation approach reduces false signals by ensuring the market has chosen a direction.
Risk Management: The strategy allocates 10% of equity per trade and uses a simple moving average crossover for exits. Visual indicators help traders understand the pattern identification and trade execution process.
Psychological Foundation: The strategy exploits the natural market cycle where uncertainty (represented by the doji) gives way to conviction (the breakout), creating high-probability trading opportunities.
The strength of this approach lies in its ability to identify moments when market sentiment shifts from confusion to clarity, providing traders with well-defined entry and exit points while maintaining proper risk management protocols.
How It Works
The strategy operates on a simple yet powerful principle: identify periods of market indecision, then trade the subsequent breakout when the market chooses direction.
Step 1: Pattern Detection
The algorithm scans for Long-Leg Doji candles, which have three key characteristics:
Tiny body (open and close prices nearly equal)
Long upper wick (significant rejection of higher prices)
Long lower wick (significant rejection of lower prices)
Step 2: Confirmation Wait
Once a doji is detected, the strategy doesn't immediately trade. Instead, it marks the high and low of that candle and waits for a definitive breakout.
Step 3: Trade Execution
Long Entry: When price closes above the doji's high
Short Entry: When price closes below the doji's low
Step 4: Exit Strategy
Positions are closed when price crosses back through a 20-period moving average, indicating potential trend reversal.
Market Psychology Behind It
A Long-Leg Doji represents a battlefield between bulls and bears that ends in a stalemate. The long wicks show that both sides tried to push price in their favor but failed. This creates a coiled spring effect - when one side finally gains control, the move can be explosive as trapped traders rush to exit and momentum traders jump aboard.
Key Parameters
Doji Body Threshold (0.1%): Ensures the body is truly small relative to the candle's range
Wick Ratio (2.0): Both wicks must be at least twice the body size
ATR Filter: Uses Average True Range to ensure the pattern is significant in current market conditions
Position Size: 10% of equity per trade for balanced risk management
Pros:
High Probability Setups: Doji patterns at key levels often lead to significant moves as they represent genuine shifts in market sentiment.
Clear Rules: Objective criteria for entry and exit eliminate emotional decision-making and provide consistent execution.
Risk Management: Built-in position sizing and exit rules help protect capital during losing trades.
Market Neutral: Works equally well for long and short positions, adapting to market direction rather than fighting it.
Visual Confirmation: The strategy provides clear visual cues, making it easy to understand when patterns are forming and trades are triggered.
Cons:
False Breakouts: In choppy or ranging markets, price may break the doji levels only to quickly reverse, creating whipsaws.
Patience Required: Traders must wait for both pattern formation and breakout confirmation, which can test discipline during active market periods.
Simple Exit Logic: The moving average exit may be too simplistic, potentially cutting profits short during strong trends or holding losers too long during reversals.
Volatility Dependent: The strategy relies on sufficient volatility to create meaningful doji patterns - it may underperform in extremely quiet markets.
Lagging Entries: Waiting for breakout confirmation means missing the very beginning of moves, reducing potential profit margins.
Best Market Conditions
The strategy performs optimally during periods of moderate volatility when markets are making genuine directional decisions rather than just random noise. It works particularly well around key support/resistance levels where the market's indecision is most meaningful.
Optimization Considerations
Consider combining with additional confluence factors like volume analysis, support/resistance levels, or other technical indicators to improve signal quality. The exit strategy could also be enhanced with trailing stops or multiple profit targets to better capture extended moves while protecting gains.
Best for Index option,
Enjoy !!

Three Candle Bullish Engulfing StrategyThe Three Candle Bullish Engulfing Strategy is a versatile, multi-mode trading system designed for TradingView, combining classic candlestick patterns with momentum confirmation and dynamic risk management. This script supports both swing trading and intraday approaches, as well as an optional RSI-based breakout mode for additional signal filtering.
Key Features:
Three Candle Pattern Detection:
The strategy identifies potential trend reversal points using a three-candle pattern:
The first candle is a strong bullish (or bearish) move.
The second candle is a doji or small-bodied candle, indicating indecision.
The third candle is a bullish (or bearish) engulfing candle that closes above (or below) the previous high (or low), confirming the reversal.
Flexible Trading Modes:
Swing Long Only: Enter long trades on bullish three-candle setups.
Intraday Long & Short: Trade both long and short based on bullish and bearish three-candle patterns, with automatic session-end exits.
RSI Breakout Mode: Enter long trades when the 1-hour RSI exceeds a user-defined threshold (default 80) and a bullish candle forms, with breakout confirmation and a fixed-percentage stop loss.
Visual Aids:
Plots the RSI breakout trigger price and stop loss on the chart for easy monitoring.
How It Works:
Three Candle Pattern Entries:
Long Entry: Triggered when a bullish candle is followed by a doji, then a bullish engulfing candle closes above the previous high.
Short Entry (Intraday only): Triggered by the inverse pattern—bearish candle, doji, then bearish engulfing candle closing below the previous low.
RSI Breakout Entries:
When the RSI on a higher timeframe (default 1 hour) exceeds the set threshold and a bullish candle forms, the script records a trigger price.
A long trade is entered if the price breaks above this trigger, with a stop loss set a fixed percentage below.
Exits:
Positions are closed if the trailing stop is hit, the session ends (for intraday mode), or the stop loss is triggered in RSI breakout mode.
In RSI breakout mode, positions are also closed if a new breakout trigger forms while in position.

Candles - The WhaleThe strategy is based on candle patterns, with confluence indicators. Note some of the candles are rare, they can be found only a specific timeframe, or within specific stocks.
The added patterns are as follows:
- Bullish Engulfing
It is formed by two candles, the second candlestick engulfing the first candlestick. The first candle is a bearish candle that indicates the continuation of the downtrend.
The second candlestick is a long bullish candle that completely engulfs the first candle and shows that the bulls are back in the market.
- Bullish Harami
It consists of two candlestick charts, the first candlestick being a tall bearish candle, and the second, being a small bullish candle which should be in the range of the first candlestick.
The first bearish candle shows the continuation of the bearish trend and the second candle shows that the bulls are back in the market.
- Piercing Line
Two candles from it, the first candle being a bearish candle which indicates the continuation of the downtrend.
The second candle is a bullish candle that opens the gap down but closes more than 50% of the real body of the previous candle, which shows that the bulls are back in the market and a bullish reversal is going to take place.
- Bullish Belt
A Bullish Belt Hold, known as “yorikiri” in Japanese, is a single Japanese candlestick pattern that suggests a possible reversal of the current downtrend.
- Bullish Kicker
A bullish kicker is a two candlestick pattern that’s usually formed after a significant downtrend, but could also appear after an uptrend.
- Abandoned Baby
The abandoned baby candlestick pattern is a three-bar reversal pattern. It is similar to the morning and evening star formations and is a very reliable reversal signal when it occurs after a sharp rise or drop.
- Homing Pigeon
The bullish homing pigeon is a two-candle bullish reversal pattern that occurs at the end of a bearish trend. Both candles are negative, but the second candle is confined within the range of the previous candle.
- Breakaway
Breakaway patterns are multi-candle formations found on Japanese candlestick charts that suggest a market reversal may be in the offing. An actual breakaway is a five candlestick formation that occurs in either an upward or downward trend.
- Concealing Baby Swallow
The Concealing Baby Swallow candlestick pattern is a four-candlestick pattern that can signal a bullish reversal price movement or a bearish continuation move, depending on where it occurs in the overall market structure. However, the pattern is quite rare, and you may not encounter it in your trading.
- Doji Dragonfly
A dragonfly doji can be an indicator of a reversal in price. When the price of a security has shown a downward trend, it might signal an upcoming price increase.
- Doji Gravestone
The Gravestone Doji forms when the price closes at relatively the same level where it opened, providing that the open coincides with the low or at least the two are very close
- Doji Star
Consists of a long bullish candle, followed by a Doji that gaps up, then a third bearish candle that gaps down and closes well within the body of the first candle. An Evening Doji Star is a three-candle bearish reversal pattern similar to the Evening Star.
- Kicker
A kicker pattern is a two-bar candlestick pattern that predicts a change in the direction of an asset's price trend. This pattern is characterized by a sharp reversal in price over the span of two candlesticks. Traders use it to determine which group of market participants is in control of the direction.
- Ladder Bottom
Is a five-candle bullish reversal pattern that occurs at the end of a bullish trend. The four first candles are bearish and followed by a positive candle that starts with a positive gap.
- MatHold
A bullish pattern begins with a large bullish candle followed by a gap higher and three smaller candles which move lower.
- Matching Low
A matching low is a bullish two-candle reversal pattern that forms in an ongoing downtrend. As to its appearance, a matching low consists of two candlesticks that are negative, but the close at or around the same price.
- Meeting Lines
Bullish meeting lines are a two-candle bullish reversal pattern that occurs in a downtrend and signals a reversal of the trend. The first candle of the bullish meeting lines is bearish, and followed by a positive candle that closes very near the close of the previous candle.
- Morning Doji Star
It is made of 3 candlesticks, the first being a bearish candle, the second, a Doji, and the third being a bullish candle.
The first candle shows the continuation of the downtrend. The second candle being a doji indicates indecision in the market. The third bullish candle shows that the bulls are back in the market and a reversal will take place. The second candle should be completely out of the real bodies of the first and third candles.
- Rising Three Method1
Rising three methods is a bullish continuation pattern that appears in an ongoing uptrend. The Rising three methods pattern consists of five candles. where the first and last candles are long and bullish, with three small bearish candles in between.
- Rising Three Method2
It is the same as "Rising Three Method1" but with a different calculation
- Upside Tasuki Gap1
Is a bullish continuation candlestick pattern that forms in an ongoing uptrend. It consists of three candles, where the two first are bullish with a positive gap in-between, and followed by a negative candle that closes in the gap formed between the first two candles.
- Upside Tasuki Gap2
It is the same as "Upside Tasuki Gap1" but with a different calculation
- Three Line Strike1
Is a four-candle bullish continuation candlestick pattern. It forms a bullish trend and is believed to signal the continuation of the bullish trend.
- Three Line Strike2
It is the same as "Three Line Strike2" but with a different calculation
The confluence indicators:
Movement Averages: multi options checks, you can select what to check to open a position, and the description of each open is in the strategy.
Volume Oscillator: positive signal if the volume is above zero.
EMA: positive signal if the candle source is above EMA.
VWAP: positive signal if the candle source is above VWAP.
BTC Trend: it is an equation to track the BTC price movement
The profit is based on TSL, while the stop loss is based on ATR, or lowest candle.
The recommended time frame is 4 hours.

Dark Cloud Backtest This is a bearish reversal pattern formed by two candlesticks within a uptrend.
Consists of an up candlestick followed by a down candlestick which opens lower
than the prior candlestick and closes below the midrange of the prior candlestick.
It is the reverse of the Piercing Line.
WARNING:
- For purpose educate only
- This script to change bars colors.

Strategy without indicators v11. General Script Strategy
The objective of this strategy is to open buy or sell orders every new hour based on:
Whether the previous candle closed high (buy) or low (sell).
The presence of tops and bottoms to avoid opening orders at times of possible reversals.
The strategy also allows the user to set a date range (start date and end date) to calculate profit, loss, percentage of gain and percentage of loss only in that period.
2. Initial Settings and Parameters
Start Date and End Date: The start_date and end_date variables define the date range to account for profits and losses. These dates can be adjusted by the user to view results in specific periods.
3. Conditions for Order Entry
At each time change, the script checks the conditions for buying or selling, using the following variables and logic:
Detection of Bullish or Bearish Candle:
bullish_candle: True if the previous candle closed high.
bearish_candle: True if the previous candle closed lower.
Analysis of Tops and Bottoms:
To avoid opening orders close to tops and bottoms, the script uses the function find_top_and_bottom(period), which analyzes the last 500 candles and identifies the highest value (top) and the lowest value (bottom).
The variables current_top and current_bottom store these values.
next_top and next_bottom indicate whether the current candle is close to a top (prevents buying) or a bottom (prevents selling).
4. Opening Orders (Buy and Sell)
At each time change, the script checks the conditions to open buy or sell orders:
Condition for Sell:
The sell order is opened if the previous candle was bullish (bullish_candle) and is not close to a top (not next_top).
If there is an open buy order, it is closed before the new sell order.
Buy Condition:
The buy order is opened if the previous candle was bearish (bearish_candle) and is not near a bottom (not_near_bottom).
If there is an open sell order, it is closed before the new buy order.
5. Calculating Profit and Loss
The profit and loss calculation is only done within the configured date range (start_date and end_date):
Profit and Loss:
total_profit and total_loss accumulate the profit and loss values of all operations during the defined period.
percentage_gain and percentage_loss calculate the percentage of gain and loss in relation to the initial capital.
6. Displaying Results on the Chart
The script displays on the chart, next to the candles, the information on Total Profit, Total Loss, % Gain and % Loss:
Strategy Summary
Setting the Date Range: Allows you to set the period for calculating profit and loss.
Previous Candlestick Analysis: Decide whether to buy or sell based on the previous candlestick.
Preventing Entries at Tops and Bottoms: Avoids buying at tops and selling at bottoms to reduce false signals.
Result Calculation: Accumulates profits, losses and percentages within the configured date range.
Results Display on Chart: Displays the configured statistics directly on the chart, next to the candlesticks.
1. Estratégia Geral do Script
O objetivo dessa estratégia é abrir ordens de compra ou venda a cada nova hora com base em:
Se a vela anterior fechou em alta (compra) ou em baixa (venda).
A presença de topos e fundos para evitar abrir ordens em momentos de possíveis reversões.
A estratégia também permite que o usuário configure um intervalo de datas (data inicial e data final) para calcular o lucro, perda, percentual de ganho e percentual de perda apenas nesse período.
2. Configurações e Parâmetros Iniciais
Data Inicial e Data Final: As variáveis data_inicial e data_final definem o intervalo de datas para contabilizar os lucros e perdas. Essas datas podem ser ajustadas pelo usuário para visualizar resultados em períodos específicos.
3. Condições para Entrada de Ordens
A cada mudança de hora, o script verifica as condições de compra ou venda, usando as seguintes variáveis e lógicas:
Detecção de Vela de Alta ou Baixa:
vela_de_alta: Verdadeiro se a vela anterior fechou em alta.
vela_de_baixa: Verdadeiro se a vela anterior fechou em baixa.
Análise de Topos e Fundos:
Para evitar abrir ordens próximas de topos e fundos, o script utiliza a função find_top_and_bottom(periodo), que analisa as últimas 500 velas e identifica o valor mais alto (topo) e o valor mais baixo (fundo).
As variáveis topo_atual e fundo_atual armazenam esses valores.
topo_proximo e fundo_proximo indicam se a vela atual está perto de um topo (evita compra) ou de um fundo (evita venda).
4. Abertura de Ordens (Compra e Venda)
A cada mudança de hora, o script verifica as condições para abrir ordens de compra ou venda:
Condição para Venda:
A ordem de venda é aberta se a vela anterior foi de alta (vela_de_alta) e não está perto de um topo (not topo_proximo).
Se houver uma ordem de compra aberta, ela é fechada antes da nova ordem de venda.
Condição para Compra:
A ordem de compra é aberta se a vela anterior foi de baixa (vela_de_baixa) e não está perto de um fundo (not fundo_proximo).
Se houver uma ordem de venda aberta, ela é fechada antes da nova ordem de compra.
5. Cálculo de Lucros e Perdas
O cálculo de lucro e perda só é feito dentro do intervalo de datas configurado (data_inicial e data_final):
Lucro e Perda:
lucro_total e perca_total acumulam os valores de lucro e perda de todas as operações durante o período definido.
percentual_ganho e percentual_perca calculam o percentual de ganho e perda em relação ao capital inicial.
6. Exibição dos Resultados no Gráfico
O script exibe no gráfico, próximo das velas, as informações de Lucro Total, Perda Total, % de Ganho e % de Perda:
Resumo da Estratégia
Configuração de Intervalo de Datas: Permite configurar o período para cálculo do lucro e da perda.
Análise de Vela Anterior: Decide se a ordem é de compra ou venda com base na vela anterior.
Prevenção de Entradas em Topos e Fundos: Evita compras em topos e vendas em fundos para reduzir sinais falsos.
Cálculo de Resultados: Acumula lucros, perdas e percentuais dentro do período de datas configurado.
Exibição dos Resultados no Gráfico: Exibe as estatísticas configuradas diretamente no gráfico, próximo das velas.

CE_ZLSMA_5MIN_CANDLECHART-- Overview
The "CE_ZLSMA_5MIN_CANDLECHART" strategy, developed by DailyPanda, is a comprehensive trading strategy designed for analyzing trading on 5-minute candlestick charts.
It aims to use some indicators calculated from a Hekin Ashi chart, while running it on a normal candlestick chart, making sure that no price distortion affects the strategy results .
It also brings a feature to show, on the candlestick chart, where the entries would take place on the HA chart, to also be able to study the effect that the price distortion would make on your backtest.
-- Credit
The code in this script is based on open-source indicators originally written by veryfid and everget, I've made significant changes and additions to the scripts but all credit for the idea goes to them, I just built on top of it:
-- Key Features
It incorporate already built indicators (ZLSMA) and CandelierExit (CE)
-- Zero Lag Least Squares Moving Average (ZLSMA) - by veryfid
The ZLSMA is used to detect trends with minimal lag, improving the accuracy of entry and exit signals.
It incorporates a double-smoothed linear regression to minimize lag and enhance trend-following capabilities.
Buy signals are generated when the price closes above the ZLSMA together with the CE signal.
It is calculated based on the HA candlestick pattern.
-- Chandelier Exit (CE) - by everget
The Chandelier Exit indicator is used to dynamically manage stop-loss levels based on the Average True Range (ATR).
It ensures that stop-loss levels are adaptive to market volatility, protecting profits and limiting losses.
The ATR period and multiplier can be customized to fit different trading styles and risk tolerances.
It is calculated based on the HA candlestick pattern.
-- Heikin Ashi Candles
The strategy leverages Heikin Ashi candlesticks to be able identify trends more clearly and leverage this to stay on winning trades longer.
Traders can choose to display Heikin Ashi candlesticks and order fills on the chart for better visualization.
-- Risk Management
The strategy includes multiple risk management options to protect traders' capital.
Maximum intraday loss limit based on a percentage of equity.
Maximum stop-loss in points to filter out entries with excessive risk.
Daily profit target to stop trading once the goal is achieved.
Options to use fixed contract sizes or dynamically adjust based on a percentage of equity.
These features help traders manage risk and ensure sustainable trading practices.
Moving Averages
Several moving averages (EMA 9, EMA 20, EMA 50, EMA 72, EMA 200, SMA 200, and SMA 500) are plotted to provide additional context and trend confirmation.
A "Zone of Value" is highlighted between the EMA 200 and SMA 200 to identify potential support and resistance areas.
-- Customizable Inputs
The strategy includes various customizable inputs, allowing traders to tailor it to their specific needs.
Start and stop trading times.
Risk management parameters (e.g., maximum stop-loss, daily drawdown limit, and daily profit target).
Display options for Heikin Ashi candles and moving averages.
ZLSMA length and offset.
-- Usage
-- Setting Up the Strategy
Configure the start year for the strategy and the trading hours using the input fields. The first candle of each day will be filled black for easy identification, while candles that are outside the allowed time range will be filled purple.
Customize the risk management parameters to match your risk tolerance and trading style.
Enable or disable the display of Heikin Ashi candlesticks and moving averages as desired.
-- Interpreting Signals
Buy signals are indicated by a "Buy" label when the Heikin Ashi close price is above the ZLSMA and the Chandelier Exit indicates a long position.
The strategy will automatically enter a long position with a stop-loss level determined the swing low.
Positions are closed when the close price falls below the ZLSMA.
-- Risk Management
The strategy monitors the maximum intraday loss and stops trading if the loss limit is reached.
If enabled, also stops trading once the daily profit target is achieved, helping to lock in gains.
You have the option to filter operations based on a maximum accepted stop-loss level, based on your risk tolerance.
You can also operate with a fixed amount of contracts or dynamically adjust it based on your allowed risk per trade, ensuring optimal protection of capital.
-- Visual Aids
The strategy plots various moving averages to provide additional trend context.
The "Zone of Value" between the EMA 200 and SMA 200 highlights potential support and resistance areas.
Heikin Ashi candlesticks and order fills can be displayed to enhance the difference this strategy would take if you were to backtest it on a Heikin Ashi chart.
-- Table of results
This strategy also breaks down the results on a monthly basis for better understanding of your capital development along the way.
-- Conclusion
The "CE_ZLSMA_5MIN_CANDLECHART" strategy is a tool for intraday traders looking to understand and leaverage the Heikin Ashi chart while still using the normal candle chart. Traders can customize the strategy to fit their specific needs, making it a versatile addition to any trading toolkit.

Bearish Engulfing Backtest This is a bearish candlestick reversal pattern formed by two candlesticks.
Following an uptrend, the first candlestick is a up candlestick which is
followed by a down candlestick which has a long real body that engulfs or
contains the real body of the prior bar. The Engulfing pattern is the reverse
of the Harami pattern.
WARNING:
- For purpose educate only
- This script to change bars colors.

Candle Range Theory [Advanced] - AlgoVisionUnderstanding Candle Range Theory (CRT) in the AlgoVision Indicator
Candle Range Theory (CRT) is a structured approach to analyzing market movements within the price ranges of candlesticks. CRT is founded on the idea that each candlestick on a chart, regardless of timeframe, represents a distinct range of price action, marked by the candle's open, high, low, and close. This range gives insights into market dynamics, and when analyzed in lower timeframes, reveals patterns that indicate underlying market sentiment and institutional behaviors.
Key Concepts of Candle Range Theory
Candlestick Range: The range of a candlestick is simply the distance between its high and low. Across timeframes, this range highlights significant price behavior, with each candlestick representing a snapshot of price movement. The body (distance between open and close) shows the primary price action, while wicks (shadows) reflect price fluctuations or "noise" around this movement.
Multi-Timeframe Analysis: A higher-timeframe (HTF) candlestick can be dissected into smaller, structured price movements in lower timeframes (LTFs). By analyzing these smaller movements, traders gain a detailed view of the market’s progression within the HTF candlestick’s range. Each HTF candlestick’s high and low provide support and resistance levels on the LTF, where the price can "sweep," break out, or retest these levels.
Market Behavior within the Range: Price action within a range doesn’t move randomly; it follows structured behavior, often revealing patterns. By analyzing these patterns, CRT provides insights into the market’s intention to accumulate, manipulate, or distribute assets within these ranges. This behavior can indicate future market direction and increase the probability of accurate trading signals.
CRT and ICT Power of 3: Accumulation, Manipulation, and Distribution (AMD)
A foundational element of our CRT indicator is its combination with ICT’s Power of 3 (Accumulation, Manipulation, and Distribution or AMD). This approach identifies three stages of market movement:
Accumulation: During this phase, institutions accumulate positions within a tight price range, often leading to sideways movement. Here, price consolidates as institutions carefully enter or exit positions, erasing traces of their intent from public view.
Manipulation: Institutions often use manipulation to create false breakouts, targeting retail traders who enter the market on perceived breakouts or reversals. Manipulation is characterized by liquidity grabs, false breakouts, or stop hunts, as price momentarily moves outside the established range before quickly returning.
Distribution: Following accumulation and manipulation, the distribution phase aligns with the true market direction. Institutions now allow the market to move with the trend, initiating a stronger and more sustained price movement that aligns with their intended position.
This AMD cycle is often observed across multiple timeframes, allowing traders to refine entries and exits by identifying accumulation, manipulation, and distribution phases on smaller timeframes within the range of a higher-timeframe candle. CRT views this cycle as the "heartbeat" of the market—a continuous loop of price movements. With our indicator, you can identify this cycle on your current timeframe, with the signal candle acting as the "manipulation" candle.
How to Use the Premium AlgoVision CRT Indicator
1. Indicator Display Options
Bullish/Bearish Plot Indication: Toggles the display of bullish or bearish CRT signals. Turn this on to display signals on your chart or off to reduce screen clutter.
Order Block Indication: Highlights the order block entry price, which is the preferred entry point for CRT trades.
Purge Time Indication: Shows when the low or high of Candle 1 is purged by Candle 2, helping to identify potential manipulation points.
2. Filter Options
Match Indicator Candle with Signal: Ensures that only bullish Candle 2s (for longs) or bearish Candle 2s (for shorts) are signaled. This filter helps eliminate signals where the candlestick’s direction does not align with the CRT model.
Take Profit Already Reached: When enabled, this filter removes CRT signals if take profit levels are reached within Candle 2. This helps focus on setups where there’s still room for price movement.
Midnight Price Filter: Filters signals based on midnight price levels:
Longs: Only signals if the order block entry price is below the midnight price.
Shorts: Only signals if the order block entry price is above the midnight price.
3. Entry and Exit Settings
Wick out prevention: Allows positions to stay open and prevent getting wicked out. Positions will still be able to close if determined by the algorithm.
Buy/Sell: This allows you to set you daily bias. You can select to only see buys or sells.
Custom Stop Loss: Sets a custom stop loss distance from the entry price (e.g., $100 or $200 away) if the predefined stop loss based on Candle 2’s low/high doesn’t suit your preference.
Take Profit Levels: Choose from three take profit levels:
Optimized Take Profit: Uses an optimized take profit level based on CRT’s recommended exit point.
Take Profit 1: Sets an initial take profit level.
Take Profit 2: Sets a secondary take profit level for a more extended exit target.
Timeframe of Order Block: Select the timeframe of the order block entry, which can be tailored based on the timeframe of the CRT signal.
Risk-to-Reward Filter: Filters trades based on a specified risk-to-reward ratio, using the indicator’s stop loss as the base. This helps to ensure trades meet minimum reward criteria.
4. Risk Management
Fixed Entry QTY: This will allow you to open all positions with a fixed QTY
Risk to Reward Ratio: This allows you to set a minimum risk to reward ratio, the strategy will only take trades if this risk to reward is met.
Risk Type:
Fixed Amount: Allows you to risk a fixed $ amount.
% of account: Allows you to risk % of account equity.
5. Day and Time Filters
Filter by Days: Specify the days of the week for CRT signals to appear. For instance, you could enable signals only on Thursdays. This setting can be adjusted to any day or combination of days.
Purge Time Filter: Filters CRT signals based on specific purge times when Candle 1’s low/high is breached by Candle 2, as CRT setups are observed to work best during certain times.
Hour Filters for CRT Signals:
1-Hour CRT Times: Allows filtering CRT signals based on specific 1-hour time intervals.
4-Hour CRT Times: Filter 4-hour CRT signals based on specified times.
Forex and Futures Conversion: Adjusts times based on standard sessions for Forex (e.g., 9:00 AM 4-hour candle) and Futures (e.g., 10 PM candle for Futures or 8 AM for Crypto).
6. Currency and Asset-Specific Filters
Crypto vs. Forex Mode: This setting adjusts the indicator’s timing to match market sessions specific to either crypto or Forex/Futures, ensuring the CRT model aligns with the asset type.
Additional Notes
Backtesting Options: Adjust these to test risk management, such as risking a fixed amount or a percentage of the account, for historical performance insights.
Optimized Settings: This version includes all features and optimized settings, with the most refined data analysis.
Conclusion By combining CRT with ICT Power of 3, the AlgoVision Indicator allows traders to leverage the CRT candlestick as a versatile tool for identifying potential market moves. This method provides beginners and seasoned traders alike with a robust framework to understand market dynamics and refine trade strategies across timeframes. Setting alerts on the higher timeframe to catch bullish or bearish CRT signals allows you to plan and execute trades on the lower timeframe, aligning your strategy with the broader market flow.

Mutanabby_AI | Algo Pro Strategy# Mutanabby_AI | Algo Pro Strategy: Advanced Candlestick Pattern Trading System
## Strategy Overview
The Mutanabby_AI Algo Pro Strategy represents a systematic approach to automated trading based on advanced candlestick pattern recognition and multi-layered technical filtering. This strategy transforms traditional engulfing pattern analysis into a comprehensive trading system with sophisticated risk management and flexible position sizing capabilities.
The strategy operates on a long-only basis, entering positions when bullish engulfing patterns meet specific technical criteria and exiting when bearish engulfing patterns indicate potential trend reversals. The system incorporates multiple confirmation layers to enhance signal reliability while providing comprehensive customization options for different trading approaches and risk management preferences.
## Core Algorithm Architecture
The strategy foundation relies on bullish and bearish engulfing candlestick pattern recognition enhanced through technical analysis filtering mechanisms. Entry signals require simultaneous satisfaction of four distinct criteria: confirmed bullish engulfing pattern formation, candle stability analysis indicating decisive price action, RSI momentum confirmation below specified thresholds, and price decline verification over adjustable lookback periods.
The candle stability index measures the ratio between candlestick body size and total range including wicks, ensuring only well-formed patterns with clear directional conviction generate trading signals. This filtering mechanism eliminates indecisive market conditions where pattern reliability diminishes significantly.
RSI integration provides momentum confirmation by requiring oversold conditions before entry signal generation, ensuring alignment between pattern formation and underlying momentum characteristics. The RSI threshold remains fully adjustable to accommodate different market conditions and volatility environments.
Price decline verification examines whether current prices have decreased over a specified period, confirming that bullish engulfing patterns occur after meaningful downward movement rather than during sideways consolidation phases. This requirement enhances the probability of successful reversal pattern completion.
## Advanced Position Management System
The strategy incorporates dual position sizing methodologies to accommodate different account sizes and risk management approaches. Percentage-based position sizing calculates trade quantities as equity percentages, enabling consistent risk exposure across varying account balances and market conditions. This approach proves particularly valuable for systematic trading approaches and portfolio management applications.
Fixed quantity sizing provides precise control over trade sizes independent of account equity fluctuations, offering predictable position management for specific trading strategies or when implementing precise risk allocation models. The system enables seamless switching between sizing methods through simple configuration adjustments.
Position quantity calculations integrate seamlessly with TradingView's strategy testing framework, ensuring accurate backtesting results and realistic performance evaluation across different market conditions and time periods. The implementation maintains consistency between historical testing and live trading applications.
## Comprehensive Risk Management Framework
The strategy features dual stop loss methodologies addressing different risk management philosophies and market analysis approaches. Entry price-based stop losses calculate stop levels as fixed percentages below entry prices, providing predictable risk exposure and consistent risk-reward ratio maintenance across all trades.
The percentage-based stop loss system enables precise risk control by limiting maximum loss per trade to predetermined levels regardless of market volatility or entry timing. This approach proves essential for systematic trading strategies requiring consistent risk parameters and capital preservation during adverse market conditions.
Lowest low-based stop losses identify recent price support levels by analyzing minimum prices over adjustable lookback periods, placing stops below these technical levels with additional buffer percentages. This methodology aligns stop placement with market structure rather than arbitrary percentage calculations, potentially improving stop loss effectiveness during normal market fluctuations.
The lookback period adjustment enables optimization for different timeframes and market characteristics, with shorter periods providing tighter stops for active trading and longer periods offering broader stops suitable for position trading approaches. Buffer percentage additions ensure stops remain below obvious support levels where other market participants might place similar orders.
## Visual Customization and Interface Design
The strategy provides comprehensive visual customization through eight predefined color schemes designed for different chart backgrounds and personal preferences. Color scheme options include Classic bright green and red combinations, Ocean themes featuring blue and orange contrasts, Sunset combinations using gold and crimson, and Neon schemes providing high visibility through bright color selections.
Professional color schemes such as Forest, Royal, and Fire themes offer sophisticated alternatives suitable for business presentations and professional trading environments. The Custom color scheme enables precise color selection through individual color picker controls, maintaining maximum flexibility for specific visual requirements.
Label styling options accommodate different chart analysis preferences through text bubble, triangle, and arrow display formats. Size adjustments range from tiny through huge settings, ensuring appropriate visual scaling across different screen resolutions and chart configurations. Text color customization maintains readability across various chart themes and background selections.
## Signal Quality Enhancement Features
The strategy incorporates signal filtering mechanisms designed to eliminate repetitive signal generation during choppy market conditions. The disable repeating signals option prevents consecutive identical signals until opposing conditions occur, reducing overtrading during consolidation phases and improving overall signal quality.
Signal confirmation requirements ensure all technical criteria align before trade execution, reducing false signal occurrence while maintaining reasonable trading frequency for active strategies. The multi-layered approach balances signal quality against opportunity frequency through adjustable parameter optimization.
Entry and exit visualization provides clear trade identification through customizable labels positioned at relevant price levels. Stop loss visualization displays active risk levels through colored line plots, ensuring complete transparency regarding current risk management parameters during live trading operations.
## Implementation Guidelines and Optimization
The strategy performs effectively across multiple timeframes with optimal results typically occurring on intermediate timeframes ranging from fifteen minutes through four hours. Higher timeframes provide more reliable pattern formation and reduced false signal occurrence, while lower timeframes increase trading frequency at the expense of some signal reliability.
Parameter optimization should focus on RSI threshold adjustments based on market volatility characteristics and candlestick pattern timeframe analysis. Higher RSI thresholds generate fewer but potentially higher quality signals, while lower thresholds increase signal frequency with corresponding reliability considerations.
Stop loss method selection depends on trading style preferences and market analysis philosophy. Entry price-based stops suit systematic approaches requiring consistent risk parameters, while lowest low-based stops align with technical analysis methodologies emphasizing market structure recognition.
## Performance Considerations and Risk Disclosure
The strategy operates exclusively on long positions, making it unsuitable for bear market conditions or extended downtrend periods. Users should consider market environment analysis and broader trend assessment before implementing the strategy during adverse market conditions.
Candlestick pattern reliability varies significantly across different market conditions, with higher reliability typically occurring during trending markets compared to ranging or volatile conditions. Strategy performance may deteriorate during periods of reduced pattern effectiveness or increased market noise.
Risk management through stop loss implementation remains essential for capital preservation during adverse market movements. The strategy does not guarantee profitable outcomes and requires proper position sizing and risk management to prevent significant capital loss during unfavorable trading periods.
## Technical Specifications
The strategy utilizes standard TradingView Pine Script functions ensuring compatibility across all supported instruments and timeframes. Default configuration employs 14-period RSI calculations, adjustable candle stability thresholds, and customizable price decline verification periods optimized for general market conditions.
Initial capital settings default to $10,000 with percentage-based equity allocation, though users can adjust these parameters based on account size and risk tolerance requirements. The strategy maintains detailed trade logs and performance metrics through TradingView's integrated backtesting framework.
Alert integration enables real-time notification of entry and exit signals, stop loss executions, and other significant trading events. The comprehensive alert system supports automated trading applications and manual trade management approaches through detailed signal information provision.
## Conclusion
The Mutanabby_AI Algo Pro Strategy provides a systematic framework for candlestick pattern trading with comprehensive risk management and position sizing flexibility. The strategy's strength lies in its multi-layered confirmation approach and sophisticated customization options, enabling adaptation to various trading styles and market conditions.
Successful implementation requires understanding of candlestick pattern analysis principles and appropriate parameter optimization for specific market characteristics. The strategy serves traders seeking automated execution of proven technical analysis techniques while maintaining comprehensive control over risk management and position sizing methodologies.

Bullish Reversal Bar Strategy [Skyrexio]Overview
Bullish Reversal Bar Strategy leverages the combination of candlestick pattern Bullish Reversal Bar (description in Methodology and Justification of Methodology), Williams Alligator indicator and Williams Fractals to create the high probability setups. Candlestick pattern is used for the entering into trade, while the combination of Williams Alligator and Fractals is used for the trend approximation as close condition. Strategy uses only long trades.
Unique Features
No fixed stop-loss and take profit: Instead of fixed stop-loss level strategy utilizes technical condition obtained by Fractals and Alligator or the candlestick pattern invalidation to identify when current uptrend is likely to be over (more information in "Methodology" and "Justification of Methodology" paragraphs)
Configurable Trading Periods: Users can tailor the strategy to specific market windows, adapting to different market conditions.
Trend Trade Filter: strategy uses Alligator and Fractal combination as high probability trend filter.
Methodology
The strategy opens long trade when the following price met the conditions:
1.Current candle's high shall be below the Williams Alligator's lines (Jaw, Lips, Teeth)(all details in "Justification of Methodology" paragraph)
2.Price shall create the candlestick pattern "Bullish Reversal Bar". Optionally if MFI and AO filters are enabled current candle shall have the decreasing AO and at least one of three recent bars shall have the squat state on the MFI (all details in "Justification of Methodology" paragraph)
3.If price breaks through the high of the candle marked as the "Bullish Reversal Bar" the long trade is open at the price one tick above the candle's high
4.Initial stop loss is placed at the Bullish Reversal Bar's candle's low
5.If price hit the Bullish Reversal Bar's low before hitting the entry price potential trade is cancelled
6.If trade is active and initial stop loss has not been hit, trade is closed when the combination of Alligator and Williams Fractals shall consider current trend change from upward to downward.
Strategy settings
In the inputs window user can setup strategy setting:
Enable MFI (if true trades are filtered using Market Facilitation Index (MFI) condition all details in "Justification of Methodology" paragraph), by default = false)
Enable AO (if true trades are filtered using Awesome Oscillator (AO) condition all details in "Justification of Methodology" paragraph), by default = false)
Justification of Methodology
Let's explore the key concepts of this strategy and understand how they work together. The first and key concept is the Bullish Reversal Bar candlestick pattern. This is just the single bar pattern. The rules are simple:
Candle shall be closed in it's upper half
High of this candle shall be below all three Alligator's lines (Jaw, Lips, Teeth)
Next, let’s discuss the short-term trend filter, which combines the Williams Alligator and Williams Fractals. Williams Alligator
Developed by Bill Williams, the Alligator is a technical indicator that identifies trends and potential market reversals. It consists of three smoothed moving averages:
Jaw (Blue Line): The slowest of the three, based on a 13-period smoothed moving average shifted 8 bars ahead.
Teeth (Red Line): The medium-speed line, derived from an 8-period smoothed moving average shifted 5 bars forward.
Lips (Green Line): The fastest line, calculated using a 5-period smoothed moving average shifted 3 bars forward.
When the lines diverge and align in order, the "Alligator" is "awake," signaling a strong trend. When the lines overlap or intertwine, the "Alligator" is "asleep," indicating a range-bound or sideways market. This indicator helps traders determine when to enter or avoid trades.
Fractals, another tool by Bill Williams, help identify potential reversal points on a price chart. A fractal forms over at least five consecutive bars, with the middle bar showing either:
Up Fractal: Occurs when the middle bar has a higher high than the two preceding and two following bars, suggesting a potential downward reversal.
Down Fractal: Happens when the middle bar shows a lower low than the surrounding two bars, hinting at a possible upward reversal.
Traders often use fractals alongside other indicators to confirm trends or reversals, enhancing decision-making accuracy.
How do these tools work together in this strategy? Let’s consider an example of an uptrend.
When the price breaks above an up fractal, it signals a potential bullish trend. This occurs because the up fractal represents a shift in market behavior, where a temporary high was formed due to selling pressure. If the price revisits this level and breaks through, it suggests the market sentiment has turned bullish.
The breakout must occur above the Alligator’s teeth line to confirm the trend. A breakout below the teeth is considered invalid, and the downtrend might still persist. Conversely, in a downtrend, the same logic applies with down fractals.
How we can use all these indicators in this strategy? This strategy is a counter trend one. Candle's high shall be below all Alligator's lines. During this market stage the bullish reversal bar candlestick pattern shall be printed. This bar during the downtrend is a high probability setup for the potential reversal to the upside: bulls were able to close the price in the upper half of a candle. The breaking of its high is a high probability signal that trend change is confirmed and script opens long trade. If market continues going down and break down the bullish reversal bar's low potential trend change has been invalidated and strategy close long trade.
If market really reversed and started moving to the upside strategy waits for the trend change form the downtrend to the uptrend according to approximation of Alligator and Fractals combination. If this change happens strategy close the trade. This approach helps to stay in the long trade while the uptrend continuation is likely and close it if there is a high probability of the uptrend finish.
Optionally users can enable MFI and AO filters. First of all, let's briefly explain what are these two indicators. The Awesome Oscillator (AO), created by Bill Williams, is a momentum-based indicator that evaluates market momentum by comparing recent price activity to a broader historical context. It assists traders in identifying potential trend reversals and gauging trend strength.
AO = SMA5(Median Price) − SMA34(Median Price)
where:
Median Price = (High + Low) / 2
SMA5 = 5-period Simple Moving Average of the Median Price
SMA 34 = 34-period Simple Moving Average of the Median Price
This indicator is filtering signals in the following way: if current AO bar is decreasing this candle can be interpreted as a bullish reversal bar. This logic is applicable because initially this strategy is a trend reversal, it is searching for the high probability setup against the current trend. Decreasing AO is the additional high probability filter of a downtrend.
Let's briefly look what is MFI. The Market Facilitation Index (MFI) is a technical indicator that measures the price movement per unit of volume, helping traders gauge the efficiency of price movement in relation to trading volume. Here's how you can calculate it:
MFI = (High−Low)/Volume
MFI can be used in combination with volume, so we can divide 4 states. Bill Williams introduced these to help traders interpret the interaction between volume and price movement. Here’s a quick summary:
Green Window (Increased MFI & Increased Volume): Indicates strong momentum with both price and volume increasing. Often a sign of trend continuation, as both buying and selling interest are rising.
Fake Window (Increased MFI & Decreased Volume): Shows that price is moving but with lower volume, suggesting weak support for the trend. This can signal a potential end of the current trend.
Squat Window (Decreased MFI & Increased Volume): Shows high volume but little price movement, indicating a tug-of-war between buyers and sellers. This often precedes a breakout as the pressure builds.
Fade Window (Decreased MFI & Decreased Volume): Indicates a lack of interest from both buyers and sellers, leading to lower momentum. This typically happens in range-bound markets and may signal consolidation before a new move.
For our purposes we are interested in squat bars. This is the sign that volume cannot move the price easily. This type of bar increases the probability of trend reversal. In this indicator we added to enable the MFI filter of reversal bars. If potential reversal bar or two preceding bars have squat state this bar can be interpret as a reversal one.
Backtest Results
Operating window: Date range of backtests is 2023.01.01 - 2024.12.31. It is chosen to let the strategy to close all opened positions.
Commission and Slippage: Includes a standard Binance commission of 0.1% and accounts for possible slippage over 5 ticks.
Initial capital: 10000 USDT
Percent of capital used in every trade: 50%
Maximum Single Position Loss: -5.29%
Maximum Single Profit: +29.99%
Net Profit: +5472.66 USDT (+54.73%)
Total Trades: 103 (33.98% win rate)
Profit Factor: 1.634
Maximum Accumulated Loss: 1231.15 USDT (-8.32%)
Average Profit per Trade: 53.13 USDT (+0.94%)
Average Trade Duration: 76 hours
How to Use
Add the script to favorites for easy access.
Apply to the desired timeframe and chart (optimal performance observed on 4h ETH/USDT).
Configure settings using the dropdown choice list in the built-in menu.
Set up alerts to automate strategy positions through web hook with the text: {{strategy.order.alert_message}}
Disclaimer:
Educational and informational tool reflecting Skyrex commitment to informed trading. Past performance does not guarantee future results. Test strategies in a simulated environment before live implementation
These results are obtained with realistic parameters representing trading conditions observed at major exchanges such as Binance and with realistic trading portfolio usage parameters.

Price and Volume Breakout Buy Strategy [TradeDots]The "Price and Volume Breakout Buy Strategy" is a trading strategy designed to identify buying opportunities by detecting concurrent price and volume breakouts over a specified range of candlesticks.
This strategy is optimized for assets demonstrating high volatility and significant momentum spikes.
HOW IT WORKS
The strategy first takes the specific number of candlesticks as the examination window for both price and volume.
These values are used as benchmarks to identify breakout conditions.
A trade is initiated when both the closing price and the trading volume surpass the maximum values observed within the predetermined window.
Price must be above a designated moving average, serving as the trend indicator, ensuring that all trades align with the prevailing market trend.
APPLICATION
This strategy is particularly effective for highly volatile assets such as Bitcoin and Ethereum, capitalizing on the cues from sudden price and volume breakouts indicative of significant market movement, often driven by market smart money traders.
However, for broader markets like the S&P 500, this strategy may be less effective due to less pronounced volume and price shifts compared to the cryptocurrency markets.
DEFAULT SETUP
Commission: 0.01%
Initial Capital: $10,000
Equity per Trade: 70%
Backtest result sometimes gives fewer than 100 trades under certain higher timeframes, as most trades tend to have a long holding period. Entry conditions are also more stringent, which, combined with the relatively brief history of cryptocurrencies, results in fewer trades on longer timeframes.
Users are advised to adjust and personalize this trading strategy to better match their individual trading preferences and style.
RISK DISCLAIMER
Trading entails substantial risk, and most day traders incur losses. All content, tools, scripts, articles, and education provided by TradeDots serve purely informational and educational purposes. Past performances are not definitive predictors of future results.

Trend-based Price Action StrategyThis is a strategy script that combines trend-based price action analysis with the Relative Strength Index (RSI) and Exponential Moving Averages (EMA) as trend filters. Here's a summary of the key components and logic:
Price Action Candlestick Patterns:
Bullish patterns: Engulfing candle and Morning Star.
Bearish patterns: Engulfing candle and Evening Star.
RSI Integration:
RSI is used to identify overbought and oversold conditions.
EMA Trend Filter:
Three EMAs with different periods: Fast , Medium and Slow.
Long trend condition occur when the fast EMA is above the medium and the medium is above the slow EMA.
Short trend condition occur when the slow EMA is above the medium and the medium is above the fast EMA.
Long entry conditions: RSI is oversold, RSI is decreasing, bullish candlestick pattern, and EMA trend filter conditions are met.
Short entry conditions: RSI is overbought, RSI is decreasing, bearish candlestick pattern, and EMA trend filter conditions are met.
Exit conditions:
Take profit or stop loss is reached.
Plotting:
Signals are plotted on the chart when entry conditions are met.
EMAs are plotted when the EMA trend filter is enabled.
This script aims to capture potential trend reversal points based on a combination of candlestick patterns, RSI, and EMA trend analysis.
Traders can use this script as a starting point for further customization or as a reference for developing their own trading strategies. It's important to note that past performance is not indicative of future results, and thorough testing and validation are recommended before deploying any trading strategy.

Buy&Sell Bullish Engulfing - The Quant Science🇺🇸
GENERAL OVERVIEW
Buy&Sell Bullish Engulfing - The Quant Science It is a Buy&Sell strategy based on the 'Bullish Engulfing' candlestick pattern. The main goal of the strategy is to achieve a consistent and sustainable return over time, with a manageable level of risk.
Bullish Engulfing
The template was developed at the top of the Indicator provided by TradingView called 'Engulfing - Bullish'.
ENTRY AND EXIT CRITERIA
Entry: A single long order is opened when the candlestick pattern is formed, and the percentage size of the order (%) is fixed by the trader through the user interface.
Exit: The long trade is closed on a percentage equity take profit-stop loss.
----------------------------------------------------------------------------------------------------------------------------------------------------------------------------------------------
🇮🇹
PANORAMICA GENERALE
Buy&Sell Bullish Engulfing - The Quant Science è una strategia Buy&Sell basata sul candlestick pattern 'Bullish Engulfing'. L'obiettivo principale della strategia è ottenere un ritorno costante e sostenibile nel tempo, con un livello gestibile di rischio.
Bullish Engulfing
Il template è stato sviluppato al top dell' Indicatore fornito da Trading View chiamato 'Engulfing - Bullish'.
CRITERI DI ENTRATA E USCITA
Entrata: viene aperto un singolo ordine long quando si forma il candlestick pattern, la size percentuale dell'ordine (%) viene selezionato tramite l'interfaccia utente dal trader.
Uscita: la chiusura della posizione avviene unicamente tramite un take profit-stop loss percentuale calcolato sul capitale.
