Buscar en scripts para "Buy sell"
kido-quarry metric 2018(buy/sell indicator)This is an indicator of when to buy/sell.
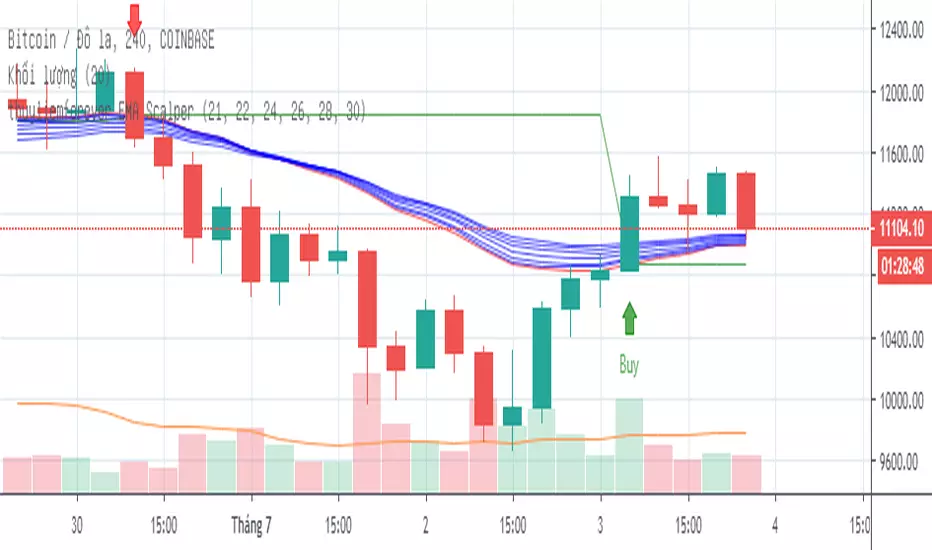
The blue background represents the current trend.
And, I tested the accuracy at 45 minutes,/4 hours,/1 days.
If you have any questions, please write to comments.
I would appreciate your feedback. :)

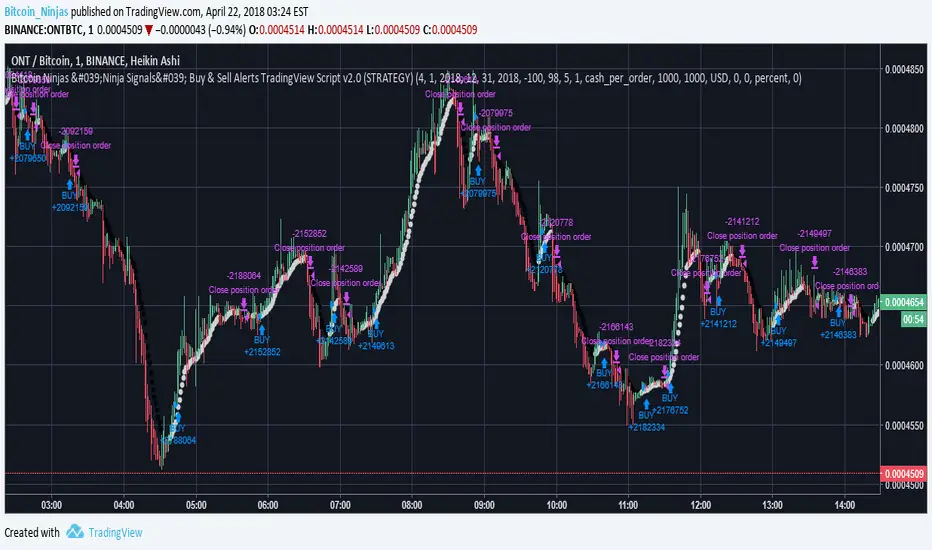
BitcoinNinjas Ninja Signals Buy/Sell Alert Trading Strategy v2.0Bitcoin Ninjas 'Ninja Signals' Buy/Sell Alerts & Backtesting TradingView Script v2.0
(for Cryptocurrencies, Forex, GunBot, ProfitTrailer, automatic trading software, and more)
'Ninja Signals' v2.0 (SCRIPT)
'Ninja Signals' v2.0 (STRATEGY)
'Ninja Signals' v1.0 (SCRIPT)
'Ninja Signals' v1.0 (STRATEGY)
-Allows users to easily set automated buy and sell alerts on TradingView for use with automatic and manual trading of cryptocurrencies, Forex securities, and more (alerts are compatible with automatic trading software such as GunBot, ProfitTrailer, and more).
-Synthesizes many powerful indicators [e.g. Relative Strength Index (RSI), stochastic RSI, Money Flow Index (MFI), Moving Average Convergence Divergence (MACD), etc.) into one super script to generate very precise buy and sell signals in almost any market condition.
-Buy arrows (blue) and sell arrows (red) can be changed or hidden for ease of viewing.
-No lag EMA trendline featuring trend-reversal color-coding (white uptrend, black downtrend).
-Adjustable ‘calibration’ setting allows users to customize the script to work for any currency or security available through TradingView, on any exchange, simply by adjusting a number.
-Complete with backtesting strategy version of script which allows users to test various buy and sell strategies based on the alerts the script generates (see info and screenshots below).
-Backtesting strategy incorporates a user-defined adjustable date range, so users can estimate the script’s performance over specific periods of time, such as the last day, week, or month.
-Backtesting strategy utilizes a minimum protective gain setting to help you never sell for a loss. Simply adjust your minimum profit (%) per trade, and the test results will update.
-Backtesting strategy allows for pyramid buying to test various average down / double up buying strategies. Simply adjust the number of pyramid buys and the quantity of each buy.
- Free 7-day trial available for TradingView users who join our free BitcoinNinjas community.
-Free 24/7 support via BitcoinNinjas Telegram GunBot support group with script purchase.
-Fully compatible with GunBot automatic trading software (TradingView plugin is required).
-Special discount available for traders who purchase GunBot automatic trading software and the GunBot TradingView plugin from BitcoinNinjas, allowing for fully automatic trading.
-Contact us via Email or Telegram for more information, to request additional / custom screenshots, or to start your free trial.
DISCLAIMER: By using this BitcoinNinjas document or ‘Ninja Signals’ planning script, you agree to the BitcoinNinjas 'Terms of Use', as presented on our website (www.BitcoinNinjas.org) and as stated here. No sharing, copying, reselling, modifying, or any other forms of use are authorized for our documents, script / strategy, and the information published with them. This informational document and planning script / strategy is strictly for individual use and educational purposes only. This is not financial or investment advice. Investments are always made at your own risk and are based on your personal judgement. BitcoinNinjas is not responsible for any losses you may incur. Please invest wisely.
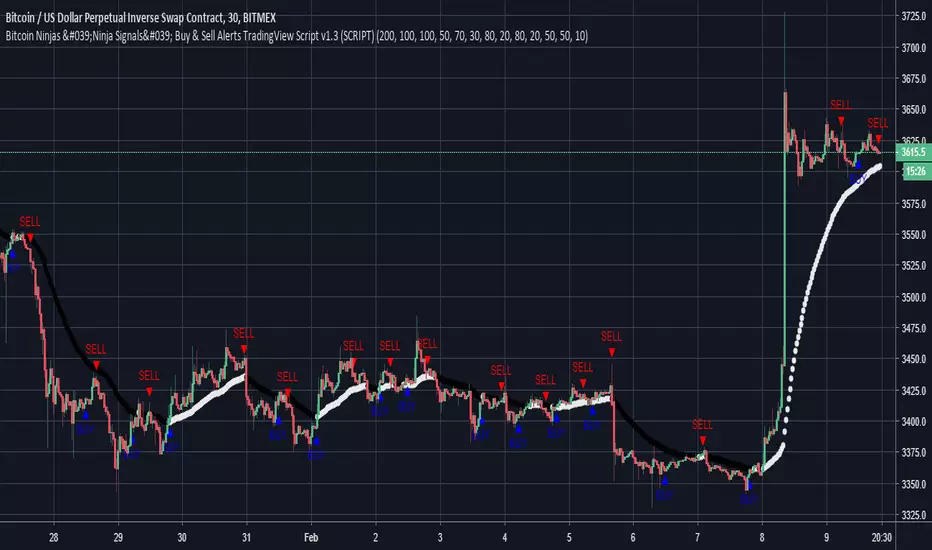
Bitcoin Ninjas 'Ninja Signals' Buy & Sell Alert Trading ScriptBitcoin Ninjas 'Ninja Signals' Buy/Sell Alerts & Backtesting TradingView Script
(for Cryptocurrencies, Forex, GunBot, ProfitTrailer, automatic trading software, and more)
-Allows users to easily set automated buy and sell alerts on TradingView for use with automatic and manual trading of cryptocurrencies, Forex securities, and more (alerts are compatible with automatic trading software such as GunBot, ProfitTrailer, and more).
-Synthesizes many powerful indicators [e.g. Relative Strength Index (RSI), stochastic RSI, Money Flow Index (MFI), Moving Average Convergence Divergence (MACD), etc.) into one super script to generate very precise buy and sell signals in almost any market condition.
-Buy arrows (blue) and sell arrows (red) can be changed or hidden for ease of viewing.
-No lag EMA trendline featuring trend-reversal color-coding (white uptrend, black downtrend).
-Adjustable ‘calibration’ setting allows users to customize the script to work for any currency or security available through TradingView, on any exchange, simply by adjusting a number.
-Complete with backtesting strategy version of script which allows users to test various buy and sell strategies based on the alerts the script generates (see info and screenshots below).
-Backtesting strategy incorporates a user-defined adjustable date range, so users can estimate the script’s performance over specific periods of time, such as the last day, week, or month.
-Backtesting strategy utilizes a minimum protective gain setting to help you never sell for a loss. Simply adjust your minimum profit (%) per trade, and the test results will update.
-Backtesting strategy allows for pyramid buying to test various average down / double up buying strategies. Simply adjust the number of pyramid buys and the quantity of each buy.
-Free 7-day trial available for TradingView users who join our free BitcoinNinjas community.
-Free 24/7 support via BitcoinNinjas Telegram GunBot support group with script purchase.
-Fully compatible with GunBot automatic trading software (TradingView plugin is required).
-Special discount available for traders who purchase GunBot automatic trading software and the GunBot TradingView plugin from BitcoinNinjas, allowing for fully automatic trading.
-Contact us for more information, to request additional / custom screenshots, or to start your free trial.
DISCLAIMER: By viewing and/or using this TradingView script, you agree to the BitcoinNinjas 'Terms of Use', as presented on our website and as stated here. No sharing, copying, reselling, modifying, or any other forms of use, are authorized for this document. This document is strictly for individual use and informational purposes only. This is not financial or investment advice. Investments are always made at your own risk, and are ba
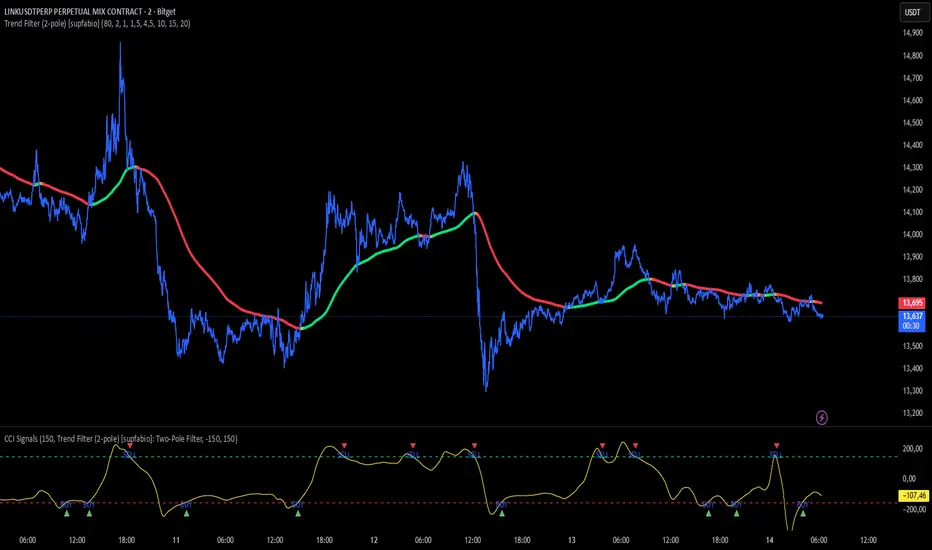
CCI + Buy/Sell Cross (supfabio)This indicator is an enhanced version of the Commodity Channel Index (CCI) designed to generate clear BUY and SELL signals based on customizable level crossovers, with built-in support for webhook automation and external trade execution.
🔹 Signal Logic
BUY Signal:
Triggered when the CCI crosses upward (from below to above) the user-defined BUY level (red line).
SELL Signal:
Triggered when the CCI crosses downward (from above to below) the user-defined SELL level (green line).
Signals can optionally be configured to trigger only on candle close, reducing real-time noise and false signals.
🔹 Key Features
✅ Original CCI calculation (standard formula preserved)
✅ Fully configurable BUY and SELL levels
✅ Optional display of signal level lines
✅ Visual BUY / SELL markers plotted on the CCI panel
✅ Support for moving average smoothing and Bollinger Bands applied to the CCI
✅ Dynamic alerts using alert(), ideal for:
Webhook integrations
Trading bots
External servers and automated execution systems
🔹 Alerts & Webhook Integration
The indicator sends dynamic alert messages containing:
Action type (BUY / SELL)
Symbol
Closing price
Timestamp
To use:
Add the indicator to your chart
Create an alert and select “Any alert() function call”
Enable Webhook URL and configure your endpoint
Done — signals will be sent automatically
🔹 Best Use Cases
Traders who use CCI as a primary entry trigger
Momentum or mean-reversion strategies
Automated trading systems
Visual backtesting and signal validation
⚠️ Disclaimer
This indicator is not a complete trading system and does not replace proper risk management. Always use it in combination with market context, confirmation tools, and sound position sizing.
GOLD 5m Buy/Sell Pro//@version=5
indicator("GOLD 5m Buy/Sell Pro", overlay = true, timeframe = "5", timeframe_gaps = true)

Structure Breakout - Buy Sell IndicatorStructure Breakout - Buy Sell Indicator
📈 OVERVIEW:
A minimalist indicator that identifies market structure breakouts using swing point analysis.
Displays clear blue buy arrows and red sell arrows when price breaks key swing levels.
🔧 HOW IT WORKS:
1. Identifies swing highs and lows using configurable lookback period
2. Triggers BUY signal (blue arrow) when price closes above previous swing high
3. Triggers SELL signal (red arrow) when price closes below previous swing low
4. Uses clean visual arrows without cluttering the chart
⚙️ KEY FEATURES:
• Clean, uncluttered visual signals
• Customizable sensitivity period
• Blue arrows for buy signals (below bars)
• Red arrows for sell signals (above bars)
• No lagging repainting
• Works on all timeframes
🎯 TRADING APPLICATIONS:
• Swing trading entries
• Breakout confirmation
• Trend continuation signals
• Support/resistance breaks
⚡ SETTINGS:
• Structure Detection Period (default: 20) - Adjust sensitivity of swing detection
⚠️ RISK DISCLAIMER:
This is an educational tool. Always use proper risk management.
Past performance does not guarantee future results.

Stoch RSI Buy/Sell Signals with AlertsThis color code helps a novice know when to buy and when to sell
What Each Section Does
Header: //@version=5 tells TradingView which Pine Script version to use.
Indicator setup: indicator("Stoch RSI Buy/Sell Signals with Alerts", overlay=false) names your script and sets it to plot in a separate panel.
Inputs: Adjustable parameters for RSI length, Stoch length, and smoothing. You can tweak these in the settings panel.
Calculations: Builds RSI, then Stoch RSI, then smooths into %K and %D lines.
Signals: Defines buy (green) and sell (red) conditions based on crossovers and thresholds.
Color logic: Dynamically changes the %K line color (green/red/gray).
Plots: Draws %K (colored) and %D (blue) lines.
Background shading: Adds light green/red shading when signals fire for easy visual scanning.
Alerts: Pops up TradingView alerts when buy/sell conditions trigger, so you don’t miss them.
✅ Publishing Notes
Paste this into a new blank Pine Script editor starting at line 1.
Save and add it to your chart.
You’ll see the %K line flip colors, background shading, and alerts firing when conditions are met.

BHA BUY SELLit will generate BUY SELL Signals and Support and Resistance levels and works on all instruments and all timeframes

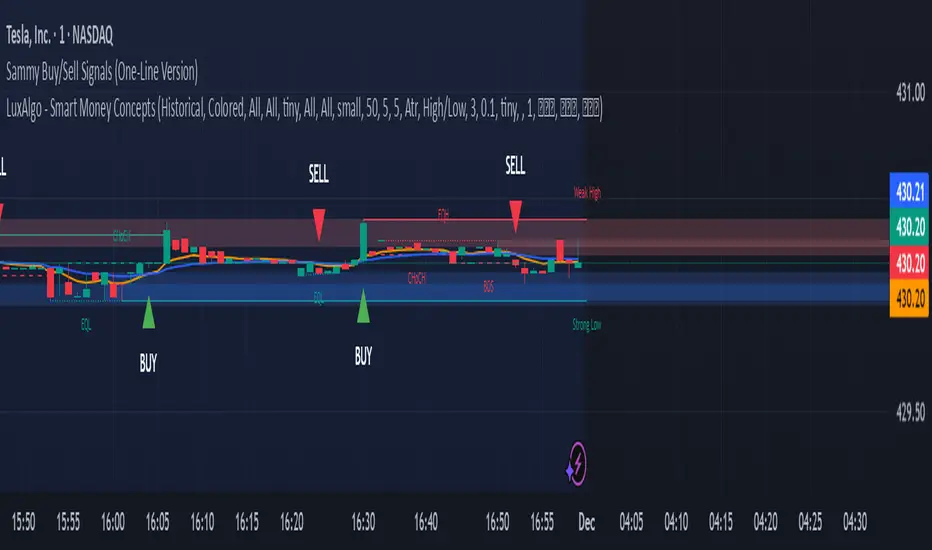
Sammy Buy/Sell Signals (OneLine Version)Sammy's buy/sell signals one line version. Very simple to follow what's going up and down.
PALUTLA BUY SELL✅ BUY Signal Logic
A BUY label appears when:
EMA 9 crosses ABOVE EMA 21
AND
Price is trading ABOVE VWAP
This confirms that short-term momentum has turned bullish and price is aligned with the day’s average value — a strong intraday uptrend setup.
🔻 SELL Signal Logic
A SELL label appears when:
EMA 9 crosses BELOW EMA 21
AND
Price is trading BELOW VWAP
This confirms bearish momentum and trade alignment below value, indicating downward continuation potential.
🎯 Visual Features
• Green background / BUY labels → Bullish zone
• Red background / SELL labels → Bearish zone
• Grey background → No-trade zone
• EMA 9 and EMA 21 plotted on the price chart
• VWAP plotted as the session trend reference line
• Clear BUY/SELL labels on crossover candles
⏱ Best Timeframes
➡ Works best on intraday charts:
1m – 15m
VWAP is session-based, so daily/weekly timeframes are not recommended.
⚠️ Disclaimer
This indicator provides technical trade signals only.
Not financial advice.
Always use proper risk management and confirmation before trading.

VWAP SESSION BUY SELL STRATEGY (INDICATOR) (PDK1977)VWAP SESSION BUY SELL STRATEGY (INDICATOR) (PDK1977)
This indicator combines the proven UT Bot breakout engine but with VWAP directional filtering and ATR-based take profit levels.
It delivers clean, high-probability trend entries and automatic volatility-calibrated exits.
How it works:
Buy only when price is above VWAP
Sell only when price is below VWAP
UT Bot confirms momentum with ATR-based trailing logic
ATR Take Profit gives consistent exits based on volatility
Bars turn green/red only while in a trade, back to normal after TP
Best For:
Intraday and swing trading
Indices, FX, crypto, and high-volume stocks but also for Forex with right TF and settings
Traders who want clean signals and minimal noise
2. Trade Checklist:
Use this before every entry. Quick, simple, reliable.
BUY Checklist:
Price confirmed above VWAP
Label prints BUY
Enter on Buy label (on bar close)
→ Hold until ATR TP hits
SELL Checklist:
Price below VWAP
Label prints SELL
Enter on Sell label
→ Hold until ATR TP hits
Avoid Entries When:
Price is chopping tightly around VWAP
Major news events are about to release
Volume is extremely low
ATR is shrinking rapidly (market compression)
3. Risk-Management Guide
This is tailored to how your system actually behaves.
1. Use ATR TP as Primary Exit:
The system automatically calculates a TP based on volatility:
High volatility → larger TP
Low volatility → smaller TP
This keeps trades consistent and avoids lingering too long.
2. Stop-Loss Recommendation
This strategy is designed for TP-only exits, but if you want a SL:
Recommended Stop-Loss:
Use ATR’s opposite trail, OR
Use 1 × ATR behind your entry candle
This matches the system's internal logic.
3. Position Sizing
Since this system enters during momentum expansions, use:
1–2% max risk per trade
Reduce risk during high-impact news sessions
4. Understand VWAP Environment
Different VWAP conditions require different expectations:
Strong Trend (price far from VWAP)
Higher TP probability
Fewer whipsaws
Excellent continuation setups
Chop Zone (price flips above/below VWAP)
Do NOT trade
Signals lose edge
Wait for a clean break + UT confirmation
5. Choose Correct VWAP Reset for your trading and session
This dramatically improves results.
Market Recommended VWAP Reset
US Stocks New York Session
Indices Daily
Forex London or New York
Crypto Daily or None
4. Final Tips for Best Performance
✔ Enter only in the direction of VWAP
✔ Don’t chase signals far away from entry candle
✔ Avoid trading right into major support/resistance
✔ ATR TP will handle exits mostly
Disclaimer
This script is provided for educational and informational purposes only.
It does not constitute financial advice, investment advice, trading advice, or any form of recommendation to buy or sell any financial instrument. The auto take no responsibility for loss or error in the script.

Live Bollinger Buy/Sell Signal + Custom EMA by RAJU📌 DESCRIPTION
Live Bollinger Buy/Sell Signal is a price-action-based entry system built on Bollinger Bands. This indicator automatically detects high-probability reversal points when price interacts with the outer Bollinger Bands and provides instant Buy & Sell signals directly on the chart. It is designed for traders who want clean and fast signals without complex settings.
________________________________________
🧠 LOGIC OF INDICATOR
The indicator uses a standard Bollinger Band setup (SMA + Standard deviation).
A Buy or Sell signal is triggered when a candle forms outside or near the Bollinger Band extremes and then reverses direction. This behaviour often indicates a potential trend reversal or strong bounce from volatility exhaustion.
________________________________________
⚙ USER INPUT
Setting Description
Bollinger Band Length SMA period length used to form Bollinger Bands (Default: 20)
Std.Dev Multiplier Standard deviation multiplier for upper/lower bands (Default: 2.0)
________________________________________
🟩 LONG CONDITION (Buy Signal)
A Buy signal is plotted when:
• The candle closes bullish (close > open)
• The candle opens below the lower Bollinger Band
• The candle closes back above the lower Bollinger Band
• The next candle must trade above signal candle
• If a candle before or after signal candle closes without touching 5 EMA then probability of reversal is high (optional)
This indicates a strong price rejection from oversold levels.
________________________________________
🟥 SHORT CONDITION (Sell Signal)
A Sell signal is plotted when:
• The candle closes bearish (close < open)
• The candle opens above the upper Bollinger Band
• The candle closes back below the upper Bollinger Band
• The next candle must trade below signal candle
• If a candle before or after signal candle closes without touching 5 EMA then probability of reversal is high (optional)
This indicates a strong rejection from overbought levels.
________________________________________
📤 LONG EXIT
Users may exit long trades when:
• A Sell signal appears and signal candle closes without touching 5 EMA, or
• Price reaches the middle SMA line, or
• Personal trailing stop or resistance level is reached
________________________________________
📥 SHORT EXIT
Users may exit short trades when:
• A Buy signal appears and signal candle closes without touching 5 EMA, or
• Price reaches the middle SMA line, or
• Personal trailing stop or support level is reached
________________________________________
🌟 WHY IT IS UNIQUE
• Extremely simple yet powerful price-action confirmation mechanism
• No repainting — signals appear only after candle close
• Works across all timeframes and markets (Crypto, Forex, Stocks, Indices)
• Built-in signal level plotting to verify correct candle positioning
• Fast visual signal markers without clutter
________________________________________
💹 HOW USER CAN BE BENEFITED FROM THIS
• Helps traders catch early reversal entries with high probability
• Reduces emotional decision-making with visual Buy/Sell arrows
• Ideal for scalping, intraday, and swing strategies
• Can be used as an entry confirmation with other indicators like RSI, MACD, or trend filters
• Helps avoid false breakouts by confirming rejection from volatility extremes
________________________________________
⚠ DISCLAIMER: This tool is for educational purposes only and not trading advice. Always use proper risk management.

FBB Buy/Sell ProDisclaimer : This script is for educational purposes only and does not constitute financial advice. Use at your own risk.
FBB Buy/Sell Pro is a volatility based reversal tool that builds a dynamic channel around a volume weighted moving average and highlights potential turning points at the extremes. The indicator paints a smooth "funnel" of bands around price and generates Buy/Sell labels when candles reject the outer zones, helping you spot exhaustion and mean reversion opportunities in trending or ranging markets.
Signals are based on price interaction with the outer bands combined with candle direction, optionally filtered by RSI to reduce noise. When enabled, the built in TP/SL module projects an ATR based stop and target using a configurable risk to reward ratio and clearly draws entry, risk and reward zones directly on the chart.
For tracking performance, FBB Pro includes an on chart statistics table that simulates trades using your own base capital, leverage and fee settings. It displays net profit, number of trades and win rate so you can quickly evaluate how the logic behaves on different symbols and timeframes.
Key features
Dynamic FBB volatility channel around VWMA with smooth gradient visualization
Clear reversal Buy/Sell labels at outer band reactions with optional RSI filter
Automatic TP/SL projection based on ATR and custom risk to reward
Realistic stats module with leverage and fee simulation shown in a compact table
Works on most markets and timeframes. It is recommended to combine FBB Buy/Sell Pro with your own higher timeframe context and risk management.

Sal EMA Cloud Trend Labels + Buy/Sell Signals (Real-Time Only)Sal EMA Cloud Trend Labels + Buy/Sell Signals — Real-Time Trend Precision
Unlock cleaner trend detection and faster trade decision-making with the Sal EMA Cloud — a lightweight yet powerful EMA-based trending system designed for intraday and swing traders.
This indicator combines the reliability of the EMA trend model with an intuitive visual experience:
✅ Real-Time Buy/Sell Signals
Instant label-based alerts appear the moment the EMAs cross — giving you clear momentum-shift entries and exits.
✅ Dynamic EMA Cloud
A color-shifting cloud forms between the EMAs, turning green in bullish conditions and red during bearish phases, making trend direction obvious at a glance.
✅ Trend Status Table
A compact, auto-updating table displays the current trend ("Bullish," "Bearish," or "Neutral") in the corner of your chart for quick confirmation.
✅ Clean, Minimal Overlay
No clutter. Just EMAs, a cloud, and actionable signals that work seamlessly across any timeframe.
If you want a straightforward, real-time trend tool that helps you stay on the right side of momentum — this indicator delivers exactly that.

Delta Zones Buy/Sell Pressure UT Plus Delta Zones Buy/Sell Pressure: All-in-One Smart Trading Indicator
💡 Summary: This Indicator is designed as a powerful All-in-One analysis tool, consolidating 4 crucial trading strategies: Delta Zones (Extreme Pressure), Orderblocks & Breaker Blocks (Market Structure), Multi-Indicator Signals (RSI/CCI/Stoch), and UT Bot Alerts (Trend Signals). It provides a comprehensive trading setup on a single chart.
🔎 Key Features:
Delta Zones (Extreme Buy/Sell Pressure): Utilizes Standard Deviation to spot candles with abnormal Buy/Sell Pressure, often indicating institutional activity or stop hunts.
Orderblocks & Breaker Blocks: Automatically analyzes Market Structure Shifts (MSS) to draw Orderblocks and convert them into Breaker Blocks, serving as key support/resistance zones.
Multi-Indicator Signals (RSI/CCI/Stoch): Provides confirmed Buy/Sell signals when RSI, CCI, and Stochastic are in Oversold/Overbought conditions and show reversal action (Users can select the combination).
UT Bot Alerts: Includes a ATR-based Trailing Stop system and secondary Buy/Sell signals for trend confirmation.
🚀 How to Use:
Use the "BUY/SELL" signals from the Multi-Indicator section as the primary trigger.
Use the Delta Zones or Orderblocks/Breaker Blocks as high-confidence confirmation zones for entry/exit, and as precise Stop Loss placement areas.
⚠️ Note on Performance: This Indicator uses complex logic (especially Array and Box drawing functions) and may be resource-intensive on lower timeframes.

Heiken Ashi Buy/Sell Signals for EUR/USD European SessionUSING Heiken Ashi DURING SESSIONS EUR & USD Buy/Sell Signals for EUR/USD DURING European Session

Order Blocks with Buy/Sell Signals (3M Capital) The optimal timeframes for trading with the "Order Blocks with Signals" indicator (a Pine Script tool that identifies swing-based pivot points, projects order block zones using percentile calculations from historical price and bar deltas, and generates buy/sell signals at new pivots) depend on factors like the asset class (e.g., forex, crypto, stocks), market volatility, and the trader's style (scalping, day trading, or swing trading). The indicator's core logic relies on a swing length of 20 periods to detect highs/lows, which covers varying real-world time spans depending on the chart timeframe—e.g., ~1.7 hours on a 5-minute chart, ~20 hours on a 1-hour chart, or ~20 days on a daily chart. This makes it versatile, but it performs best where swings are meaningful and noise is manageable.Based on analysis of similar order block indicators and strategies on TradingView, here's a breakdown of recommended timeframes:1. Short-Term Trading (Scalping or Quick Intraday Trades)
Recommended Timeframes: 5-minute (M5) to 30-minute (M30) charts.
Why It Works Well: These capture short-term momentum shifts and frequent signals from minor swings. The zone projections (based on the 75th percentile of past deltas by default) can forecast quick price extensions, allowing for rapid entries on buy/sell labels (e.g., enter long on a "Buy" signal at a bullish pivot, targeting the zone's projected end). Use tight stops above/below the pivot and aim for 1:1 to 1:2 risk-reward. Backtesting on M30 has shown good accuracy for order block detection in pairs like EUR/USD.
Tips for This Indicator: If signals feel noisy, increase the swing length (e.g., to 30-50) to filter smaller swings, or enable "No Overlapping Zones" to avoid clutter. Avoid very low TFs like 1-minute if volatility is high, as percentile-based zones may overproject.
2. Medium-Term Trading (Day Trading or Short Swing Trades)Recommended Timeframes: 1-hour (H1) to 4-hour (H4) charts.
Why It Works Well: These strike a balance between reliability and frequency. Order blocks on H1/H4 tend to represent institutional interest (e.g., areas of limit order accumulation), making signals more predictive. The indicator's forward-projecting zones can anticipate moves over several hours to a day, ideal for holding trades through sessions. Examples from gold (XAU/USD) and forex pairs show strong performance here, with H4 often used to spot liquidity zones tied to order blocks.
3. Long-Term Trading (Swing or Position Trades)Recommended Timeframes: Daily (D1) or higher (e.g., weekly).
Why It Works Well: Higher TFs reduce false signals from noise, and the zones project significant moves (e.g., weeks to months). This aligns with the indicator's percentile approach, which draws from up to 1,000 past reversals for robust stats. Signals are rarer but higher-probability, suitable for trend-following.
Tips for This Indicator: Enable "Show Only Last Zone" for cleaner charts. Normalization (if enabled) helps with percentage-based assets like crypto.
General Strategy Tips Across TimeframesMulti-Timeframe Approach (Highly Recommended): Identify key order blocks on a higher timeframe (e.g., H4 or D1 for structure) and switch to a lower timeframe (e.g., M15 or H1) for precise entries on signals. This filters noise and aligns with smart money concepts—refine broad zones by checking for breaks of structure or fair value gaps on the lower TF. The indicator isn't inherently multi-timeframe (MTF), but it can be applied manually across charts or modified to incorporate MTF data if needed.
Asset Considerations: For volatile markets like crypto (e.g., BTC/USDT), favor M5-H1 to catch quick reversals. For forex/commodities, H1-H4 excels due to session-based liquidity.
Customization and Testing: Adjust the zone percentile (default 75) lower for tighter zones on short TFs or higher for expansive ones on long TFs. Always backtest on historical data for the specific asset—e.g., the indicator's signals have shown effectiveness on M15-M30 for intraday setups.
Risk Management: Trade in the direction of the overall trend; use the projected zone end as a take-profit target, and place stops beyond the pivot price.
This guidance is drawn from established order block trading practices, where higher TFs provide consistency while lower ones offer timing.
GTI Buy/SellGTI Buy/Sell – Precision Reversal & Trend Confirmation Tool
The GTI Buy/Sell is an indicator designed to identify potential trend reversals and confirm ongoing trends with precision.
What It Does
This indicator generates Buy and Sell signals based on dynamic positioning relative to price action. A Buy signal is printed when the GTI line closes below the candle’s close, indicating a potential transition from a bearish to bullish phase. A Sell signal occurs when the GTI line appears above the candle’s close, suggesting a possible bearish reversal.
The GTI Buy/Sell doesn’t repaint and provides clear, actionable signals based on live market conditions.
How It Works
GTI Buy/Sell combines Average True Range (ATR) for volatility filtering, Smoothed Moving Averages (RMA), Simple Moving Average (SMA), and Exponential Moving Average (EMA) to generate a responsive trend-following structure.
Rather than using static crossovers, the script evaluates price interaction with multiple weighted moving averages and ATR thresholds to identify exhaustion points and turning moments. These calculated confluences enhance signal quality and reduce false positives.
Strategy & Usage Tips
Combine with a 38-period SMA: When the GTI prints a Buy signal and price is above the 38 SMA, it reinforces bullish continuation or reversal. Similarly, a Sell signal with price under the 38 SMA supports a bearish outlook.
Use with VWAP for Validation: In high-liquidity assets such as indices, pairing GTI with VWAP helps identify institutional support/resistance zones to validate the signal strength.
Confluence with GTI Trend: For best results, use this indicator alongside our GTI Trend, which analyzes broader trend context across timeframes. This combination allows traders to align micro signals with macro market direction.
Recommended Assets
GTI Buy/Sell performs best on assets with significant intraday volatility such as:
NASDAQ
US30 / Dow Jones
S&P 500
Gold (XAUUSD)
Brazilian Mini Index (WIN)
However, it can be applied to any instrument where meaningful trend behavior and price movement are present.

Composite Buy/Sell Score [-100 to +100] by LMComposite Buy/Sell Score (Stabilized + Sensitivity) by LM
Description:
This indicator calculates a composite trend strength score ranging from -100 to +100 by combining multiple popular technical indicators into a single, smoothed metric. It is designed to give traders a clear view of bullish and bearish trends, while filtering out short-term noise.
The score incorporates signals from:
PPO (Percentage Price Oscillator) – measures momentum via the difference between fast and slow EMAs.
ADX (Average Directional Index) – detects trend strength.
RSI (Relative Strength Index) – identifies short-term momentum swings.
Stochastic RSI – measures RSI momentum and speed of change.
MACD (Moving Average Convergence Divergence) – detects momentum shifts using EMA crossovers.
Williams %R – highlights overbought/oversold conditions.
Each component is weighted, smoothed, and optionally confirmed across a configurable number of bars, producing a stabilized composite score that reacts more reliably to significant trend changes.
Key Features:
Smoothed Composite Score
The final score is smoothed using an EMA to reduce volatility and emphasize meaningful trends.
A Sensitivity Multiplier allows traders to exaggerate the score for stronger trend signals or dampen it for quieter markets.
Customizable Inputs
You can adjust each indicator’s parameters, smoothing lengths, and confirm bars to suit your preferred timeframe and trading style.
The sensitivity multiplier allows fine-tuning the responsiveness of the trend line without changing underlying indicator calculations.
Visual Representation
Score Line: Green for positive (bullish) trends, red for negative (bearish) trends, gray near neutral.
Reference Lines:
0 = neutral
+100 = maximum bullish
-100 = maximum bearish
Adaptive Background: Optionally highlights the background intensity proportional to trend strength. Strong green for bullish trends, strong red for bearish trends.
Multi-Indicator Integration
Combines momentum, trend, and overbought/oversold signals into a single metric.
Helps identify clear entry/exit trends while avoiding whipsaw noise common in individual indicators.
Recommended Use:
Trend Identification: Look for sustained movement above 0 for bullish trends and below 0 for bearish trends.
Exaggerated Trends: Use the Sensitivity Multiplier to emphasize strong trends.
Filtering Noise: The smoothed score and confirmBars settings help reduce false signals from minor price fluctuations.
Inputs Overview:
Input Purpose
PPO Fast EMA / Slow EMA / Signal Controls PPO momentum sensitivity
ADX Length / Threshold Detects trend strength
RSI Length / Overbought / Oversold Measures short-term momentum
Stoch RSI Length / %K / %D Measures speed of RSI changes
MACD Fast / Slow / Signal Measures momentum crossover
Williams %R Length Detects overbought/oversold conditions
Final Score Smoothing Length EMA smoothing for final composite score
Confirm Bars for Each Signal Number of bars used to confirm individual indicator signals
Sensitivity Multiplier Scales the final composite score for exaggerated trend response
Highlight Background by Trend Strength Enables adaptive background coloring
This indicator is suitable for traders looking for a single, clear trend metric derived from multiple indicators. It can be applied to any timeframe and can help identify both strong and emerging trends in the market.

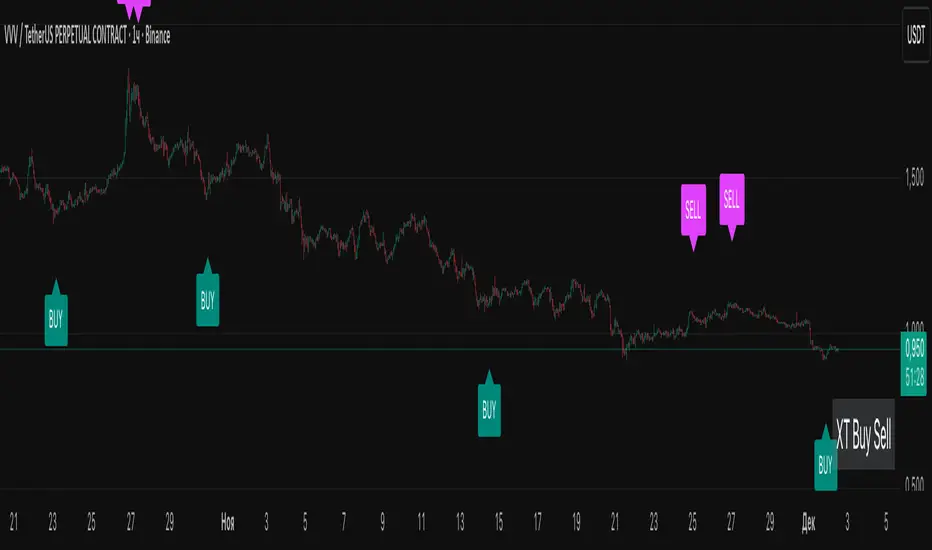
XT Buy Sell v1.0 Lite: Non-Repainting Signal Indicator🚀 XT Buy Sell v1.0 Lite: Non-Repainting Signal Indicator
The XT Buy Sell v1.0 Lite indicator is a streamlined version of our flagship tool, designed for traders who need a reliable, ready-to-use source of signals for market entry and exit.
✨ Key Advantages
Non-Repainting Signals: BUY/SELL signals remain permanently on the chart, providing reliability and easy verification on historical data.
High Accuracy: Developed as one of the most accurate tools for identifying entry points.
Ready "Out of the Box": The indicator comes with optimal default settings. All additional and advanced settings are available in the PRO version.
Versatility: Suitable for both Spot and Futures/Leveraged trading.
🔔 Convenience Features
Alerts: Set up alerts for BUY/SELL signals so you don't have to constantly monitor the chart.
Optimization: Configure alerts on the specific coins (tickers) where the indicator shows the best setups (most accurate and profitable).
🧠 Recommendations for Professional Trading (Risk Management)
To achieve maximum results and safety, follow these guidelines:
Historical Backtesting: Always verify the indicator's performance on the history of the selected trading pair before deployment.
Multi-Timeframe Analysis: Utilize the principle of "Signal on Lower TF, Confirmation on Higher TF" to increase your trading confidence.
Entry Confirmation: For maximum entry precision, it is recommended to use it in conjunction with our additional tool "X Trend Dashboard (Lite)".
Sequential Signals: The consecutive appearance of signals in the same direction (e.g., two or more consecutive BUYS) can be interpreted as a signal for re-entry/averaging down the position.
Risk Management:
Always set Stop-Losses.
Move the trade to Break-Even as soon as possible.
Carefully consider the risks and the leverage being used.
Happy trading and profits to all! 📈💰
#1 Vishal Toora Buy Sell Tablecopyright Vishal Toora
**“© 2025 Vishal Toora — counting volumes so you don’t have to. Buy, sell, or just stare at the screen.”**
Or a few more playful options:
1. **“© Vishal Toora — making deltas speak louder than your ex.”**
2. **“© Vishal Toora — one signal to rule them all (Buy/Sell/Neutral).”**
3. **“© Vishal Toora — because guessing markets is so 2024.”**
Disclaimer: This indicator is for educational and informational purposes only. I do not claim 100% accuracy, and you are responsible for your own trading decisions.

Support/Resistance Band (Single-TF + Buy/Sell)A lightweight trend/momentum overlay that uses:
EMA 34 (fast) and SMA 21 (slow) to form a dynamic band = short-term support/resistance.
EMA 200 as the higher-timeframe trend line (context filter).
Optional BUY/SELL signals on fast/slow cross, plus alerts.
