FX OSINT - Institutional Midnight Intelligence For ForexFX OSINT — Institutional Midnight Intelligence For Forex
See Your FX Charts Like an Intelligence Briefing, Not a Guess
If you’ve ever stared at EURUSD or GBPJPY and thought:
Where is the real liquidity?
Is this move sponsored by smart money or just noise?
Am I buying into premium or discount?
…then FX OSINT is designed for you.
FX OSINT (Forex Open Source Intelligence) treats the FX market the way an analyst treats an investigation:
Collect open‑source signals from price, time, and volatility.
Map out liquidity, structure, and sessions in a repeatable way.
Present them in a clean, non‑cluttered dashboard so you can read context quickly.
No rainbow spaghetti. No 12 indicators stacked on top of each other. Just structured information, midnight visuals, and a clear read on what the market is doing right now.
Why FX OSINT Exists
Many FX traders run into the same problems:
Overloaded charts – multiple indicators fighting for space, none talking to each other.
Signals with no context – arrows that ignore structure, sessions, and liquidity.
Tools not tuned for FX – generic indicators that don’t care what pair you are on.
FX OSINT brings this together into one FX‑focused framework that:
Understands structure : BOS/CHOCH, swings, and trend across multiple timeframes.
Respects liquidity : sweeps, order blocks, and FVGs with controlled visibility.
Reads volatility & ADR : how far today’s range has developed.
Knows the clock : London, New York, and key killzones.
Scores confluence : a 0–100 engine that summarizes how much is lining up.
FX OSINT is built for traders who want structured, institutional‑style logic with a disciplined, midnight‑themed UI —not flashing buy/sell buttons.
1. Midnight Dashboard — Top‑Right Intelligence Panel
This panel acts as your compact “situation room”:
CONFLUENCE — 0–100 score blending trend alignment, volatility regime, sessions, liquidity events, order blocks, FVGs, and ADR context.
REGIME — Low / Building / Normal / Expansion / Extreme, driven by ATR relationships, so you know if you’re in chop, trend, or expansion.
HTF / MTF / LTF TREND — Higher‑, medium‑, and current‑timeframe bias in one place, so you see if you are trading with or against the larger flow.
ADR USED — How much of today’s typical range has already been consumed in percentage terms.
PIP VALUE — Approximate pip size per pair, including JPY‑style pairs.
Everything is bold, legible, and color‑coded, but the layout stays minimal so you can:
Look once → understand the context.
2. Structure, BOS, CHOCH — Smart‑Money‑Style Skeleton
FX OSINT tracks swing highs and lows, then shows how structure evolves:
Trend logic based on evolving swings, not just a moving average cross.
BOS (Break of Structure) when price expands in the direction of trend.
CHOCH (Change of Character) when behavior flips and the market structure changes.
Labels are selective, not spammy . You don’t get a tag on every minor wiggle—only when structure meaningfully shifts, so it’s easier to answer:
"Are we continuing the current leg, or did something actually change here?"
3. Liquidity Sweeps, Order Blocks & FVGs — The OSINT Layer
FX OSINT treats liquidity as a key information layer:
Liquidity sweeps — Detects when price spikes through recent highs/lows and then snaps back, flagging potential stop runs.
Order blocks — The last opposite candle before a displacement move, drawn as controlled boxes with limited lifespan to avoid clutter.
Fair Value Gaps (FVGs) — Three‑candle imbalances rendered as precise zones with a cap on how many can exist at once.
Under the hood, boxes are managed so your chart does not become a wall of old zones:
// Draw Order Blocks with overlap prevention
if isBullishOB and showOrderBlocks
if array.size(obBoxes) >= maxBoxes
oldBox = array.shift(obBoxes)
box.delete(oldBox)
newBox = box.new(bar_index , low , bar_index + obvLength, high ,
border_color = bullColor, bgcolor = bullColorTransp,
border_width = 2, extend = extend.none)
array.push(obBoxes, newBox)
Box limits keep the number of zones under control.
Borders and transparency are tuned so you still see price clearly.
You end up with a curated liquidity map , rather than a chart buried under every level price has ever touched.
4. Volatility, ADR & Sessions — Time and Range Intelligence
FX OSINT runs a Volatility Regime Analyzer and an ADR engine in the background:
Volatility regime — Five states (Low → Extreme) derived from fast vs. slow ATR.
ADR bands — Daily high/mid/low projected from the current daily open.
ADR used % — How far today’s move has traveled relative to its typical range.
On the time side:
Asia, London, New York sessions are softly highlighted with a single active background to avoid overlapping colors.
Killzones (e.g., London and New York opens) can be emphasized when you want to focus on where significant moves often begin.
Together, this helps you answer:
"What time is it in the trading day?"
"How stretched are we?"
"Is expansion just starting, or are we late to the move?"
5. ICT‑Style Add‑Ons — BOS/CHOCH, Premium/Discount, and Confluence
For modern FX / ICT‑inspired workflows, FX OSINT includes:
BOS / CHOCH labels — Clear structural shifts based on swings.
Premium / Discount zones — 25%, 50%, 75% levels of the daily range, so you know if you are buying discount in an uptrend or selling premium in a downtrend.
Confluence score — A single number summarizing how many conditions line up in the current context.
Instead of replacing your plan, FX OSINT compresses your checklist into the chart:
Structure
Liquidity
Session / Time
Volatility / ADR
Higher‑timeframe alignment
When these agree, the dashboard reflects it. When they don’t, it stays neutral and lets you see the conflict.
How To Use FX OSINT
FX OSINT is not a signal bot. It is an information engine that organizes context so you can apply your own plan.
A typical workflow might look like:
Start on higher timeframes (e.g., H4/D1) to form directional bias from structure, volatility regime, and ADR context.
Move to intraday timeframes (e.g., M15/H1) around your chosen sessions (London and/or New York).
Look for confluence :
HTF / MTF / LTF trends aligned.
Price in discount for longs or premium for shorts.
Recent liquidity sweep into a meaningful OB or FVG.
Confluence score at or above a level you consider significant.
Then refine entries using BOS/CHOCH on lower timeframes according to your own risk and execution rules.
FX OSINT aims to make sure you do not enter a trade without seeing:
Where you are in the day (ADR and sessions).
Where you are in the volatility cycle (regime).
Who currently appears in control (structure and trend).
Which liquidity was just targeted (sweeps and zones).
Design Choices and Scope
FX OSINT was designed around a few clear constraints:
FX‑focused — Logic and filters tuned for FX majors, minors, exotics, and metals. It is intended for FX markets, not for every possible asset class.
Open‑source — The full Pine Script code is available so you can read it, learn from it, and adapt it to your own workflow if needed.
Clear themes — Two main visual styles (e.g., dark institutional “midnight” and a lighter accent variant) with a focus on readability, not visual noise.
Chart‑friendly — Panels use fixed areas, session highlights avoid overlapping, and boxes are capped/pruned so the chart remains usable.
FX OSINT is for only Forex pairs, not anything else!
Hope you enjoyed and remember your Open Source Intelligence Matters 😉!
-officialjackofalltrades
Buscar en scripts para "BOS"

Kyle凯尔ATR精控引擎2.0What this indicator does
Blends Heikin Ashi smoothing with a Supertrend-style engine and an EMA filter to generate directional flips (Buy/Sell).
Auto-draws Supply/Demand zones with POI (point of interest) and marks BOS (Break of Structure).
Prints ATR-based Entry, Stop Loss, and TP1/TP2/TP3 levels; includes alerts.
Shows two dashboards: trend & momentum panel (top-right) and liquidity snapshot (bottom-right).
Adds auto trendlines and multi-timeframe horizontal S/R for context.
Quick start
Add the indicator to any symbol/timeframe.
Act on a fresh flip:
Long when direction flips Up and price is above EMA.
Short when direction flips Down and price is below EMA.
Look for confluence: reaction at Demand/Supply, BOS, trendline break, horizontal S/R, ADX > 20, supportive RSI and volume.
Manage risk with the ATR targets. Scale at TP1/TP2, let TP3 run (targets can “roll” after TP3 to rid trends).
Set alerts once per bar close for reliability.
How signals are formed
Heikin Ashi reduces noise by averaging price; ATR bands around HA price form two rails.
Direction flips when HA price crosses the opposite rail; EMA filter blocks counter-trend flips.
Buy/Sell signals are only valid on the bar close.
Supply/Demand, POI & BOS
Swing pivots create Supply (red) above and Demand (green) below; each zone shows a POI mdline.
When price breaks a zone boundary, the script stamps BOS at the midline and retires the old zone.
ATR risk targets
On a fresh signal, the tool snapshots Entry, then computes SL and TP1/2/3 as ATR multiples.
When TP3 hits, the module rolls targets from the new price to help ride sustained trends.
Optional on-chart lines + labels show Entry/SL/TPs.
Dashboards (how to read)
Top-right panel:
Direction (Up/Down/Neutral)
Momentum (close vs close 10 bars ago)
RSI(2) smoothed by 7: oversold/overbought cues + value
Volume bias: OBV minus its EMA (>0 = bullish)
ADX: >20 suggests stronger trend conditions
Multi-TF direction: 1m/5m/15m/1h/4h/D; more agreement = stronger setups
Bottom-right panel (“Liquidity”):
HA bias & intensity %, relative volume vs 20-SMA, and ATR.
Overlays
Trendlines auto-connect short/long window extremes; alerts on breaks.
Multi-TF S/R draws recent pivot highs/lows across selected TFs with de-overlapped labels.
Inputs to tune (common)
ATR Period / Multiplier: higher = smoother, fewer flips.
EMA Period: higher = stricter trend filter.
Supply/Demand: pivot sensitivity (swing_length), zone depth (box_width), number of zones to keep.
Risk/Targets: slMultiplier, tp1/2/3Multiplier (in ATRs), line/label toggles, colors.
Dashboards/Overlays: enable, position, size, S/R TFs, label spacing.
Suggested starting points (XAUUSD, intraday)
ATR(14), ATR Mult 1.3–1.6, EMA 9–21.
Risk: SL = 1.0–1.2 ATR; TPs at 1/2/3 ATR.
S/D: swing_length 8–12, box_width ~2–3.
Adjust per instrument and timeframe.
Example playbooks
Trend continuation: Fresh Buy (Up + above EMA) + pullback into Demand or near the midline; ADX > 20 preferred; scale at TP1/TP2, let TP3 run.
BOS retest: After BOS, trade the first retest into the broken area/POI in alignment with higher-TF direction; confirm with volume bias.
Breakout: Combine trendline break + Buy/Sell flip + S/R breach. Avoid low-liquidity hours.
Alerts included
Buy signal / Sell signal
Trendline break (Up/Down)
TP1/TP2/TP3 reached
Use “Once per bar close”.

Smart Structure Pro - Market Structure & Smart Money Concepts═══════════════════════════════════════════════════════════════════════════════
SMART STRUCTURE PRO
═══════════════════════════════════════════════════════════════════════════════
A comprehensive market structure analysis tool that identifies institutional trading
patterns and smart money concepts for improved trade timing and decision-making.
═══════════════════════════════════════════════════════════════════════════════
📊 WHAT IT DOES
═══════════════════════════════════════════════════════════════════════════════
This indicator automatically detects and visualizes key market structure elements:
🔹 BOS (Break of Structure)
- Identifies trend continuation patterns
- Marks when price breaks above previous highs (bullish) or below previous lows (bearish)
- Confirms trend strength and momentum
🔹 CHoCH (Change of Character)
- Detects potential trend reversals
- Alerts when market structure shifts from bullish to bearish or vice versa
- Helps identify early reversal opportunities
🔹 Order Blocks
- Highlights institutional entry zones
- Identifies the last opposite candle before a structure break
- Shows areas where smart money likely entered positions
🔹 Fair Value Gaps (FVG)
- Detects price imbalances and inefficiencies
- Shows areas where price moved rapidly leaving gaps
- Often act as support/resistance when retested
🔹 Liquidity Zones
- Marks swing high and low levels
- Identifies areas where stop losses likely cluster
- Shows potential stop hunt and liquidity grab zones
═══════════════════════════════════════════════════════════════════════════════
🎯 HOW TO USE
═══════════════════════════════════════════════════════════════════════════════
BULLISH SETUP:
1. Wait for Bullish CHoCH (trend reversal signal) or BOS ↑ (continuation)
2. Look for price to pull back into an Order Block or Fair Value Gap
3. Enter long when price bounces from these zones
4. Place stop loss below the Order Block
5. Target the next liquidity zone or resistance level
BEARISH SETUP:
1. Wait for Bearish CHoCH (trend reversal signal) or BOS ↓ (continuation)
2. Look for price to retrace into an Order Block or Fair Value Gap
3. Enter short when price rejects from these zones
4. Place stop loss above the Order Block
5. Target the next liquidity zone or support level
DASHBOARD INTERPRETATION:
• Trend: Current market direction (Bullish/Bearish)
• Volume: Confirmation strength (High volume = stronger signals)
• Signal: Latest structure break detected
• Key High/Low: Critical levels for the current trend
• Position: Price location (Premium = expensive, Discount = cheap)
═══════════════════════════════════════════════════════════════════════════════
⚙️ SETTINGS GUIDE
═══════════════════════════════════════════════════════════════════════════════
STRUCTURE DETECTION:
• Pivot Length (Default: 10)
- Lower values = More signals but potentially weaker
- Higher values = Fewer signals but stronger/more reliable
- Recommended: 8-12 for intraday, 10-15 for higher timeframes
• Structure Line Extension
- Visual preference for how far lines extend
- Does not affect signal detection
SMART MONEY CONCEPTS:
• Order Block Extension: How long OB boxes remain visible
• FVG Extension: How long gap boxes remain visible
• Min FVG Size: Filter out small gaps (0 = show all)
- Set to 10-20% to reduce noise
- Set to 0 to see all gaps
VOLUME FILTER:
• Volume Confirmation (Recommended: ON)
- Filters weak signals without volume support
- Reduces false breakouts
• Volume Multiplier (Default: 1.5)
- Higher = Stricter filtering (fewer but stronger signals)
- Lower = More signals (but may include weak ones)
DISPLAY:
• Dashboard: Toggle information panel
• Trend Background: Subtle color tint showing current trend
• Dashboard Position: Choose corner placement
═══════════════════════════════════════════════════════════════════════════════
🔔 ALERTS
═══════════════════════════════════════════════════════════════════════════════
Available alert conditions:
✓ Bullish BOS - Uptrend continuation confirmed
✓ Bearish BOS - Downtrend continuation confirmed
✓ Bullish CHoCH - Reversal to uptrend detected
✓ Bearish CHoCH - Reversal to downtrend detected
✓ Structure Break - Any significant market structure change
To set up alerts:
1. Click the "⏰" alert icon
2. Select "Smart Structure Pro"
3. Choose your desired condition
4. Configure notification method
5. Click "Create"
═══════════════════════════════════════════════════════════════════════════════
⚠️ IMPORTANT DISCLOSURES
═══════════════════════════════════════════════════════════════════════════════
REPAINTING BEHAVIOR:
• Pivot points WILL repaint until confirmed (this is by design and unavoidable)
• Structure breaks (BOS/CHoCH) use CLOSED candles and do NOT repaint after confirmation
• Order Blocks and FVGs are drawn on confirmed signals and do NOT repaint
• All signals wait for candle close before triggering
BEST PRACTICES:
• Use on higher timeframes (15min+) for more reliable signals
• Combine with other analysis (support/resistance, volume profile, etc.)
• Wait for candle close confirmation before acting on signals
• Use proper risk management - this is not a standalone trading system
• Backtest on your preferred instrument and timeframe
PERFORMANCE:
• Limited to 100 boxes, 100 lines, 100 labels for optimal performance
• Older objects automatically removed as new ones appear
• Works on all markets (Forex, Crypto, Stocks, Indices, Commodities)
═══════════════════════════════════════════════════════════════════════════════
📚 CONCEPTS EXPLAINED
═══════════════════════════════════════════════════════════════════════════════
MARKET STRUCTURE:
Market structure refers to the pattern of price movements creating swing highs
and lows. Understanding structure helps identify trend direction and potential
reversal points.
SMART MONEY CONCEPTS:
These are trading techniques based on tracking institutional order flow and
understanding where large players (banks, funds, institutions) enter and exit
positions.
ORDER BLOCKS:
The last opposing candle before a strong directional move. Institutions often
leave unfilled orders in these zones, which can act as support/resistance when
price returns.
FAIR VALUE GAPS:
Areas where price moved so quickly that it left an imbalance. These gaps often
get "filled" as price returns to find equilibrium, creating trading opportunities.
═══════════════════════════════════════════════════════════════════════════════
🎓 EDUCATIONAL VALUE
═══════════════════════════════════════════════════════════════════════════════
This indicator helps traders:
✓ Understand market structure mechanics
✓ Identify institutional trading patterns
✓ Improve trade timing and entry precision
✓ Recognize trend continuation vs reversal
✓ Learn smart money concepts through visualization
═══════════════════════════════════════════════════════════════════════════════
📋 TECHNICAL DETAILS
═══════════════════════════════════════════════════════════════════════════════
• Version: 1.0.0
• Pine Script Version: 5
• Indicator Type: Overlay
• No Repainting: Structure breaks use confirmed candles
• Performance Optimized: Limited drawing objects
• Works On: All markets and timeframes
• Alerts: Yes, fully customizable
═══════════════════════════════════════════════════════════════════════════════
👤 AUTHOR
═══════════════════════════════════════════════════════════════════════════════
Created by: Zakaria Safri
Original Work: All code and concepts are original implementations
Based On: ICT (Inner Circle Trader) educational concepts
License: © 2024 Zakaria Safri - Personal Use Only
═══════════════════════════════════════════════════════════════════════════════
⚖️ DISCLAIMER
═══════════════════════════════════════════════════════════════════════════════
This indicator is for educational and informational purposes only. It does not
constitute financial advice. Trading involves substantial risk of loss. Past
performance does not guarantee future results. Always conduct your own research
and consult with a licensed financial advisor before making trading decisions.
The author is not responsible for any losses incurred from using this indicator.
═══════════════════════════════════════════════════════════════════════════════
If you find this indicator helpful, please:
👍 Like and favorite
⭐ Leave a review
📢 Share with other traders
💬 Comment with feedback or suggestions
Happy Trading! 📈

SMC Structures and Multi-Timeframe FVG PYSMC Structures and Multi-Timeframe FVG Indicator
Tip: For optimal performance, adjust the number of FVGs displayed per timeframe in the settings. On high-performance devices, up to 8 FVGs per timeframe can be used without issues. If you experience slowdowns, reduce to 3 or 4 FVGs per timeframe. If the chart flashes, disable indicators one by one to identify conflicts, or try using the TradingView Mobile or Windows App for a smoother experience.
Overview
This Pine Script indicator enhances market analysis by integrating Smart Money Concepts (SMC) with Fair Value Gaps (FVG) across multiple timeframes. It identifies trend continuations (Break of Structure, BOS) and trend reversals (Change of Character, CHoCH) while highlighting liquidity zones through FVG detection. The indicator includes eight customizable Moving Average (MA) curve templates, disabled by default, to complement SMC and FVG analysis. Its originality lies in combining multi-timeframe FVG detection with SMC structure analysis, providing traders with a cohesive tool to visualize price action patterns and liquidity zones efficiently.
Features and Functionality
1. Fair Value Gaps (FVG)
The indicator detects and displays bullish, bearish, and mitigated FVGs, representing liquidity zones where price inefficiencies occur. These gaps are dynamically updated based on price action:
Bullish FVG: Displayed in green when unmitigated, indicating potential upward liquidity zones.
Bearish FVG: Displayed in red when unmitigated, signaling potential downward liquidity zones.
Mitigated FVG: Shown in gray once the gap is partially filled by price action.
Fully Mitigated FVG: Automatically removed from the chart when the gap is fully filled, reducing visual clutter.
Users can customize the number of historical FVGs displayed via the settings, allowing focus on recent liquidity zones for targeted analysis.
2. SMC Structures
The indicator identifies key SMC price action patterns:
Break of Structure (BOS): Marked with gray lines, indicating trend continuation when price breaks a significant high or low.
Change of Character (CHoCH): Highlighted with yellow lines, signaling potential trend reversals when price fails to maintain the current structure.
High/Low Values: Blue lines denote the highest high and lowest low of the current structure, providing reference points for market context.
3. Multi-Timeframe FVG Analysis
A standout feature is the ability to analyze FVGs across multiple timeframes simultaneously. This allows traders to align higher-timeframe liquidity zones with lower-timeframe entries, improving trade precision. The indicator fetches FVG data from user-selected timeframes, displaying them cohesively on the chart.
4. Moving Average (MA) Templates
The indicator includes eight customizable MA curve templates in the Settings > Template section, disabled by default. These templates allow users to overlay MAs (e.g., SMA, EMA, WMA) to complement SMC and FVG analysis. Each template is pre-configured with different periods and types, enabling quick adaptation to various trading strategies, such as trend confirmation or dynamic support/resistance.
How It Works
The script processes price action to detect FVGs by analyzing three-candle patterns where a gap forms between the high/low of the first and third candles. Multi-timeframe data is retrieved using Pine Script’s request.security() function, ensuring accurate FVG plotting across user-defined timeframes. BOS and CHoCH are identified by tracking swing highs and lows, with logic to differentiate trend continuation from reversals. The MA templates are computed using standard Pine Script TA functions, with user inputs controlling visibility and parameters.
How to Use
Add to Chart: Apply the indicator to any TradingView chart.
Configure Settings:
FVG Settings: Adjust the number of historical FVGs to display (default: 10). Enable/disable specific FVG types (bullish, bearish, mitigated).
Timeframe Selection: Choose up to three timeframes for FVG analysis (e.g., 1H, 4H, 1D) to align with your trading strategy.
Structure Settings: Toggle BOS (gray lines) and CHoCH (yellow lines) visibility. Adjust sensitivity for structure detection if needed.
MA Templates: Enable MA curves via the Template section. Select from eight pre-configured MA types and periods to suit your analysis.
Interpret Signals:
Use green/red FVGs for potential entry points targeting liquidity zones.
Monitor gray lines (BOS) for trend continuation and yellow lines (CHoCH) for reversal signals.
Align multi-timeframe FVGs with BOS/CHoCH for high-probability setups.
Optionally, use MA curves for trend confirmation or dynamic levels.
Clean Chart Usage: The indicator is designed to work standalone. Ensure no conflicting scripts are applied unless explicitly needed for your strategy.
Why This Indicator Is Unique
Unlike standalone FVG or SMC indicators, this script combines both concepts with multi-timeframe analysis, offering a comprehensive view of market structure and liquidity. The addition of customizable MA templates enhances flexibility, while the dynamic removal of mitigated FVGs keeps the chart clean. This mashup is purposeful, as it integrates complementary tools to streamline decision-making for traders using SMC strategies.
Credits
This indicator builds on foundational SMC and FVG concepts from the TradingView community. Some open-source code was reused, and do performance enhancement as you guys can read the code. This type of indicators has inspiration was drawn from public domain SMC methodologies. All code is partly original with manual work on performance optimization in Pine Script.
Notes
Ensure your chart is clean (no unnecessary drawings or indicators) to maximize clarity.
The indicator is open-source, and traders are encouraged to review the code for deeper understanding.
For optimal use, test the indicator on a demo account to familiarize yourself with its signals.

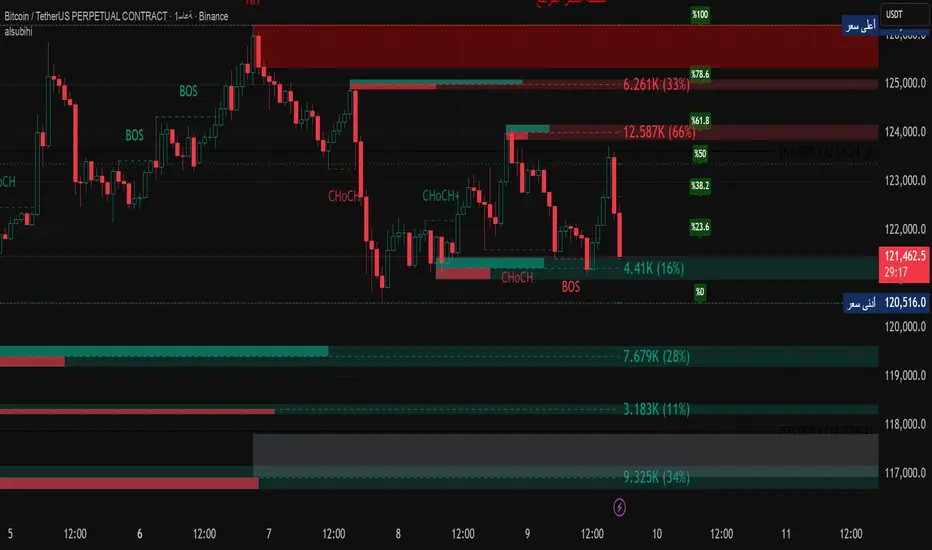
alsubihi.2Advanced Market Structure Indicator
This custom-built indicator provides an in-depth analysis of market structure changes to help traders identify key price levels, trends, and potential reversals. It combines multiple tools to give you a clearer picture of market behavior and improve your decision-making process.
Key Features:
Break of Structure (BOS):
The BOS indicator identifies significant changes in market structure, marking when the price breaks previous highs or lows, signaling a potential trend shift. Green lines represent upward breaks (bullish trend), while red lines show downward breaks (bearish trend).
Change of Character (Choch):
This feature helps to highlight subtle shifts in market dynamics. A change in character (Choch) indicates when the market transitions between bullish or bearish behavior. Green indicates a bullish character change, while red shows a bearish one.
Premium vs Discount Zones:
The indicator identifies price levels that are considered 'Premium' (high price levels) and 'Discount' (low price levels), assisting traders in recognizing overbought or oversold conditions and making better trading decisions based on market conditions.
Support and Resistance Levels:
Automatically drawn support and resistance lines are included to show critical price areas where reversals or breakouts might occur, helping traders anticipate price action.
Equilibrium Zone:
This is the price level where supply and demand balance out, acting as a key reference point for identifying potential market reversals or continuation.
Why Use This Indicator?
This all-in-one tool helps traders make informed decisions by combining multiple technical analysis concepts into a single, easy-to-use indicator. It reduces the complexity of analyzing price action and allows traders to quickly identify potential entry and exit points with greater accuracy.
Whether you are an experienced trader or just starting, this indicator provides you with the essential tools needed to identify trend shifts, key support and resistance zones, and price extremes, leading to more profitable trading decisions.
14 سبتمبر
ملاحظات الأخبار
📌 Summary of the Indicator
Market Structure (MS):
Detects swing & internal BOS, CHoCH, CHoCH+. Can color candles or bars by trend.
Multi-Timeframe Scanner (MTF):
Shows trend direction on multiple TFs (5m → 1W).
Highs/Lows (HTF):
Plots previous Day/Week/Month/Year highs & lows as liquidity levels.
Order Blocks (OB):
Draws volumetric order blocks, with filters (BOS/CHoCH), overlap rules, mitigation, and volume metrics.
Fair Value Gaps (FVG/VI/OG):
Detects price imbalances, extends them, and removes when mitigated.
Accumulation/Distribution Zones:
Highlights Wyckoff-style accumulation (green) or distribution (red).
Equal Highs/Lows (EQH/EQL):
Marks liquidity pools at equal highs or lows.
Premium/Discount Bands:
Splits swing range into premium, equilibrium, and discount zones.
RSI & ADX:
Momentum filters for overbought/oversold and trend strength.
DEMA-ATR Baseline:
Adaptive EMA with ATR constraints; alerts for trend shifts.
Regression Channel:
Auto-fits best regression length using Pearson-R, shows channel with std bands.
Fibonacci Ladder:
Auto plots levels 0.236 → 1.618 based on recent swing.
👉 In short: it’s a full SMC toolkit — structure + liquidity + OB/FVG + momentum filters + extra tools (fib, regression, ATR baseline).
📌 ملخص المؤشر
البنية الهيكلية (Market Structure):
يحدد BOS و CHoCH داخلي وسوينغ، ويقدر يلوّن الشموع حسب الاتجاه.
سكانر متعدد الأطر (MTF):
يعرض الاتجاه على عدة فريمات من 5m إلى 1W.
هاي/لو من أطر عليا (HTF Highs/Lows):
يرسم قمم وقيعان اليوم/الأسبوع/الشهر/السنة السابقة (مناطق سيولة).
بلوكات الطلب/العرض (Order Blocks):
يرسم بلوكات مع فلاتر (BOS/CHoCH)، خيارات تداخل، إزالة عند الكسر، ويعرض حجم التداول بداخلها.
الفجوات السعرية (FVG/VI/OG):
يحدد الفجوات غير المغطاة، يمددها، ويحذفها عند التغطية.
مناطق التجميع/التوزيع:
يوضح مناطق Wyckoff (أخضر للتجميع، أحمر للتوزيع).
قمم وقيعان متساوية (EQH/EQL):
يميز مناطق السيولة فوق القمم أو تحت القيعان المتساوية.
مناطق Premium/Discount/Equilibrium:
يقسم آخر نطاق إلى مناطق غالية (Premium)، توازن (Equilibrium)، ورخيصة (Discount).
RSI و ADX:
مؤشرات إضافية لقياس التشبع وقوة الاتجاه.
خط DEMA-ATR:
EMA متكيف مع قيود ATR، يتغير لونه حسب الاتجاه، مع تنبيهات جاهزة.
قناة الانحدار (Regression):
تختار أفضل طول باستخدام معامل الارتباط Pearson-R، وترسم قناة مع انحراف معياري.
فيبوناتشي (Fibonacci):
يرسم مستويات 0.236 حتى 1.618 حسب آخر حركة سعرية.
👉 باختصار: المؤشر هو أداة SMC متكاملة تجمع الهيكل، السيولة، البلوكات، الفجوات، والمؤشرات المساعدة.
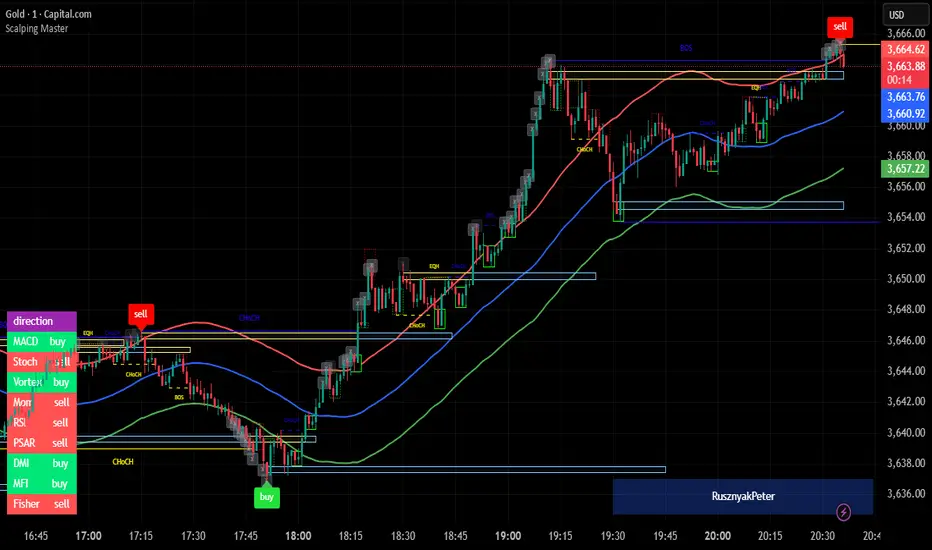
Scalping MasterMarket Structure Analysis:
Swing Structure: Detects higher highs (HH), lower highs (LH), higher lows (HL), aur lower lows (LL) ko identify karta hai using pivot points (based on ta.highest aur ta.lowest).
Internal Structure: Chhote timeframes ke liye internal swing points aur break of structure (BOS)/change of character (CHoCH) ko track karta hai.
BOS/CHoCH Detection: Bullish aur bearish structure breaks (BOS) aur trend reversals (CHoCH) ko label karta hai.
Order Blocks (OB):
Internal Order Blocks: Chhote timeframe ke order blocks ko plot karta hai, jo liquidity zones ko represent karte hain.
Swing Order Blocks: Bade timeframe ke order blocks ko show karta hai.
Filtering: ATR ya Cumulative Mean Range ke basis par volatile order blocks ko filter karta hai.
Fair Value Gaps (FVG):
Price gaps (bullish aur bearish) ko detect aur plot karta hai.
Auto-threshold aur timeframe customization ke saath FVGs ko filter karta hai.
FVGs ko extend karne ka option deta hai (visual representation ke liye).
Equal Highs/Lows (EQH/EQL):
Equal highs aur lows ko identify karta hai, jo support/resistance zones ke liye useful hote hain.
Bars confirmation aur sensitivity threshold ke saath customizable hai.
Previous Highs/Lows (MTF):
Daily, weekly, aur monthly high/low levels ko plot karta hai.
Line style (solid, dashed, dotted) aur colors customizable hain.
Premium/Discount Zones:
Market ke premium, equilibrium, aur discount zones ko highlight karta hai, jo price action ke liye key areas hote hain.
Visual Customization:
Color Themes: Colored ya monochrome themes ke options.
Candle Coloring: Trend ke hisaab se candles ko color karta hai.
Labels aur Lines: Swing points, strong/weak highs/lows, aur structure breaks ke liye labels aur lines plot karta hai.
Modes:
Historical Mode: Past data ke saath complete structure dikhata hai.
Present Mode: Sirf recent structure aur signals dikhata hai, clutter reduce karne ke liye.
Alerts:
Bullish/Bearish BOS, CHoCH, order block breaks, aur EQH/EQL ke liye alerts set karne ka option.
Swing Points aur Trailing:
Strong/weak high aur low points ko track karta hai.
Trailing maximum/minimum ko extend karta hai for real-time analysis.
Kya Kya Mila Kar Bana Hai?
Yeh indicator Smart Money Concepts ke core principles par based hai aur in elements ko combine karta hai:
Pivot Point Analysis:
ta.highest aur ta.lowest functions se swing highs/lows detect karta hai.
Internal aur swing structure ke liye alag-alag lengths (e.g., length aur 5 for internal swings).
Price Action Concepts:
Break of Structure (BOS): Jab price pivot high/low ko break karta hai.
Change of Character (CHoCH): Jab trend reverse hota hai.
Confluence filtering ke saath accuracy improve karta hai.
Order Blocks:
Liquidity zones ko identify karne ke liye high/low ranges aur ATR/cumulative mean range ka use.
Bullish aur bearish order blocks ke liye customizable colors.
Fair Value Gaps:
Gaps in price action ko detect karne ke liye OHLC data ka analysis.
Timeframe aur auto-threshold ke saath flexibility.
MTF (Multi-Timeframe) Analysis:
Daily, weekly, monthly high/low levels ke liye ta.valuewhen aur time-based calculations.
Zones Detection:
Premium, equilibrium, aur discount zones ke liye price range calculations.
Visual Tools:
Lines, labels, aur boxes ke saath market structure ko visually represent karta hai (line.new, label.new, box.new).
Extendable lines aur boxes for better visibility.
User Inputs:
Customizable settings jaise timeframe, colors, lengths, aur filters, jo user ko flexibility dete hain.
Technical Components
PineScript Functions: ta.crossover, ta.crossunder, ta.highest, ta.lowest, ta.atr, ta.cum for calculations.
Arrays: Order blocks ke coordinates store karne ke liye (array.new_float, array.new_int, array.new_box).
Drawing Tools: Lines, labels, aur boxes ke saath dynamic plotting.
Conditional Logic: BOS, CHoCH, aur other signals ke liye complex conditions.
Timeframe Support: Multi-timeframe analysis ke liye input.timeframe.
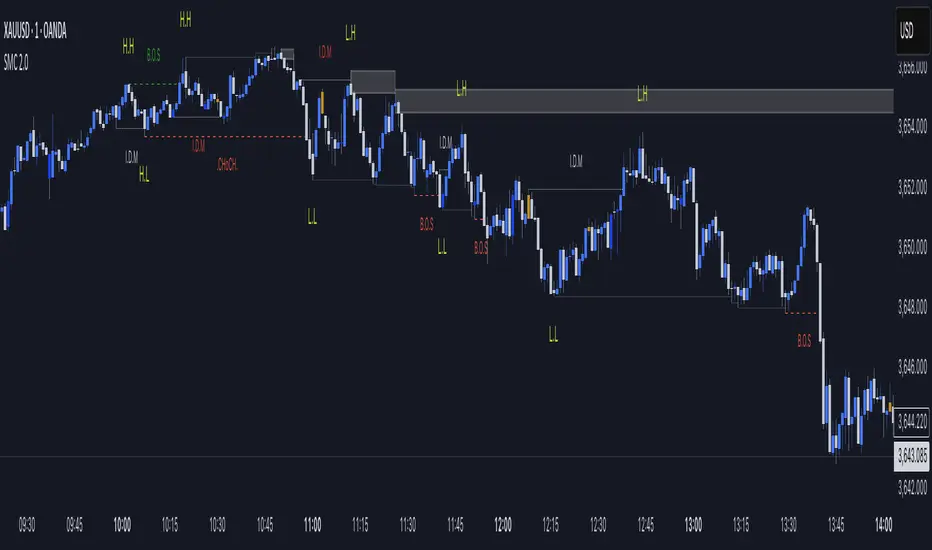
SMC Mapping 2.0“This script is a Smart Money Concepts (SMC) indicator that helps traders identify market structure shifts such as Break of Structure (BOS) and Change of Character (ChoCH). It also highlights Supply & Demand zones, Internal/External Liquidity sweeps, and IDM levels.
The tool is designed for price action traders who want a clean and visual way to track BOS, ChoCH, and liquidity points directly on their chart. It is fully customizable with options to show/hide different elements, change colors, and adjust sensitivity.”
🔹 Script Overview
This script is based on Smart Money Concepts (SMC).
It automatically identifies Break of Structure (BOS), Change of Character (ChoCH), Supply & Demand zones, and IDM zones on the chart.
🔹 Features
Market Structure Detection → plots HH (Higher Highs) and LL (Lower Lows)
BOS & ChoCH → quickly identify trend shifts
Auto Supply & Demand Zones → highlights potential reversal areas
IDM Zones → marks imbalance/inefficiency
Clear color-coded visuals for bullish/bearish context
🔹 How It Works
The script evaluates recent swing highs and lows (20-bar lookback by default)
When price breaks above the recent high → Bullish BOS
When price breaks below the recent low → Bearish BOS
Based on this structure, the script automatically generates labels and zones
🔹 How To Use
Add the script to your chart (works well on 15m, 1H, 4H timeframes)
Use HH/LL labels to read the market structure
Supply & Demand zones help in identifying possible entry/exit points
IDM zones confirm imbalance areas for trade validation
🔹 Note
While this script uses classic concepts (HH, LL, Supply/Demand, IDM), the calculations, visuals, and styling are customized to provide a fresh and unique tool for traders. It is designed to help traders clearly see market structure and plan trades accordingly.
Iani SMC Sniper XAU v2.2 (Long+Short + News Countdown, v6)Iani SMC Sniper XAU (v2.2) — smart-money logic for XAUUSD.
This indicator hunts “sniper entries” using a simple SMC sequence:
Sweep → BOS → 50% FVG entry
• After London session builds its range, we wait for a liquidity sweep (price dips below London Low for longs / wicks above London High for shorts).
• A BOS confirms direction (close breaks the last swing).
• First FVG that prints after BOS gives the entry at 50% (mid-gap).
• SL anchored to the protective swing (with a small safety buffer). TP is plotted using your Risk:Reward.
News countdown (non-blocking):
The script does not auto-fetch news; you set daily times (e.g., 14:30, 16:00) and/or specific dates (“YYYY-MM-DD HH:MM”). A countdown label shows “NEWS in Xm”. Signals are not blocked—this is just a safety heads-up for prop-firm rules.
Inputs: pivot length, RR, pip size (XAU default 0.10), session filter (after London), news times (recurring & absolute), show/hide levels & labels.
Plots & labels: London High/Low (daily), Entry/SL/TP lines, BOS/Sweep/BUY/SELL markers, news badge.
Alerts: BOS Bull/Bear, BUY/SELL Entry touch, TP/SL hit, NEWS WARNING.
Notes:
• Designed for XAUUSD intraday; works on other symbols if you adjust pip size.
• Uses symbol timezone; adjust your news times for DST if needed.
• Indicator only—no orders, no backtest. Manage risk and execution in MT5/your platform.
Changelog (v2.2): Pine v6, robust time parsing, one-line logical expressions (fixed EOL errors), mirrored short logic, cleaner London H/L reset, countdown label.
Disclaimer: Educational tool, not financial advice. Past performance ≠ future results.
Tags: SMC, ICT, XAUUSD, Gold, Liquidity Sweep, BOS, FVG, London Session, News, Intraday, Scalping, DayTrading.

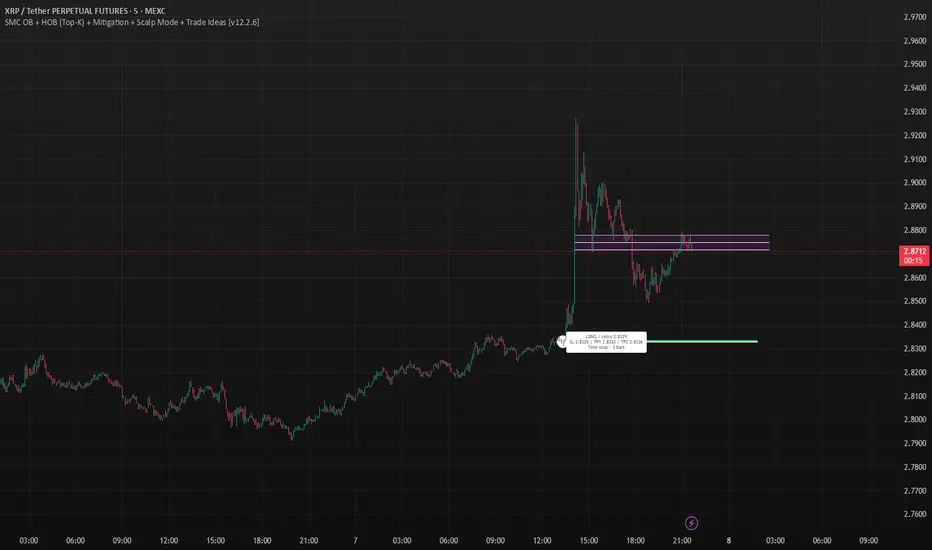
SMC OB+HOBSmart Money OB/HOB Indicator — Quick Guide
Use this as a field manual: what you’re seeing, how it’s decided, and which settings to use for different timeframes and trade styles.
What the tool plots
Bullish Order Block (OB) — teal box
The last small down candle before a bullish displacement/BOS. Height = candle body (default) or wick range (if you choose “Wick”).
Pin (small white dot) at the origin candle’s time to make anchoring obvious.
Bearish Order Block (OB) — red box
The last small up candle before a bearish displacement/BOS.
Hidden Order Block (HOB) — same box but yellow-tinted fill
A valid OB with one or more same-bias FVGs “ahead” (i.e., OB sits “behind” inefficiency). These tend to be stronger.
Mitigation state (fill transparency)
Unmitigated (least transparent): price hasn’t meaningfully traded back into the box. Highest priority.
Partial (more transparent): some penetration; still valid.
Full (most transparent): fully consumed; lower priority (optional to hide).
Top-K border — thin white outline
Only the best-scoring OBs/HOBs per direction are drawn to reduce clutter.
Auto-Fibs (optional)
OTE zone (0.62–0.79) — subtle purple band across the current swing leg.
0.618 / 0.705 / 0.786 — thin white horizontal lines. Confluence here adds score.
Trade idea lines (per Top-K block)
Entry — white line (mid/edge per your setting).
Stop — red line (box edge ± your pad).
TP1/TP2 — lime lines, R-based from entry→stop distance.
Label shows LONG/SHORT, entry, SL, TP1, TP2, time-stop (bars).
Note: Fair Value Gaps (FVGs) are tracked internally to classify HOBs and for pruning, not drawn to avoid noise.
How a block is qualified (in plain English)
BOS + Displacement:
Close breaks the recent swing high/low by at least N ticks and the bar shows impulse (body ≥ X·ATR and ≥ Y% of its total range).
(Settings: “Close beyond ≥ ticks”, “Min impulse body (x ATR)”, “Body/TR min %”)
Seed candle:
Look back ≤ N bars for the last opposite small-body candle (body ≤ Z% of its range). That candle’s body/wick becomes the OB height.
(Settings: “Last opposite candle within N bars”, “OB body ≤ % of TR”, “OB height model”)
Hidden OB:
Count same-bias FVGs “ahead”. If ≥ your threshold → tag the OB as HOB.
(Setting: “Require ≥ N same-bias FVGs ahead”)
Mitigation tracking:
As price trades into the box, we compute penetration %, updating unmitigated / partial / full state each bar.
Ranking (Top-K):
Every OB/HOB gets a score: near price, newer, hidden, near fib, and unmitigated boost. We draw only the Top-K per direction.
Inputs you’ll actually tweak
Timeframe
Compute on: Current (uses your chart TF) or Specific (MTF scan).
Process last N bars: reduce for speed, increase to see more history.
Anchoring
Extend: Right, Limited, or Origin only.
Limited draws boxes to a fixed number of bars so charts stay clean.
Show origin pins: Keep on so you always know the source candle.
Structure / BOS (signal frequency vs. quality)
Require FVG on break bar: ON = stricter, OFF = more signals.
Min impulse body (x ATR): higher = stricter.
Body/TR min %: higher = stricter.
Close beyond ≥ ticks: 0–1 for LTF; 1–3 for HTF.
Order Blocks
OB height model: Body (cleaner) or Wick (wider protection).
Last opposite candle within N bars: 3–8 (higher finds more).
OB body ≤ % of TR: 0.35–0.70 (lower = stricter).
Min OB height (ticks): 1–2 (avoid micro slivers).
Expire on first touch: If ON, removes boxes after first reaction.
Hidden OB
Require ≥ N FVGs ahead: 0–1 for LTF (more HOBs), 1–2 for HTF.
Mitigation Filter (what you show)
Toggle Unmitigated / Partial / Full visibility.
For precision trading, keep Unmitigated on; show others while scanning.
Auto-Fibs
Enable fib confluence: On adds score near 0.618/0.705/0.786.
Draw lines / OTE: Visual only; confluence also boosts ranking.
Tolerance (x ATR): how close price must be to count as “near fib”.
Ranking & Draw
Top-K per direction: how many OBs/HOBs you’ll see each side.
Prefer near / newer / hidden / unmitigated: scoring toggles.
Fib boost: how much fib confluence bumps a level.
Trade Ideas
Entry style: 50% of OB (balanced) or OB edge (faster fills).
Stop pad (ticks/ATR): give a little room beyond the box edge.
TP1/TP2 (R): risk-multiple targets (e.g., 1R, 2R).
Time stop (minutes): exit if it doesn’t go in time.
Execution / Alerts (recommended)
Keep on-close workflow: do not enable calc_on_every_tick.
When creating alerts, choose Once per bar close.
How to use it (mechanical checklist)
Scan: Focus on Top-K boxes. HOBs (yellow-tinted) and unmitigated get first look.
Context (optional): If you like, also check HTF structure or obvious liquidity pools (equal highs/lows).
Confluence: Prefer boxes near 0.618/0.705/0.786 or inside the OTE band.
Trigger: Let the bar close. If entry line is touched next, you have a go-signal with a placed stop and R-targets.
Manage: If TP1 hits, move SL to BE. For HOBs, consider a runner (trail under minor swing/FVG) — they often travel further.
Time stop: If it hasn’t moved within N minutes/bars, cut it; don’t babysit.
Preset recipes (copy these settings)
1) Hyper-Scalp (1–3m) — frequent, fast
Structure / BOS:
FVG on break = OFF | Min impulse = 0.6–0.8 | Body/TR = 0.45–0.55 | Close beyond = 0–1
Order Blocks:
Opposite lookback = 5–6 | OB body ≤ 0.55–0.60 | Min height = 1
HOB: Need FVGs = 0–1
Mitigation view: Show Unmit/Partial, optionally Full while scanning
Ranking: Top-K = 4–6, prefer near/new/hidden/unmit = ON, Fib boost = 0.6–1.0
Trade Ideas: Entry = OB edge, Stop pad = 1–2 ticks, Time stop = 5–8 min
Execution: On bar close alerts
2) Intraday (5–15m) — balanced
Structure / BOS:
FVG on break = OFF | Min impulse = 0.8–1.0 | Body/TR = 0.55–0.60 | Close beyond = 1
Order Blocks:
Opposite lookback = 4–5 | OB body ≤ 0.50–0.55 | Min height = 1–2
HOB: Need FVGs = 1
Ranking: Top-K = 3–4, Fib boost = 1.0–1.5
Trade Ideas: Entry = 50%, Stop pad = 2–3 ticks, Time stop = 10–20 min
3) Swing (1H–4H) — selective, higher quality
Structure / BOS:
FVG on break = ON | Min impulse = ≥1.0 | Body/TR = ≥0.65 | Close beyond = 1–3
Order Blocks:
Opposite lookback = 3–4 | OB body ≤ 0.45–0.50 | Min height = 2–4
HOB: Need FVGs = 1–2
Ranking: Top-K = 2–3, Fib boost = 1.5–2.0
Trade Ideas: Entry = 50%, Stop pad = a few ticks + ATR pad, Time stop = few bars
4) HTF (Daily+) — very selective
Keep swing settings, increase Min impulse and Close beyond a bit, reduce Top-K to 1–2.
Priority rules (what to trade first)
HOB over OB
Unmitigated over partial/full
With fib confluence over without
Near price and recent over far/old
Favor levels that follow a sweep (equal highs/lows taken, then return to your box)
If two boxes tie, take the one with the cleaner origin candle and simpler path to TP (fewer nearby obstacles).
Troubleshooting & tips
“I’m not seeing many signals.”
Loosen Structure/BOS (lower ATR and Body/TR), increase Opposite lookback, allow Partial/Full in view, raise Top-K.
“Too many lines/boxes.”
Lower Top-K, use Limited extension (Anchoring), hide Partial/Full, and keep fib lines if you rely on confluence.
“Stuff looks offset.”
Keep origin pins on. Use xloc.bar_time (already in code) and avoid custom time compressions that desync objects.
Execution discipline:
Use on-close alerts. Respect time stops. Size by fixed risk per trade, not fixed leverage.
Advanced ICT Theory - A-ICT📊 Advanced ICT Theory (A-ICT): The Institutional Manipulation Detector
Are you tired of being the liquidity? Stop chasing shadows and start tracking the architects of price movement.
This is not another lagging indicator. This is a complete framework for viewing the market through the lens of institutional traders. Advanced ICT Theory (A-ICT) is an all-in-one, military-grade analysis engine designed to decode the complex language of "Smart Money." It automates the core tenets of Inner Circle Trader (ICT) methodology, moving beyond simple patterns to build a dynamic, real-time narrative of market manipulation, liquidity engineering, and institutional order flow.
AIT provides a living blueprint of the market, identifying high-probability zones, tracking structural shifts, and scoring the quality of setups with a sophisticated, multi-factor algorithm. This is your X-ray into the market's true intentions.
🔬 THE CORE ENGINE: DECODING THE THEORY & FORMULAS
A-ICT is built upon a sophisticated, multi-layered logic system that interprets price action as a story of cause and effect. It does not guess; it confirms. Here is the foundational theory that drives the engine:
1. Market Structure: The Blueprint of Trend
The script first establishes a deep understanding of the market's skeleton through multi-level pivot analysis. It uses ta.pivothigh and ta.pivotlow to identify significant swing points.
Internal Structure (iBOS): Minor swings that show the short-term order flow. A break of internal structure is the first whisper of a potential shift.
External Structure (eBOS): Major swing points that define the primary trend. A confirmed break of external structure is a powerful statement of trend continuation. AIT validates this with optional Volume Confirmation (volume > volumeSMA * 1.2) and Candle Confirmation to ensure the break is driven by institutional force, not just a random spike.
Change of Character (CHoCH): This is the earthquake. A CHoCH occurs when a confirmed eBOS happens against the prevailing trend (e.g., a bearish eBOS in a clear uptrend). A-ICT flags this immediately, as it is the strongest signal that the primary trend is under threat of reversal.
2. Liquidity Engineering: The Fuel of the Market
Institutions don't buy into strength; they buy into weakness. They need liquidity. A-ICT maps these liquidity pools with forensic precision:
Buyside & Sellside Liquidity (BSL/SSL): Using ta.highest and ta.lowest, AIT identifies recent highs and lows where clusters of stop-loss orders (liquidity) are resting. These are institutional targets.
Liquidity Sweeps: This is the "manipulation" part of the detector. AIT has a specific formula to detect a sweep: high > bsl and close < bsl . This signifies that institutions pushed price just high enough to trigger buy-stops before aggressively selling—a classic "stop hunt." This event dramatically increases the quality score of subsequent patterns.
3. The Element Lifecycle: From Potential to Power
This is the revolutionary heart of A-ICT. Zones are not static; they have a lifecycle. AIT tracks this with its dynamic classification engine.
Phase 1: PENDING (Yellow): The script identifies a potential zone of interest based on a specific candle formation (a "displacement"). It is marked as "Pending" because its true nature is unknown. It is a question.
Phase 2: CLASSIFICATION: After the zone is created, AIT watches what happens next. The zone's identity is defined by its actions:
ORDER BLOCK (Blue): The highest-grade element. A zone is classified as an Order Block if it directly causes a Break of Structure (BOS) . This is the footprint of institutions entering the market with enough force to validate the new trend direction.
TRAP ZONE (Orange): A zone is classified as a Trap Zone if it is directly involved in a Liquidity Sweep . This indicates the zone was used to engineer liquidity, setting a "trap" for retail traders before a reversal.
REVERSAL / S&R ZONE (Green): If a zone is not powerful enough to cause a BOS or a major sweep, but still serves as a pivot point, it's classified as a general support/resistance or reversal zone.
4. Market Inefficiencies: Gaps in the Matrix
Fair Value Gaps (FVG): AIT detects FVGs—a 3-bar pattern indicating an imbalance—with a strict formula: low > high (for a bullish FVG) and gapSize > atr14 * 0.5. This ensures only significant, volatile gaps are shown. An FVG co-located with an Order Block is a high-confluence setup.
5. Premium & Discount: The Law of Value
Institutions buy at wholesale (Discount) and sell at retail (Premium). AIT uses a pdLookback to define the current dealing range and divides it into three zones: Premium (sell zone), Discount (buy zone), and Equilibrium. An element's quality score is massively boosted if it aligns with this principle (e.g., a bullish Order Block in a Discount zone).
⚙️ THE CONTROL PANEL: A COMPLETE GUIDE TO THE INPUTS MENU
Every setting is a lever, allowing you to tune the AIT engine to your exact specifications. Master these to unlock the script's full potential.
🎯 A-ICT Detection Engine
Min Displacement Candles: Controls the sensitivity of element detection. How it works: It defines the number of subsequent candles that must be "inside" a large parent candle. Best practice: Use 2-3 for a balanced view on most timeframes. A higher number (4-5) will find only major, more significant zones, ideal for swing trading. A lower number (1) is highly sensitive, suitable for scalping.
Mitigation Method: Defines when a zone is considered "used up" or mitigated. How it works: Cross triggers as soon as price touches the zone's boundary. Close requires a candle to fully close beyond it. Best practice: Cross is more responsive for fast-moving markets. Close is more conservative and helps filter out fake-outs caused by wicks, making it safer for confirmations.
Min Element Size (ATR): A crucial noise filter. How it works: It requires a detected zone to be at least this multiple of the Average True Range (ATR). Best practice: Keep this around 0.5. If you see too many tiny, irrelevant zones, increase this value to 0.8 or 1.0. If you feel the script is missing smaller but valid zones, decrease it to 0.3.
Age Threshold & Pending Timeout: These manage visual clutter. How they work: Age Threshold removes old, mitigated elements after a set number of bars. Pending Timeout removes a "Pending" element if it isn't classified within a certain window. Best practice: The default settings are optimized. If your chart feels cluttered, reduce the Age Threshold. If pending zones disappear too quickly, increase the Pending Timeout.
Min Quality Threshold: Your primary visual filter. How it works: It hides all elements (boxes, lines, labels) that do not meet this minimum quality score (0-100). Best practice: Start with the default 30. To see only A- or B-grade setups, increase this to 60 or 70 for an exceptionally clean, high-probability view.
🏗️ Market Structure
Lookbacks (Internal, External, Major): These define the sensitivity of the trend analysis. How they work: They set the number of bars to the left and right for pivot detection. Best practice: Use smaller values for Internal (e.g., 3) to see minor structure and larger values for External (e.g., 10-15) to map the main trend. For a macro, long-term view, increase the Major Swing Lookback.
Require Volume/Candle Confirmation: Toggles for quality control on BOS/CHoCH signals. Best practice: It is highly recommended to keep these enabled. Disabling them will result in more structure signals, but many will be false alarms. They are your filter against market noise.
... (Continue this detailed breakdown for every single input group: Display Configuration, Zones Style, Levels Appearance, Colors, Dashboards, MTF, Liquidity, Premium/Discount, Sessions, and IPDA).
📊 THE INTELLIGENCE DASHBOARDS: YOUR COMMAND CENTER
The dashboards synthesize all the complex analysis into a simple, actionable intelligence briefing.
Main Dashboard (Bottom Right)
ICT Metrics & Breakdown: This is your statistical overview. Total Elements shows how much structure the script is tracking. High Quality instantly tells you if there are any A/B grade setups nearby. Unmitigated vs. Mitigated shows the balance of fresh opportunities versus resolved price action. The breakdown by Order Blocks, Trap Zones, etc., gives you a quick read on the market's recent character.
Structure & Market Context: This is your core bias. Order Flow tells you the current script-determined trend. Last BOS shows you the most recent structural event. CHoCH Active is a critical warning. HTF Bias shows if you are aligned with the higher timeframe—the checkmark (✓) for alignment is one of the most important confluence factors.
Smart Money Flow: A volume-based sentiment gauge. Net Flow shows the raw buying vs. selling pressure, while the Bias provides an interpretation (e.g., "STRONG BULLISH FLOW").
Key Guide (Large Dashboard only): A built-in legend so you never have to guess. It defines every pattern, structure type, and special level visually.
📖 Narrative Dashboard (Bottom Left)
This is the "story" of the market, updated in real-time. It's designed to build your trading thesis.
Recent Elements Table: A live list of the most recent, high-quality setups. It displays the Type , its Narrative Role (e.g., "Bullish OB caused BOS"), its raw Quality percentage, and its final Trade Score grade. This is your at-a-glance opportunity scanner.
Market Narrative Section: This is the soul of A-ICT. It combines all data points into a human-readable story:
📍 Current Phase: Tells you if you are in a high-volatility Killzone or a consolidation phase like the Asian Range.
🎯 Bias & Alignment: Your primary direction, with a clear indicator of HTF alignment or conflict.
🔗 Events: A causal sequence of recent events, like "💧 Sell-side liquidity swept →
📊 Bullish BOS → 🎯 Active Order Block".
🎯 Next Expectation: The script's logical conclusion. It provides a specific, forward-looking hypothesis, such as "📉 Pullback expected to bullish OB at 1.2345 before continuation up."
🎨 READING THE BATTLEFIELD: A VISUAL INTERPRETATION GUIDE
Every color and line is a piece of information. Learn to read them together to see the full picture.
The Core Zones (Boxes):
Blue Box (Order Block): Highest probability zone for trend continuation. Look for entries here.
Orange Box (Trap Zone): A manipulation footprint. Expect a potential reversal after price interacts with this zone.
Green Box (Reversal/S&R): A standard pivot area. A good reference point but requires more confluence.
Purple Box (FVG): A market imbalance. Acts as a magnet for price. An FVG inside an Order Block is an A+ confluence.
The Structural Lines:
Green/Red Line (eBOS): Confirms the trend direction. A break above the green line is bullish; a break below the red line is bearish.
Thick Orange Line (CHoCH): WARNING. The previous trend is now in question. The market character has changed.
Blue/Red Lines (BSL/SSL): Liquidity targets. Expect price to gravitate towards these lines. A dotted line with a checkmark (✓) means the liquidity has been "swept" or "purged."
How to Synthesize: The magic is in the confluence. A perfect setup might look like this: Price sweeps below a red SSL line , enters a green Discount Zone during the NY Killzone , and forms a blue Order Block which then causes a green eBOS . This sequence, visible at a glance, is the story of a high-probability long setup.
🔧 THE ARCHITECT'S VISION: THE DEVELOPMENT JOURNEY
A-ICT was forged from the frustration of using lagging indicators in a market that is forward-looking. Traditional tools are reactive; they tell you what happened. The vision for A-ICT was to create a proactive engine that could anticipate institutional behavior by understanding their objectives: liquidity and efficiency. The development process was centered on creating a "lifecycle" for price patterns—the idea that a zone's true meaning is only revealed by its consequence. This led to the post-breakout classification system and the narrative-building engine. It's designed not just to show you patterns, but to tell you their story.
⚠️ RISK DISCLAIMER & BEST PRACTICES
Advanced ICT Theory (A-ICT) is a professional-grade analytical tool and does not provide financial advice or direct buy/sell signals. Its analysis is based on historical price action and probabilities. All forms of trading involve substantial risk. Past performance is not indicative of future results. Always use this tool as part of a comprehensive trading plan that includes your own analysis and a robust risk management strategy. Do not trade based on this indicator alone.
観の目つよく、見の目よわく
"Kan no me tsuyoku, ken no me yowaku"
— Miyamoto Musashi, The Book of Five Rings
English: "Perceive that which cannot be seen with the eye."
— Dskyz, Trade with insight. Trade with anticipation.

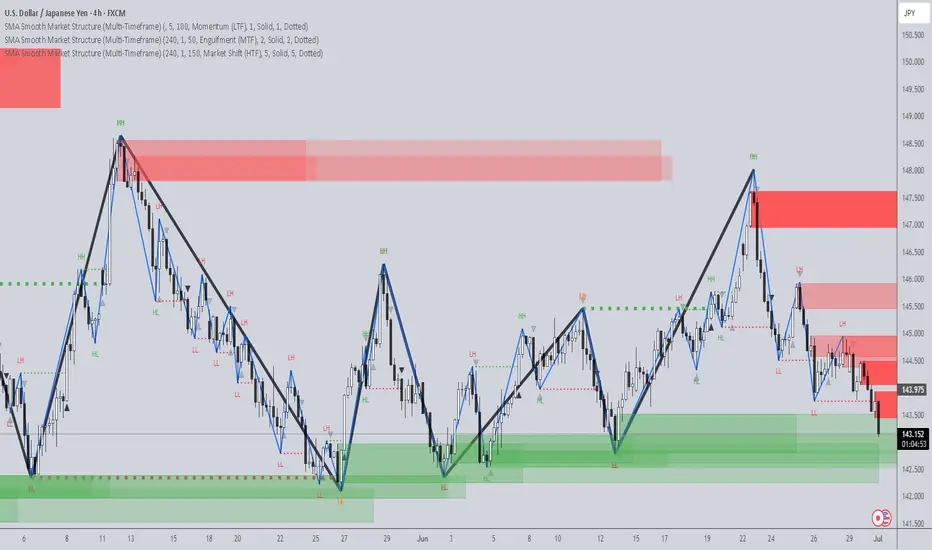
SMA Smooth Market Structure (Multi-Timeframe)SMA Market Structure (Multi-Timeframe) is a powerful tool for tracking structural price action, using simple moving averages across any higher timeframe (HTF). It blends Smart Money Concepts with clean swing logic to reveal trend shifts, breaks of structure, and supply/demand zones.
This indicator highlights key structure features:
• Break of Structure (BOS) – Automatic detection of bullish or bearish swing breaks
• Internal Shifts – Early clues that the market is building toward a reversal
• Liquidity Sweeps (LS) – Detects swing failures that may trap traders
• Zigzag Swing Lines – Cleanly connects swing highs and lows
• Dynamic Zones – Demand (green) and supply (red) blocks drawn from engulfing breakouts
How to Use:
• Set your preferred HTF (e.g. 1H on a 15m chart) to view structure in proper context and
adjust SMA to smooth out market structure for directional consistency
• Watch BOS lines and swing labels like HH, HL, LH, LL for directional clarity
• Use the MS (Market Shift) label to identify full reversals after internal shifts + BOS
• Demand/Supply zones mark areas of previous strength and will update or mitigate automatically
• Alerts notify you of every BOS, MS, HH, LL, and LS event — no need to monitor manually
Customization Features:
• Toggle visibility of market shift markers, internal shifts, and zones
• Choose how internal shifts are calculated (High/Low or Open)
• Customize line style, width, and colors for BOS and zigzag lines
• Control zone duration and how mitigated zones behave (fade or delete)
• Built-in safety for Pine Script’s history limits using smart offset caps
Best Use Tips:
• Combine with price action patterns or volume for confirmation
• MS + BOS + zone tap often marks a high-probability reversal setup
• Use it to align lower timeframe entries with higher timeframe structure
For traders who want structure clarity without clutter, this tool is built to keep your chart actionable and adaptive.
ICT Swiftedge# ICT SwiftEdge: Advanced Market Structure Trading System
**Overview**
ICT SwiftEdge is a powerful trading system built upon the foundation of ICTProTools' ICT Breakers, licensed under the Mozilla Public License 2.0 (mozilla.org). This script has been significantly enhanced by to combine market structure analysis with modern technical indicators and a sleek, AI-inspired statistics dashboard. The goal is to provide traders with a comprehensive tool for identifying high-probability trade setups, managing exits, and tracking performance in a visually intuitive way.
**Credits**
This script is a derivative work based on the original "ICT Breakers" by ICTProTools, used with permission under the Mozilla Public License 2.0. Significant enhancements, including RSI-MA signals, trend filtering, dynamic timeframe adjustments, dual exit strategies, and an AI-style statistics dashboard, were developed by . We express our gratitude to ICTProTools for their foundational work in market structure analysis.
**What It Does**
ICT SwiftEdge integrates multiple trading concepts to help traders identify and manage trades based on market structure and momentum:
- **Market Structure Analysis**: Identifies Break of Structure (BOS) and Market Structure Shift (MSS) patterns, which signal potential trend continuations or reversals. BOS indicates a continuation of the current trend, while MSS highlights a shift in market direction, providing key entry points.
- **RSI-MA Signals**: Generates "BUY" and "SELL" signals when BOS or MSS patterns align with the Relative Strength Index (RSI) smoothed by a Moving Average (RSI-MA). Signals are filtered to occur only when RSI-MA is above 50 (for buys) or below 50 (for sells), ensuring momentum supports the trade direction.
- **Trend Filtering**: Prevents multiple signals in the same trend, ensuring only one buy or sell signal per trend direction, reducing noise and improving trade clarity.
- **Dynamic Timeframe Adjustment**: Automatically adjusts pivot points, RSI, and MA parameters based on the selected chart timeframe (1M to 1D), optimizing performance across different market conditions.
- **Flexible Exit Strategies**: Offers two user-selectable exit methods:
- **Trailing Stop-Loss (TSL)**: Exits trades when price moves against the position by a user-defined distance (in points), locking in profits or limiting losses.
- **RSI-MA Exit**: Exits trades when RSI-MA crosses the 50 level, signaling a potential loss of momentum.
- Users can enable either or both strategies, providing flexibility to adapt to different trading styles.
- **AI-Style Statistics Dashboard**: Displays real-time trade performance metrics in a futuristic, neon-colored interface, including total trades, wins, losses, win/loss ratio, and win percentage. This helps traders evaluate the system's effectiveness without external tools.
**Why This Combination?**
The integration of these components creates a synergistic trading system:
- **BOS/MSS and RSI-MA**: Combining market structure breaks with RSI-MA ensures entries are based on both price action (structure) and momentum (RSI-MA), increasing the likelihood of high-probability trades.
- **Trend Filtering**: By limiting signals to one per trend, the system avoids overtrading and focuses on significant market moves.
- **Dynamic Adjustments**: Timeframe-specific parameters make the system versatile, suitable for scalping (1M, 5M) or swing trading (4H, 1D).
- **Dual Exit Strategies**: TSL protects profits during trending markets, while RSI-MA exits are ideal for range-bound or reversing markets, catering to diverse market conditions.
- **Statistics Dashboard**: Provides immediate feedback on trade performance, enabling data-driven decision-making without manual tracking.
This combination balances technical precision with user-friendly visuals, making it accessible to both novice and experienced traders.
**How to Use**
1. **Add to Chart**: Apply the script to any TradingView chart.
2. **Configure Settings**:
- **Chart Timeframe**: Select your chart's timeframe (1M to 1D) to optimize parameters.
- **Structure Timeframe**: Choose a timeframe for market structure analysis (leave blank for chart timeframe).
- **Exit Strategy**: Enable Trailing Stop-Loss (`useTslExit`), RSI-MA Exit (`useRsiMaExit`), or both. Adjust `tslPoints` for TSL distance.
- **Show Signals/Labels**: Toggle `showSignals` and `showExit` to display "BUY", "SELL", and "EXIT" labels.
- **Dashboard**: Enable `showDashboard` to view trade statistics. Customize colors with `dashboardBgColor` and `dashboardTextColor`.
3. **Trading**:
- Look for "BUY" or "SELL" labels to enter trades when BOS/MSS aligns with RSI-MA.
- Exit trades at "EXIT" labels based on your chosen strategy.
- Monitor the statistics dashboard to track performance (total trades, win/loss ratio, win percentage).
4. **Alerts**: Set up alerts for BOS, MSS, buy, sell, or exit signals using the provided alert conditions.
**License**
This script is licensed under the Mozilla Public License 2.0 (mozilla.org). The source code is available for review and modification under the terms of this license.
**Compliance with TradingView House Rules**
This publication adheres to TradingView's House Rules and Scripts Publication Rules. It provides a clear, self-contained description of the script's functionality, credits the original author (ICTProTools), and explains the rationale for combining indicators. The script contains no promotional content, offensive language, or proprietary restrictions beyond MPL 2.0.
**Note**
Trading involves risk, and past performance is not indicative of future results. Always backtest and validate the system on your preferred markets and timeframes before live trading.
Enjoy trading with ICT SwiftEdge, and let data-driven insights guide your decisions!

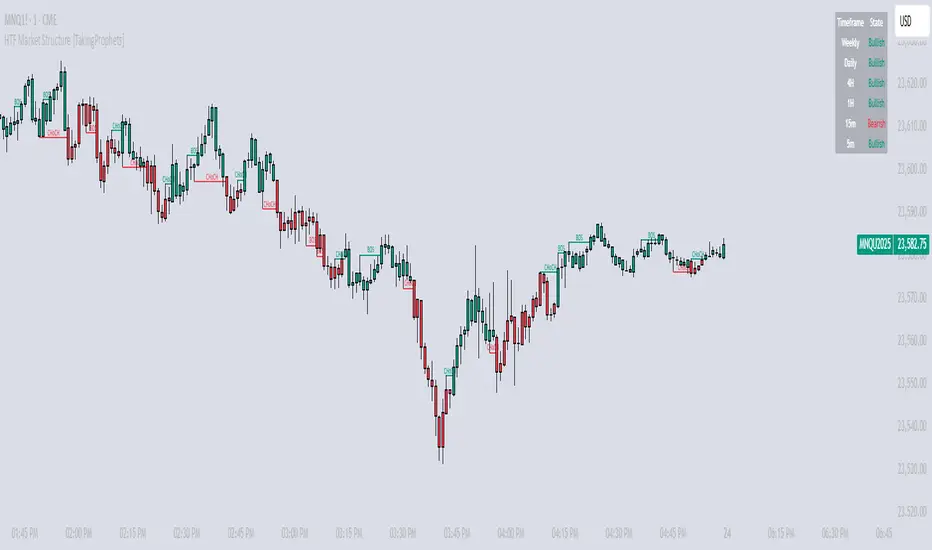
HTF Market Structure [TakingProphets]HTF Market Structure
The Market Structure CHoCH/BOS (Fractal) Indicator is designed for traders using smart money concepts and ICT (Inner Circle Trader) methodology to track market structure shifts in real time. It automatically detects Change of Character (CHoCH) and Break of Structure (BOS) events based on fractal highs and lows, helping traders identify potential trend reversals and continuations with greater precision.
🔹 Key Features:
✅ Automatic CHoCH & BOS Detection – No need for manual plotting; the indicator highlights key structure shifts.
✅ Custom Lookback Period – Adjustable fractal settings to fine-tune market structure sensitivity.
✅ Multi-Timeframe Market Structure Table – Displays the most recent CHoCH state on multiple timeframes (Weekly, Daily, 4H, 1H, 15m, 5m).
✅ Candle Coloring – Optional feature to change candle colors after a CHoCH for better visual clarity.
✅ Works Across All Markets – Use it for Forex, Stocks, Crypto, and Futures.
🔹 How It Works:
📌 Break of Structure (BOS) – Indicates a continuation of the existing trend when price breaks a previous swing high or low.
📌 Change of Character (CHoCH) – Suggests a potential trend reversal when price structure shifts direction.
📌 Multi-Timeframe Confirmation – The built-in table tracks the latest CHoCH across different timeframes to help confirm bias.
🔹 How to Use:
Look for CHoCH signals at key liquidity zones (order blocks, fair value gaps).
Use BOS confirmations to follow trend continuations.
Combine with other smart money concepts like imbalance fills and liquidity grabs for stronger trade setups.
🚀 Enhance your market structure analysis with the CHoCH/BOS Indicator
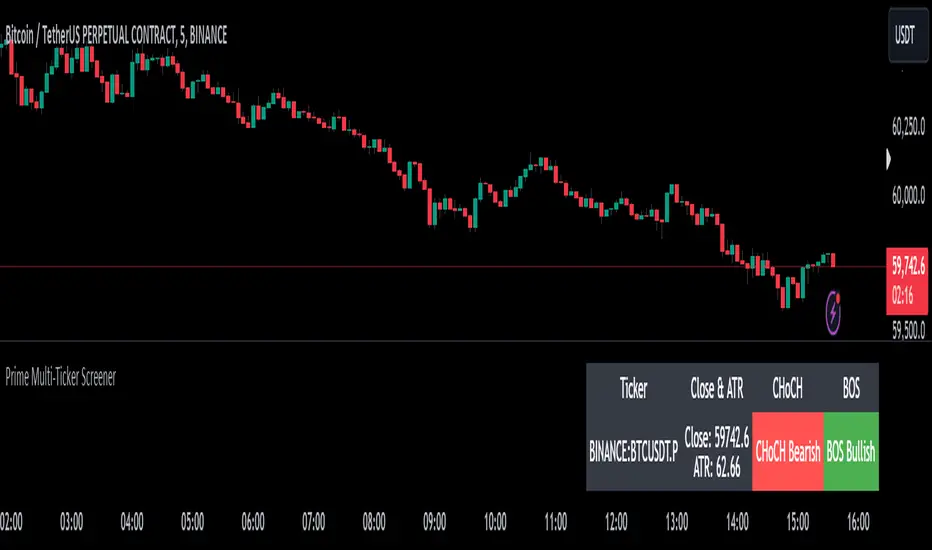
Prime Multi-Ticker Screener: Real-Time Market StructurePrime Multi-Ticker Screener: Real-Time Market Structure and Trend Detection Tool
Prime Multi-Ticker Screener is designed to track multiple tickers simultaneously, providing real-time insights into market trends and structure changes such as CHoCH (Change of Character) and BOS (Break of Structure). This tool is perfect for traders looking to monitor multiple assets across different timeframes while receiving clear signals that highlight critical market shifts. The indicator delivers instant visual feedback with color-coded backgrounds to make interpreting signals easy and efficient.
Core Features of Prime Multi-Ticker Screener
Multi-Ticker Monitoring: Track up to 5 tickers across multiple timeframes in a single dashboard. This makes it easy to watch several assets at once without cluttering your chart.
CHoCH and BOS Detection: The screener automatically detects and highlights significant market structure shifts. CHoCH signals are shown when a trend reverses or consolidates, while BOS signals indicate a break in previous highs or lows, helping traders catch potential trend reversals early.
Color-Coded Visuals: The background of each signal cell dynamically changes color to represent bullish or bearish signals. Green indicates bullish activity, while red highlights bearish market shifts, making it easy for traders to identify key movements at a glance.
Close Price and ATR Data: For each ticker, the screener displays both the current close price and the 14-period Average True Range (ATR), providing important volatility information to support decision-making.
Detailed Explanation of How Prime Multi-Ticker Screener Works
Prime Multi-Ticker Screener combines trend detection with real-time market structure analysis to deliver comprehensive market insights. It analyzes the following components:
CHoCH Detection: Change of Character occurs when the market switches from trending to ranging or vice versa. This indicator catches these moments by identifying when prices cross pivot levels, providing traders with a valuable signal of potential market phase changes.
BOS Detection: The Break of Structure function highlights moments when the price breaks a significant high or low, often indicating the start of a new trend or the continuation of an existing one.
Close Price & ATR Monitoring: Alongside market structure signals, the screener provides real-time data on the close price and the Average True Range (ATR), ensuring traders have a complete picture of the price and volatility landscape for each asset they are tracking.
Why It's Useful for Traders
Prime Multi-Ticker Screener is a versatile tool that offers substantial benefits to traders who want to stay informed about multiple assets and trends simultaneously:
Comprehensive Monitoring: Track multiple assets in real time, all from a single indicator. Whether you trade crypto, forex, or stocks, this tool helps you stay on top of market movements across different assets and timeframes.
Market Structure Analysis: The automatic detection of CHoCH and BOS signals gives traders an edge by identifying potential reversals and trend continuations as they happen, allowing for more timely and informed trading decisions.
Efficient and Intuitive Design: The screener is designed with simplicity in mind. The color-coded backgrounds quickly alert traders to market structure shifts without overwhelming them with data, making it ideal for those who need to act fast.
How It Works: Practical Usage
Prime Multi-Ticker Screener is ideal for:
Day traders: The real-time tracking of multiple assets allows day traders to quickly spot trading opportunities across different markets.
Swing traders: CHoCH and BOS detection help swing traders catch key market structure shifts, helping them align trades with emerging trends.
Trend followers: The screener provides instant feedback on when a trend is continuing or breaking, helping trend-following traders maintain their positions or exit early when needed.
By combining multiple key metrics—price, volatility, and market structure—Prime Multi-Ticker Screener ensures traders are well-equipped to manage their positions across a variety of assets.
Risk Disclaimer
While Prime Multi-Ticker Screener provides valuable market insights, it's important to remember:
Past performance is not indicative of future results: This screener provides analysis based on historical data, and no indicator can predict future market movements with certainty.
Market Conditions: The effectiveness of Prime Multi-Ticker Screener may vary in different market conditions, so traders should always use proper risk management when trading.
Trading Risks: Like any trading tool, Prime Multi-Ticker Screener should be used as part of a comprehensive trading strategy, including risk management techniques such as stop-loss orders and position sizing.
Mxwll Price Action Suite [Mxwll]Introducing the Mxwll Price Action Suite!
The Mxwll Price Action Suite is an all-in-one analysis indicator incorporating elements of SMC and also ideas extending beyond the trading methodology!
Features
Internal structures
External structures
Customizable Sensitivities
BoS/CHoCH
Order Blocks
HH/LH/LL/LH Areas
Rolling TF highs/lows
Rolling Volume Comparisons
Auto Fibs
And more!
The image above shows the indicator's market structure identification capabilities. Internal BoS and CHoCH structures in addition to overarching market structures are available with customizable sensitivities.
The image above shows the indicator identifying order blocks! Additionally, HH/LH/LL/LH areas are also identified.
The image above shows a rolling area of interest. These areas can be compared to supply/demand zones, where traders might consider a bargain long/short/sell area.
The indicator displays a rolling 4hr high/low and 1D high/low, alongside auto fibonacci levels with a customizable sensitivity.
Finally, the Mxwll Price Action Suite shows relevant session information.
Table information
Current Session
Countdown to session close
Next Session
Countdown to next session open
Rolling 4-Hr volume intensity
Rolling 24-Hr volume intensity
Introducing the Mxwll SMC Suite!
The Mxwll SMC Suite is an all-in-one analysis indicator incorporating elements of SMC and also ideas extending beyond the trading methodology!
Features
Internal structures
External structures
Customizable Sensitivities
BoS/CHoCH
Order Blocks
HH/LH/LL/LH Areas
Rolling TF highs/lows
Rolling Volume Comparisons
Auto Fibs
And more!
The image above shows the indicator's market structure identification capabilities. Internal BoS and CHoCH structures in addition to overarching market structures are available with customizable sensitivities.
The image above shows the indicator identifying order blocks! Additionally, HH/LH/LL/LH areas are also identified.
The image above shows a rolling area of interest. These areas can be compared to supply/demand zones, where traders might consider a bargain long/short/sell area.
The indicator displays a rolling 4hr high/low and 1D high/low, alongside auto fibonacci levels with a customizable sensitivity.
Finally, the Mxwll Price Action Suite shows relevant session information.
Table information
Current Session
Countdown to session close
Next Session
Countdown to next session open
Rolling 4-Hr volume intensity
Rolling 24-Hr volume intensity
Expanded Features of Mxwll Price Action Suite
Internal and External Structures
Internal Structures: These elements refer to the price formations and patterns that occur within a smaller scope or a specific trading session. The suite can detect intricate details like minor support/resistance levels or short-term trend reversals.
External Structures: These involve larger, more significant market patterns and trends spanning multiple sessions or time frames. This capability helps traders understand overarching market directions.
Customizable Sensitivities
Adjusting sensitivity settings allows users to tailor the indicator's responsiveness to market changes. Higher sensitivity can catch smaller fluctuations, while lower sensitivity might focus on more significant, reliable market moves.
Break of Structure (BoS) and Change of Character (CHoCH)
BoS: This feature identifies points where the price breaks a significant structure, potentially indicating a new trend or a trend reversal.
CHoCH: Detects subtle shifts in the market's behavior, which could suggest the early stages of a trend change before they become apparent to the broader market.
Order Blocks and Market Phases
Order Blocks: These are essentially price levels or zones where significant trading activities previously occurred, likely pointing to the positions of smart money.
HH/LH/LL/LH Areas: Identifying Higher Highs (HH), Lower Highs (LH), Lower Lows (LL), and Lower Highs (LH) helps in understanding the trend and market structure, aiding in predictive analysis.
Rolling Timeframe Highs/Lows and Volume Comparisons
Tracks highs and lows over specified rolling periods, providing dynamic support and resistance levels.
Compares volume data across different timeframes to assess the strength or weakness of the current price movements.
Auto Fibonacci Levels
Automatically calculates and plots Fibonacci retracement levels, a popular tool among traders to identify potential reversal points based on past movements.
Session Data and Volume Intensity
Session Information: Displays current and upcoming trading sessions along with countdown timers, which is crucial for day traders and those trading on session overlaps.
Volume Intensity: Measures and compares the volume within the last 4 hours and 24 hours to gauge market activity and potential breakout/breakdown movements.
Visualizations and Practical Use
Dynamic Visuals: The suite provides dynamic visual aids, such as real-time updating of high/low markers and Fibonacci levels, which adjust as new data comes in. This feature is critical in fast-paced markets.
Strategic Entry/Exit Points: By identifying order blocks and using Fibonacci levels, traders can pinpoint strategic entry and exit points, maximizing potential returns.
Risk Management: Enhanced features like session countdowns and volume intensity help in better risk management by providing traders with more data on market sentiment and potential volatility.

Break of Structure with trend table by GadatasThis indicator is designed to identify and track swing highs and lows in a given market on chart timeframe. It plots these swing highs and lows as solid lines on the chart. The indicator allows for customization of the line color and width. The selected timeframe trend is visually represented in a table located in the upper right corner of the chart. To enhance consistency, the background color of the timeframe column now elegantly matches the color of the BOS line.
The indicator follows specific rules to determine when a new high or low is created. If the current range is considered bullish (meaning the most recent breakout was to the topside), the indicator will only update the low if a candle's body falls below the current low. However, if the current range is bearish (most recent breakout to the downside), the indicator will only update the high if a candle's body rises above the current high.
When a range is identified as bullish, the indicator will continue updating the high until a swing high is formed, denoting the high of the range. The high will only change if a candle's body surpasses the previous high. The low, on the other hand, will be updated based on the last time a candle's body falls below a previous candle's low. The lowest low after this condition is met will be assigned as the low of the range.
Conversely, when a range is identified as bearish, the indicator will continue updating the low until a swing low is formed, denoting the low of the range. The low will only change if a candle's body falls below the previous low. The high, in this case, will be updated based on the last time a candle's body rises above a previous candle's high. The highest high after this condition is met will be assigned as the high of the range.
Swing highs are determined by having lower highs to the left and right, while swing lows have higher lows to the left and right. These swings are used to determine the final high or low of a bullish or bearish range, respectively.
Tis Indicator differs from other indicators by incorporating this concept to track market structure. The indicator assumes that significant market players sell before making heavy purchases in bullish ranges and buy before selling heavily in bearish ranges. The lines on the chart represent prior highs and lows, as well as the current updated highs and lows based on this theory. By using this indicator, one can gain insights into the structure of price movement and potentially identify bullish or bearish continuations. It can also provide confluence when analyzing multiple timeframes to validate trend-following strategies.
Open-source script.
It now displays both short and long condition changes along with their respective arguments:
1. In the case of a high Bos line break followed by a fall, a very long condition change is made when at least three breaks of Bos Low are observed, transitioning from very short to short then distribution , and after that to long.
2. Short conditions are indicated when a high Bos falls and the condition changes from very long to long and then accumulation, short, and very short with each break.
Additionally, the break counter column now shows positive numbers for long situations, indicating each low Bos break, and negative numbers for short situations, indicating each high Bos break.
The background color of the break counter column now changes to green for positive numbers and red for negative numbers.

Smart Money Concepts (SMC) [LuxAlgo]This all-in-one indicator displays real-time market structure (internal & swing BOS / CHoCH), order blocks, premium & discount zones, equal highs & lows, and much more...allowing traders to automatically mark up their charts with widely used price action methodologies. Following the release of our Fair Value Gap script, we received numerous requests from our community to release more features in the same category.
"Smart Money Concepts" (SMC) is a fairly new yet widely used term amongst price action traders looking to more accurately navigate liquidity & find more optimal points of interest in the market. Trying to determine where institutional market participants have orders placed (buy or sell side liquidity) can be a very reasonable approach to finding more practical entries & exits based on price action.
The indicator includes alerts for the presence of swing structures and many other relevant conditions.
Features
This indicator includes many features relevant to SMC, these are highlighted below:
Full internal & swing market structure labeling in real-time
Break of Structure (BOS)
Change of Character (CHoCH)
Order Blocks (bullish & bearish)
Equal Highs & Lows
Fair Value Gap Detection
Previous Highs & Lows
Premium & Discount Zones as a range
Options to style the indicator to more easily display these concepts
Settings
Mode: Allows the user to select Historical (default) or Present, which displays only recent data on the chart.
Style: Allows the user to select different styling for the entire indicator between Colored (default) and Monochrome.
Color Candles: Plots candles based on the internal & swing structures from within the indicator on the chart.
Internal Structure: Displays the internal structure labels & dashed lines to represent them. (BOS & CHoCH).
Confluence Filter: Filter non-significant internal structure breakouts.
Swing Structure: Displays the swing structure labels & solid lines on the chart (larger BOS & CHoCH labels).
Swing Points: Displays swing points labels on chart such as HH, HL, LH, LL.
Internal Order Blocks: Enables Internal Order Blocks & allows the user to select how many most recent Internal Order Blocks appear on the chart.
Swing Order Blocks: Enables Swing Order Blocks & allows the user to select how many most recent Swing Order Blocks appear on the chart.
Equal Highs & Lows: Displays EQH/EQL labels on chart for detecting equal highs & lows.
Bars Confirmation: Allows the user to select how many bars are needed to confirm an EQH/EQL symbol on chart.
Fair Value Gaps: Displays boxes to highlight imbalance areas on the chart.
Auto Threshold: Filter out non-significant fair value gaps.
Timeframe: Allows the user to select the timeframe for the Fair Value Gap detection.
Extend FVG: Allows the user to choose how many bars to extend the Fair Value Gap boxes on the chart.
Highs & Lows MTF: Allows the user to display previous highs & lows from daily, weekly, & monthly timeframes as significant levels.
Premium/Discount Zones: Allows the user to display Premium, Discount, and Equilibrium zones on the chart
Usage
Users can see automatic CHoCH and BOS labels to highlight breakouts of market structure, which allows to determine the market trend. In the chart below we can see the internal structure which displays more frequent labels within larger structures. We can also see equal highs & lows (EQH/EQL) labels plotted alongside the internal structure to frequently give indications of potential reversals.
In the chart below we can see the swing market structure labels. These are also labeled as BOS and CHoCH but with a solid line & larger text to show larger market structure breakouts & trend reversals. Users can be mindful of these larger structure labels while trading internal structures as displayed in the previous chart.
Order blocks highlight areas where institutional market participants open positions, one can use order blocks to determine confirmation entries or potential targets as we can expect there is a large amount of liquidity at these order blocks. In the chart below we can see 2 potential trade setups with confirmation entries. The path outlined in red would be a potential short entry targeting the blue order block below, and the path outlined in green would be a potential long entry, targeting the red order blocks above.
As we can see in the chart below, the bullish confirmation entry played out in this scenario with the green path outlined in hindsight. As price breaks though the order blocks above, the indicator will consider them mitigated causing them to disappear, and as per the logic of these order blocks they will always display 5 (by default) on the chart so we can now see more actionable levels.
The Smart Money Concepts indicator has many other features and here we can see how they can also help a user find potential levels for price action trading. In the screenshot below we can see a trade setup using the Previous Monthly High, Strong High, and a Swing Order Block as a stop loss. Accompanied by the Premium from the Discount/Premium zones feature being used as a potential entry. A potential take profit level for this trade setup that a user could easily identify would be the 50% mark labeled with the Fair Value Gap & the Equilibrium all displayed automatically by the indicator.
Conclusion
This indicator highlights all relevant components of Smart Money Concepts which can be a very useful interpretation of market structure, liquidity, & more simply put, price action. The term was coined & popularized primarily within the forex community & by ICT while making its way to become a part of many traders' analysis. These concepts, with or without this indicator do not guarantee a trader to be trading within the presence of institutional or "bank-level" liquidity, there is no supporting data regarding the validity of these teachings.

Investment Boat(Yatırım Botu)English:
The investment bot plugin works according to past 90 bar(candle) statistics. It shows goals that you can use to detect cheap products and products that you buy that you can easily sell. Invest bot add-on at the best price 1 (2 (Method:) to apply the technique of buying piece by piece, or the price becomes cheaper as it increases the amount of the purchase, make an average near the bottom, and opportunity all at once and decreases capital input blocks missing bottom: method of capture: the product helps to obtain.
Features:
The investment bot does not trade for you, it informs you at the most convenient times, purchases are made manually.
By automating all reviews of the product you want to review, it eliminates the human and error factor that doesn't leave a feature you forgot to review.
According to past statistics, it examines whether the price of the product being studied is suitable for profit, you can instantly determine which product is cheaper, and avoid getting caught up in FOMO.
Shows the correct Trading Method to be made in the trend determined by Trend Tracking. (Hold in rising trend, buy - sell in horizontal trend, buy opportunity in falling trend)
It shows Trend turns with colored candles and you get push notifications in important areas when the alarm is set. This feature is very important, it helps you capture the product from the bottom and continue the process by moving your stop level.
According to Old statistics examined when collecting and selling goods, it shows possible price return zones where you can easily buy and sell the product with red(buy) and green(sell) lines.
You may receive notifications in overbought and sold zones. Even if you don't follow the important price movements associated with the product with the alarm when you install an Alarm, you know that your eyes will not stay behind.
Keep the plugin to yourself with customizable settings.
Method 1:
The investment bot piecemeal purchase technique plugin scores between 0 and 6 based on the price of the product; 3x, 5x. Let's think of the X value as $ 100. It looks like a $ 500 transaction will open for 3x points, 300 points, 5x points. thanks to purchases made using the piecemeal purchase technique, you provide an average price close to the lower price of the product that returns from the bottom. A 0x score indicates that this product is not suitable for medium-and long-term purchases, its price is expensive, but it is your job to green lines hit-and-run operations.
Example usage: we decided to buy Bitcoin we want to buy Bitcoin we divide the capital you set aside to buy Bitcoin into 21 parts (1x+2x+3x+4x+5x+6x=21x) if Bitcoin were at the current 3x level (3x+4x+5x=12x) we would divide it into 12 parts. Our initial purchase support and resistance lines after raising the price if the price rises, we thought we would make a left turn at the profit level we made, but it could be pulled down if it goes according to the price level we continue to add, in the process of adding each, when adding the product, to give a signal to return the price if we don't. Sometimes it can drop from 2 to 3 levels without adding products skipped level we can shop by adding your purchases to the current level you have decided. If you have collected enough products, all that remains is to wait for the rise, so you can collect the investment you have created from the appropriate levels, piece by piece or wholesale, at targets indicated by Green lines created according to the old statistics. Don't forget to make a profit.
Method 2:
The yellow candle and purple candle that come in trend turns indicate the most accurate times for us to get in and out of the process. The price is to see the yellow candle, we get the product from here and immediately between 1-3% here now the goal is that if the circuit does not occur and the drop will be lower, we catch the product from the bottom, but thanks to the product caught from the bottom, we can not stop a few times until this return to get the product out of the process, when there should be a stop under the yellow candle, stop losses that turn from the bottom area are very easily compensated. After you purchase the product, a rising trend if the trend breaks the current trend continues to fall, if the process exits, but does not continue to decline-a trend we expect to see goals worsen purple candle purple candle means to sell, but when we see these purple candles, how much you sell doesn't mean we're going to stop level under the purple candle, cheap and easy to buy products we don't sell if the rising trend continues, we are constantly moving under the purple candle to the stop level. You get maximum profit at the end of the transaction, but sometimes Future fake moves and needles will cause you to stop unnecessarily, unfortunately there is no solution or measure for this.
Warning: the investment bot plugin aims to shop at the right time, but before buying, supports must be withdrawn, it must be verified that the price does not fall only to act according to the plugin and to trade non-stop (even when collecting goods 10-20% should be placed, even better than losing 70-80% in possible large falls) is wrong. Depending on the chart time you use, the results calculated by the plugin may vary, and smaller time statistics give less reliable results.
Türkçe:
Yatırım Botu eklentisi geçmiş 90 bar(mum) istatistiklerine göre çalışmaktadır. Ucuzlayan ürünleri tespit etmek için kullanabileceğiniz gibi aldığınız ürünleri rahatça satabileceğiniz hedefleri de göstermektedir. Yatırım Botu eklentisi size tepeden ürün aldırmaz ürünü en uygun fiyattan alabilmeniz için (Yöntem 1:) parçalı alım tekniği uygulamanıza yada (Yöntem 2:) dip yakalamanıza yardımcı olur: Fiyat ucuzladıkça alım miktarını arttırarak ortalamanızın dibe yakın olmasını sağlar ayrıca tüm sermayeniz ile tek seferde girip düşüşlerde fırsatları kaçırmanıza engel olur.
Özellikleri:
Yatırım Botu sizin yerinize alım satım yapmaz en uygun zamanlarda sizi bilgilendirir, alımlar manuel yapılır.
İncelenmek istenen ürün ile ilgili tüm incelemeleri otomatik yaparak incelemeyi unuttuğunuz bir özellik bırakmaz insan ve hata faktörünü ortadan kaldırır.
İncelenen ürün fiyatının kazanç elde edilebilmesi için uygun durumda olup olmadığını geçmiş istatistiklere göre inceler hangi ürünün daha fazla ucuzladığını anında tespit edebilirsiniz, FOMO'ya kapılmanızın önüne geçer tepeden malı elinize veremezler.
Trend takibi ile tespit edilen trend'te yapılması doğru olan trade yöntemini gösterir. (Yükselen Trend'te Alınan Tutulur, Yatay Trend'te Al - Sat, Düşen Trend'te ise Fırsat Alımı)
Trend dönüşlerini renkli mumlar ile gösterir ve alarm kurulduğunda önemli bölgelerde anlık bildirimler alırsınız. Bu özellik çok önemlidir ürünü en dipten yakalamanıza ve stop seviyenizi taşıyarak işleme devam etmenize yardımcı olur.
Mal toplarken ve satarken incelenen eski istatistiklere göre ürünü kolayca alabileceğiniz ve satabileceğiniz muhtemel fiyat dönüş bölgelerini kırmızı(alış) ve yeşil(satış) çizgiler ile gösterir.
Aşırı alım ve satım bölgelerinde bildirim alabilirsiniz. Alarm kurduğunuzda alarm bulunan ürün ile ilgili önemli fiyat hareketlerini takip etmeseniz bile bilirsiniz, gözünüz arkada kalmaz.
Özelleştirilebilir ayarlar ile eklentiyi kendinize uydurun.
Yöntem 1:
Yatırım Botu Parçalı Alım Tekniği Eklentisi ürünün fiyatına bakarak ucuzlama durumunu 0 ile 6 arasında puanlar; 3x, 5x gibi. X değerini 100 dolar olarak düşünelim. 3x olan puana 300 dolarlık 5x olan puana 500 dolarlık işlem açılacak gibi. Parçalı alım tekniği ile yapılan alımlar sayesinde fiyatı dipten dönen ürünün dip fiyatına yakın bir ortalama sağlarsınız. 0x puanı o ürünün orta uzun vade alım için uygun olmadığını fiyatının pahalı olduğunu gösterir ancak yeşil hedeflere kadar vur kaç işlemleri yapmak sizin bileceğiniz iştir.
Örnek Kullanım: Bitcoin almaya karar verdik alım yapmak istiyoruz Bitcoin almak için ayırdığınız sermayeyi 21 parçaya bölüyoruz (1x+2x+3x+4x+5x+6x=21x) eğer Bitcoin şuan 3x alınabilir seviyede olsaydı (3x+4x+5x=12x) 12 parçaya bölecektik. İlk alımımızı destek ve direnç çizgilerini çektikten sonra fiyatın yukarı dönüş yapacağını düşündüğümüz seviyeden yapıyoruz fiyat yukarı giderse hemen kar ediyoruz ancak oldu da aşağı giderse alınabilir fiyat seviyelerine göre ekleme yapmaya devam ediyoruz her ekleme işlemi yapılırken fiyatın yukarı dönüş için bir sinyal vermesi şart ürün düşerken ekleme yapmıyoruz. Bazen ürün biz ekleme yapmadan 2 3 seviye birden düşebilir burada karar sizin atlanan seviye alımlarını mevcut seviyeye ekleyerek alım yapabilirsiniz. Yeterince ürün topladıysanız geriye sadece yükselişi beklemek kalır uygun seviyelerden toplayarak oluşturduğunuz yatırımı eski istatistiklere göre oluşturulan Yeşil Çizgilerle gösterilen hedeflerde parça parça yada toptan satabilirsiniz. Kar almayı ihmal etmeyin.
Yöntem 2:
Trend dönüşlerinde gelen sarı mum ve mor mum işleme girmemiz ve çıkmanız için en doğru zamanları gösterir. Sarı mum'u gördüğünüzde fiyat dip bölgesinden dönüş yapıyordur ürünü buradan alır ve hemen sarı mum altına stop koyarız %1-3 arasında olmalı daha fazla değil burada amaç eğer dönüş gerçekleşmez ve düşüş devam ederse işlemden çıkıp ürünü daha aşağıda gerçekleşecek dönüşten tekrar almaktır, ürünü dipten yakalayana kadar birkaç sefer stop olabiliriz ancak dipten yakalanan ürün sayesinde stop zararları çok rahat telafi edilmektedir. Ürünü aldıktan sonra bulunduğumuz trend yükselen bir trend ise kolay al-sat hedeflerinde ürünü ucuza satmıyoruz mor mum görmeyi bekliyoruz mor mum trend'in bozulabileceği anlamını taşıyor ancak kesin bozulacak elindekini sat kaç demek değildir bu nedenle mor mum'u gördüğümüzde stop seviyemizi mor mum altına taşıyoruz trend bozulur düşüş devam ederse işlemden çıkmış oluyoruz ancak düşüş devam etmez yükselen trend devam ederse stop seviyemizi sürekli mor mum altına taşıyarak ilerliyoruz. Sonunda maximum kar alarak işlemden çıkıyoruz ancak bazen gelecek fake hareketler ve iğneler gereksiz stop olmanıza neden olacaktır bunun bir çözümü yada önlemi yok malesef.
Uyarı: Yatırım Botu eklentisi doğru zamanlarda alım yaptırmayı amaçlar ancak alım yapmadan önce destekler çizilmeli fiyatın aşağı gitmediği onaylanmalıdır sadece eklentiye göre hareket etmek ve stopsuz işlem yapmak (Mal toplarken dahi %10-20 aşağıya bile olsa mutlaka konulmalıdır olası büyük düşüşlerde %70-80 kaybetmekten iyidir) yanlıştır. Kullandığınız grafik zamanına göre eklentinin hesapladığı sonuçlar değişebilir, küçük zaman istatistikleri daha az güvenilir sonuçlar verir.

TopTenAlgo 6. Trading IndexEN: Trend & Trading Index Oscillator is an indicator developed using Stochastic which makes your day trading easier. Is it to measure price swings with a more sensitive and close to zero error margin, and is the price movement and the direction of the trend compatible? is the ideal guide to look at. The oscillator consists of a 5 step system. Depressions below -0.85 are measured to determine the intake region (Lowlander 2) at the bottom of the step. At the top of the step, enthusiastic movements above 0.90 are detected to determine the sales region(Highlander 2). The buffer zone is the BALANCE "0" zone and its highlander "0. 40 zone close to enthusiasm, and the Lowlander "-0.50" zone close to depression.
This algorithm is prepared with @Top10Algo ... Study modify...
TR: Trend & Trading Index Osiatörü Stochastic kullanırak geliştirilen ve gün içi al satlarınızı kolaylaştıran bir göstergedir. Fiyat salınımlarını daha hassas ve sıfıra yakın bir hatalama payıyla ölçmek ve fiyat hareketi ile trendin yönü uyumlu mu? bakmak için en ideal yol göstericidir. Osilatör 5 basamaklı bir sistemden oluşmaktadır. Basamağın en altında alım bögesini belirlemek için -0.85 değerinin altındaki depresyonlar(Lowlander 2) ölçülür. Basamağın en üstünde ise satış bölgesini belirlemek için 0.90 değerinin üstündeki coşkulu hareketler (Highlander 2) tespit edilir. Ara bölge ise BALANCE “0” bögesi ve onun coşkuya yakın Highlander 1 “0.40" bölgesi ile depresyona yakın Lowlander 1 “-0.50" bölgesi yer alır.
Bu algoritma @Top10Algo ile beraber hazırlanmıştır... Çalışma Prensipleri modifiye edildi...

LuxAlgo® - Price Action Concepts™Price Action Concepts™ is a first of it's kind all-in-one indicator toolkit which includes various features specifically based on pure price action.
Order Blocks w/ volume data, real-time market structure (BOS, CHoCH, EQH/L) w/ 'CHoCH+' being a more confirmed reversal signal, a MTF dashboard, Trend Line Liquidity Zones (real-time), Chart Pattern Liquidity Zones, Liquidity Grabs, and much more detailed customization to get an edge trading price action automatically.
Many traders argue that trading price action is better than using technical indicators due to lag, complexity, and noisy charts. Popular ideas within the trading space that cater towards price action trading include "trading like the banks" or "Smart Money Concepts trading" (SMC), most prominently known within the forex community.
What differentiates price action trading from others forms of technical analysis is that it's main focus is on raw price data opposed to creating values or plots derived from price history.
Mostly all of the features within this script are generated purely from price action, more specifically; swing highs, swing lows, and market structure... which allows users to automate their analysis of price action for any market / timeframe.
🔶 FEATURES
This script includes many features based on Price Action; these are highlighted below:
Market structure (BOS, CHoCH, CHoCH+, EQH/L) (Internal & Swing) multi-timeframe
Volumetric Order Blocks & mitigation methods (bullish & bearish)
Liquidity Concepts
Trend Line Liquidity Zones
Chart Pattern Liquidity
Liquidity Grabs Feature
Imbalance Concepts MTF w/ multiple mitigation methods
Fair Value Gaps
Balanced Price Range
Activity Asymmetry
Strong/Weak Highs & Lows w/ volume percentages
Premium & Discount Zones included
Candle Coloring based on market structure
Previous Highs/Lows (Daily, Monday's, Weekly, Monthly, Quarterly)
Multi-Timeframe Dashboard (15m, 1h, 4h, 1d)
Built-in alert conditions & Any Alert() Function Call Conditions
Advanced Alerts Creator to create step-by-step alerts with various conditions
+ more (see changelog below for current features)
🔶 BASIC DEMONSTRATION
In the image above we can see a demonstration of the market structure labeling within this indicator. The automatic BOS & CHoCH labels on top of dashed lines give clear indications of breakouts & reversals within the internal market structure (short term price action). The "CHoCH+" label is also demonstrated as it triggers only if price has already made a new higher low, or lower high.
We can also see a solid line with a larger BOS label in the middle of the chart. This label demonstrates a break of structure taking into account the swing market structure (longer term price action). All of these labels are generated in real-time.
🔶 USAGE & EXAMPLES
In the image below we can see how a trade setup could be created using Order Blocks w/ volume metrics to find points of interest in the market, swing / internal market structure to get indications of longer & shorter term reversals, and trend line liquidity zones to find more likely impulses & breakouts within trends.
We can see in the next image below that price came down to the highest volume order block marked out previously as our point of interest for an entry used in confluence with the overall market structure being bullish (swing CHoCH). Due to price closing below the middle Order Block at (24.77%), we saw it was mitigated, and then price revisited liquidity above the Trend Line zone above, leading us to the first Order Block as a target.
You will notice the % values adjust as Order Blocks are touched & mitigated, aligning with the correct volume detected when the Order Block was established.
In the image below we can see more features from within Price Action Concepts™ indicator, including Chart Pattern Liquidity, Fair Value Gaps (one of many Imbalance Concepts), Liquidity Grabs, as well as the primary market structures & OBs.
By using multiple features as such, users can develop a greater interpretation of where liquidity rests in the market, which allows them to develop trading plans a lot easier. Liquidity Grabs are highlighted as blue/red boxes on the wicks during specific price action that indicates the market has made an impulse specifically to take out resting buy or sell side orders.
We can notice in the trade demonstrated below (hindsight example) how price often moves to the areas of the most liquidity, even if unexpected according to classical technical analysis performed by retail traders such as chart patterns. Wicks to take out orders above & potentially trap traders are much more noticeable with features such as these.
The Chart Patterns which can be detected include:
Ascending/Descending Wedges (Asc/Desc Wedge)
Ascending/Descending Broadening Wedges (Asc/Desc BW)
Ascending/Descending/Symmetrical Triangles (Asc/Desc/Sym Triangle)
Double Tops/Bottoms (Double Top/Double BTM)
Head & Shoulders (H&S)
Inverted Head & Shoulders (IH&S)
General support & resistance during undetected patterns
In the image below we can see more features from within the indicator, including Balanced Price Range (another imbalance method similar to FVG), Market Structure Candle Coloring, Accumulation & Distribution zones, Premium & Discount zones w/ a percentage on each zone, the MTF dashboard, as well as the Previous Daily Highs & Lows (one of many highs/lows) displayed on the chart automatically.
The colored candles use more specific market structure analysis, specifically allowing users to visualize when trends are considered "normal" or "strong". By utilizing other features alongside this market structure analysis, such as noticing price retesting the PDL level + the Equilibrium as resistance, a Balanced Price Range below price, the discount with a high 72% metric, and the MTF dashboard displaying an overall bearish structure...
...users can instantly gain a deeper interpretation of price action, make highly confluent trading plans while avoiding classical technical indicators, and use traditional retail trading concepts such as chart patterns / trend lines to their advantage in finding logical areas of liquidity & points of interest in the market.
The image below shows the previous chart zoomed in with 2 liquidity concepts re-enabled & used alongside a new range targeting the same Discount zone.
🔶 SETTINGS
Market Structure Internal: Allows the user to select which internal structures to display (BOS, CHoCH, or None).
Market Structure Swing: Allows the user to select which swing structures to display (BOS, CHoCH, or None).
MTF Scanner: See market structure on various timeframes & how many labels are active consecutively.
Equal Highs & Lows: Displays EQH / EQL labels on chart for detecting equal highs & lows.
Color Candles: Plots candles based on the internal & swing structures from within the indicator on the chart.
Order Blocks Internal: Enables Internal Order Blocks & allows the user to select how many most recent Internal Order Blocks appear on the chart as well as select a color.
Order Blocks Swing: Enables Swing Order Blocks & allows the user to select how many most recent Swing Order Blocks appear on the chart as well as select a color.
Mitigation Method: Allows the user to select how the script mitigates an Order Block (close, wick, or average).
Internal Buy/Sell Activity: Allows the user to display buy/sell activity within Order Blocks & decide their color.
Show Metrics: Allows the user to display volume % metrics within the Order Blocks.
Trend Line Liquidity Zones: Allows the user to display Trend Line Zones on the chart, select the number of Trend Lines visible, & their colors.
Chart Pattern Liquidity: Allows the user to display Chart Patterns on the chart, select the significance of the pattern detection, & their colors.
Liquidity Grabs: Allows the user to display Liquidity Grabs on the chart.
Imbalance Concepts: Allows the user to select the type of imbalances to display on the chart as well as the styling, mitigation method, & timeframe.
Auto FVG Threshold: Filter out non-significant fair value gaps.
Premium/ Discount Zones: Allows the user to display Premium, Discount , and Equilibrium zones on the chart
Accumulation / Distribution: Allows the user to display accumulation & distribution consolidation zones with an optional Consolidation Zig-Zag setting included.
Highs/Lows MTF: Displays previous highs & lows as levels on the chart for the previous Day, Monday, Week, Month, or quarter (3M).
General Styling: Provides styling options for market structure labels, market structure theme, and dashboard customization.
Any Alert() Function Call Conditions: Allows the user to select multiple conditions to use within 1 alert.
🔶 CONCLUSION
Price action trading is a widely respected method for its simplicity & realistic approach to understanding the market itself. Price Action Concepts™ is an extremely comprehensive product that opens the possibilities for any trader to automatically display useful metrics for trading price action with enhanced details in each. While this script is useful, it's critical to understand that past performance is not necessarily indicative of future results and there are many more factors that go into being a profitable trader.
🔶 HOW TO GET ACCESS
You can see the Author's instructions below to get instant access to this indicator & our premium suite.
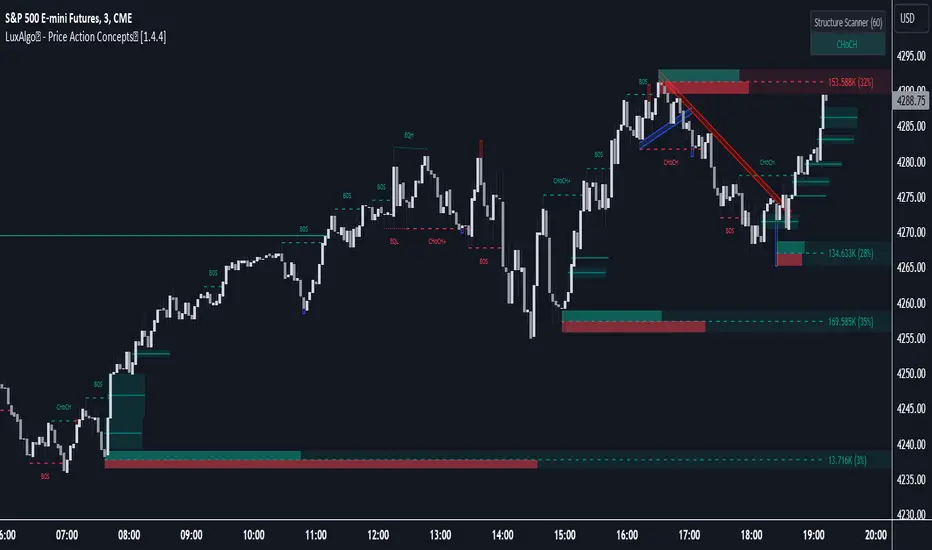
Liquidity Pools Smart Entry + Multi-TF Targets + VWAPOverview
This indicator is designed to help traders identify high-probability institutional-style entries using concepts from ICT (Inner Circle Trader) methodology. It combines liquidity pool detection, fair value gaps (FVG), swing levels, killzones, ATR-based targets, VWAP bias, and optional multi-timeframe analysis.
The script provides visual trade signals and a green-light confirmation system to streamline decision-making and reduce overtrading.
Key Features
Market Structure
Detects CHoCH (Change of Character) and BOS (Break of Structure).
Marks bullish and bearish breaks with labels on the chart.
Liquidity & Swings
Highlights Swing High/Low liquidity zones (SSL/BSL).
Shows horizontal swing lines for reference.
Fair Value Gap (FVG) Detection
Bullish and bearish gaps are plotted as shaded boxes.
Identifies potential institutional entry zones.
Killzones
Highlights London and New York sessions.
Helps align trades with high liquidity periods.
VWAP Filter
Plots the intraday VWAP.
Optional VWAP bias filter ensures trades follow intraday institutional flow.
Multi-Timeframe Confirmation
Supports 5-minute entry confirmation.
Shows SL/TP for both current TF and 5-min TF signals.
ATR-Based Stops & Targets
Entry signals automatically calculate SL (1.5 ATR) and TP (ATR x multiplier).
Customizable ATR multiplier.
Trade Light System
Visual green/red/gray indicators:
🟢 Green: All bullish conditions aligned → LONG allowed.
🔴 Red: All bearish conditions aligned → SHORT allowed.
⚪ Gray: Wait → conditions not aligned.
Inputs
Input Description
Show CHoCH/BOS Toggle structure labels on/off
Show Killzones Toggle session backgrounds on/off
Show Swing Liquidity Show SSL/BSL swing points
Show Horizontal Lines Extend swing lines horizontally
Show FVG Zones Show Fair Value Gaps
Show VWAP Display intraday VWAP
Swing Length Number of bars to calculate swing pivots
ATR Target Multiplier Multiplies ATR for TP calculation
Use HTF 200 EMA Filter Filter entries with higher timeframe trend
Use RSI Filter Filter entries using RSI 14
Use Volume Filter Filter entries with high volume confirmation
Use ATR Filter Filter entries based on ATR expansion
Use VWAP Filter Only allow trades in VWAP direction
How to Read the Chart
Structure Labels
BOS ↑ / BOS ↓: Breaks of structure showing trend direction.
Swing Liquidity
SSL (blue): Bullish swing low liquidity.
BSL (red): Bearish swing high liquidity.
FVG Zones
Green boxes: Potential bullish liquidity gaps.
Red boxes: Potential bearish liquidity gaps.
Killzones
Green background: London session.
Blue background: New York session.
VWAP
Purple line: Intraday volume-weighted average price.
Trade Lights
🟢 Green: All bullish conditions met — LONG ready.
🔴 Red: All bearish conditions met — SHORT ready.
⚪ Gray: Wait — conditions not aligned.
Entry Labels
Shows Entry price, SL, TP.
Separate labels for current TF and 5-min confirmation.
How to Use
Step 1: Identify Market Bias
Check HTF EMA: price above → bullish trend, below → bearish trend.
Check VWAP (if enabled): trade in direction of VWAP for institutional alignment.
Check Killzones: prefer entries during London or New York sessions.
Step 2: Confirm Entry Conditions
Wait for BOS / CHoCH to align with your trend.
Look for FVG zone and SSL/BSL liquidity.
Ensure RSI, ATR, Volume, VWAP filters (if enabled) all confirm.
Green/red Trade Light should be active.
Step 3: Place Trade
Use Entry Label price as reference.
SL: 1.5 ATR away.
TP: ATR x multiplier away.
Optional: check 5-min multi-TF confirmation label for additional confidence.
Step 4: Manage Trade
Follow ATR-based SL/TP.
Move stop to break-even after partial target if desired.
Only take trades when Trade Light is GREEN (LONG) or RED (SHORT).
Best Practices
Combine with volume profile or order block analysis for higher precision.
Avoid trading outside killzones.
Use multi-TF confirmation for safer entries.
Adjust ATR multiplier according to market volatility.

LHAMA MTF Structure & Fibs [LTS]Overview
LHAMA MTF Structure & Fibs is a multi-purpose market structure toolkit that combines current-timeframe structure, higher-timeframe structure, Imbalance/FVG-based order blocks, and automatic Fibonacci retracements into a single chart overlay.
Current-Timeframe Structure
The indicator first maps current-timeframe market structure using swing highs and lows based on a user-defined pivot length (“Time-Horizon”):
Labels swing points as HH , HL , LH , and LL .
Draws BOS (Break of Structure) when price breaks beyond a prior swing.
Optionally identifies CHoCH (Change of Character) when a break occurs against the previous direction.
Lets you choose whether BOS/CHoCH confirmation uses closes or wicks .
Provides options to show/hide swing labels, choose line style (solid/dashed/dotted), and configure bullish/bearish colors.
Higher-Timeframe (HTF) Structure
On top of the local structure, the script builds a higher-timeframe structure map and projects it onto your active chart:
Aggregates price into HTF “bars” (e.g., 4h structure on a 5m chart).
Detects HTF pivots with their own pivot length setting.
Draws HTF BOS/CHoCH lines and labels back on the lower timeframe.
Lets you choose wick vs close confirmation for HTF breaks.
Optional “ pending ” HTF levels: lines extended from the latest HTF swing highs/lows that remain “waiting” until price breaks them.
This is designed to make it easier to see how intraday price is moving relative to the dominant higher-timeframe trend.
Order Blocks (Imbalance/FVG-Based)
The indicator detects simple bullish and bearish order blocks based on fair value gaps and prior sweeps:
Identifies bullish/bearish FVGs together with a sweep of a previous low/high.
Creates colored boxes anchored to an “anchor” candle and extends them forward.
Marks boxes as “broken” when price trades inside or through the opposite side.
Broken blocks can have reduced emphasis (more transparent, dashed border) and can optionally be deleted.
Show Nearest Only mode highlights only the closest active bullish and bearish blocks to reduce chart clutter.
Periodic cleanup removes very old boxes to maintain chart responsiveness.
Automatic Fibonacci Levels
The script can draw up to five customizable Fibonacci retracement levels using the HTF structure logic:
Measures swings using HTF pivots and extremes.
Historical mode : measures between two confirmed pivots in one direction.
Live mode : starts from the last confirmed pivot and tracks the evolving extreme; if price reverses through that pivot, measurement can flip to track the new leg.
Each Fib level has its own on/off toggle, ratio value, and color.
Draws a main swing line plus retracement lines projected slightly into the future.
Key Inputs & Customization
Market Structure (Current TF)
Pivot length (“Time-Horizon”).
BOS confirmation: candle close or wicks.
BOS/CHoCH line style and width.
Swing labels on/off and global label size.
Bullish/bearish colors.
Market Structure (HTF)
HTF timeframe selection.
Separate pivot length for HTF swings.
Close vs wick confirmation for HTF breaks.
HTF swing labels and CHoCH labels on/off.
Pending HTF levels: style, color, and visibility.
Order Block Settings
Bullish/bearish box colors and border width.
Maximum number of boxes to display.
Optional deletion of broken blocks.
“Show Nearest Only” filter to highlight the closest active zones.
Max bars to backscan for the anchor candle.
Cleanup frequency for removing very old boxes.
Fibonacci Settings
Show/hide auto Fibs.
Historical vs Live tracking mode.
Five user-defined ratios with individual toggles and colors.

SMC-Math by Thomas v1📌 SMC-Math by Thomas v1 — Description
SMC-Math by Thomas v1 is a complete Smart Money Concepts toolkit designed for traders who want a clean, mathematical, and structured view of market mechanics.
Rather than relying on abstract concepts or subjective drawings, this indicator focuses on rules-based detection of:
✔ Order Blocks (OB)
✔ Fair Value Gaps (FVG)
✔ Market Structure shifts (BoS / CHoCH)
✔ HTF trend confirmation
✔ Premium / Discount arrays
✔ Equal High & Equal Low Liquidity Zones (no hinting — expiry only)
This version is engineered for stability, clarity, and performance — with fully optimized array management, timestamp-based cleanup, and a clean visual presentation suitable for both discretionary and systematic trading.
📌 Key Features
🔹 1. Order Blocks (Bullish & Bearish)
Auto-detected using fractal swing highs/lows
Optional displacement + high volume filters
Midline display option
HTF trend alignment filter
Smart expiry + broken OB cleanup
Custom opacity, buffer, and extension controls
🔹 2. Fair Value Gaps (FVG)
Bullish and bearish gap detection
HTF confirmation-based dimming
No border for a clean ICT-style visuals
Auto remove when filled
Fully rule-based
🔹 3. Market Structure (BoS / CHoCH)
Based on fractal highs/lows
Automatic labeling (small, unobtrusive)
Direction validated by HTF option
Each structure level plotted with a projected line
Smooth, clean BOS/CHOCH flow
🔹 4. Premium / Discount Zones
Auto-calculated from most recent swing high & swing low
Box shading dynamically updates each bar
Helps identify optimal trade areas (OB → FVG → PD array)
🔹 5. Liquidity Zones (Equal Highs & Equal Lows)
This tool highlights where liquidity is likely resting:
Detects Equal Highs and Equal Lows using your tolerance or max difference
Auto-creates borderless shaded boxes
Adjustable box height and extension
NO hinting logic — the box remains for exactly cleanupDelay bars, then expires
Clean and predictable behavior, ideal for rule-based setups
This is especially useful for:
identifying buy-side and sell-side liquidity pools
anticipating runs on liquidity
targeting sweeps
🔹 6. HTF Status Panel
Shows higher-timeframe trend status on the live bar:
Bullish
Bearish
Or “HTF Not Required”
Useful for aligning entries with larger market flow.
📌 How to Use SMC-Math by Thomas v1
1️⃣ Identifying Direction
Start by reading:
HTF Trend Label
BOS & CHOCH reactions
Bullish: look for HL → HH structure + bullish OBs + bullish FVGs
Bearish: look for LH → LL structure + bearish OBs + bearish FVGs
This creates your directional bias.
2️⃣ Using Order Blocks
An OB is valid when:
It appears in line with structure
HTF alignment supports it (optional toggle)
Price returns after a displacement
OB is not “broken” (indicator handles this visually)
Use OBs as:
Rebalance targets
Entry areas
Stop placement logic
3️⃣ Fair Value Gaps
FVGs appear when price dislocates and leaves inefficiency.
Use them to:
Refine entries inside OBs
Project premium/discount zones
Identify continuation zones
The indicator auto-removes FVGs when filled.
4️⃣ Liquidity Zones
Liquidity zones identify resting orders at equal highs/lows.
This version uses simple expiry logic:
Box is created when EQH/EQL forms
It remains visible for 20 bars (default)
It disappears automatically after expiry
No hint/confirmation triggers deletion
Usage tips:
Expect price to run toward these zones
Use them as targets or continuation markers
Combine with OB/FVG for confluence
5️⃣ Premium / Discount Zones
Use PD arrays to gauge:
Premium = optimal shorting zones
Discount = optimal long zones
Not trade “in the middle” unless a clear BOS or CHoCH happens
📌 Recommended Workflow
HTF Bias → Check the HTF panel
Market Structure → Identify trend continuation or reversal
Liquidity → Mark where price is likely to target
FVG → Identify imbalance zones
OB → Confirm institutional origin points
PD Arrays → Determine optimal trade location
Execute with confluence
📌 Who Is This Indicator For?
✔ Traders using ICT / SMC logic
✔ Traders wanting rule-based, non-subjective markups
✔ Traders who want automated detection without repainting
✔ Anyone who uses OB, FVG, liquidity sweeps, and structure shifts
