LV Stock Valuation by Benjamin Graham's FormulaBenjamin Graham's stock valuation formula for growth companies is based on the principle that a stock is a part of a business, and that by analyzing the fundamentals of any company in the stock market, you should be able to derive its intrinsic value independent from its current stock price. Graham suggests that over the long-term, the stock price of a company and its intrinsic/fair value will converge towards each other until the stock price reflects the true value of the company. Finally, Graham recommends that after estimating the intrinsic value of a stock, investors should always purchase the stock with a "margin of safety," to protect oneself from assumptions and potential errors made in the valuation process.
Graham's stock valuation formula to calculate intrinsic value was originally shown in the 1962 edition of Security Analysis as follows:
V = EPS * (8.5 + 2g)
where:
V = intrinsic value per share (over the next 7-10 years)
EPS = earnings per share (over the trailing twelve months (TTM))
8.5 = price-to-earnings (P/E) base for a no-growth company
g = reasonably expected annual growth rate (over the next 7-10 years)
In 1974, Graham revised this formula, as published in The Intelligent Investor, to include a discount rate (aka required rate of return). This was after he concluded that the greatest contributing to stock values and prices over the past decade had been due to interest rates.
Graham's current stock valuation formula is shown below:
V = (EPS * (8.5 + 2g) * Z) / Y
where:
V = intrinsic value per share (over the next 7-10 years)
EPS = diluted earnings per share (over the trailing twelve months (TTM))
8.5 = price-to-earnings (P/E) base for a no-growth company (you can change it manually)
g = reasonably expected annual growth rate (calculated by 5-Yr EPS CAGR%) (you can change year period)
Z = average yield of XXX Bonds (4.4 is default on Graham's formula)
Y = current yield of XXX Bonds
Current bond yield values (Z and Y) are selected as an example from Turkey. You need to change it according to the country of stocks.
Buy price (BP) = Intrinsic value per share * (1 - Margin of safety %)
Margin of safety = selected 20% (you need to change it to 0, if you don’t want to use margin of safety and to see intrinsic value)
Buy price > Current market price: Consider buying the stock, as the current market price appears to be undervalued.
Buy price < Current market price: Consider selling or not buying the stock, as the current market price appears to be overvalued.
Keep in mind that this buy/sell recommendation is purely based on Graham's stock valuation formula and the current market price, and ignores all other fundamental, news, and market factors investors should examine as well before making an investment decision.
Buy price is calculated for 5 different P/E values in the script.
1. with fixed P/E
2. with current P/E
3. with forward P/E
4. with sector P/E (optional)
5. with index P/E (optional)
You can also do calculations by using different growth rate by selecting that option.
Different type of moving averages is also included in the script as an option.
Buscar en scripts para "A股市场较发行价上涨最多的10个股票"

AI SuperTrend x Pivot Percentile - Strategy [PresentTrading]█ Introduction and How it is Different
The AI SuperTrend x Pivot Percentile strategy is a sophisticated trading approach that integrates AI-driven analysis with traditional technical indicators. Combining the AI SuperTrend with the Pivot Percentile strategy highlights several key advantages:
1. Enhanced Accuracy in Trend Prediction: The AI SuperTrend utilizes K-Nearest Neighbors (KNN) algorithm for trend prediction, improving accuracy by considering historical data patterns. This is complemented by the Pivot Percentile analysis which provides additional context on trend strength.
2. Comprehensive Market Analysis: The integration offers a multi-faceted approach to market analysis, combining AI insights with traditional technical indicators. This dual approach captures a broader range of market dynamics.
BTC 6H L/S Performance
Local
█ Strategy: How it Works - Detailed Explanation
🔶 AI-Enhanced SuperTrend Indicators
1. SuperTrend Calculation:
- The SuperTrend indicator is calculated using a moving average and the Average True Range (ATR). The basic formula is:
- Upper Band = Moving Average + (Multiplier × ATR)
- Lower Band = Moving Average - (Multiplier × ATR)
- The moving average type (SMA, EMA, WMA, RMA, VWMA) and the length of the moving average and ATR are adjustable parameters.
- The direction of the trend is determined based on the position of the closing price in relation to these bands.
2. AI Integration with K-Nearest Neighbors (KNN):
- The KNN algorithm is applied to predict trend direction. It uses historical price data and SuperTrend values to classify the current trend as bullish or bearish.
- The algorithm calculates the 'distance' between the current data point and historical points. The 'k' nearest data points (neighbors) are identified based on this distance.
- A weighted average of these neighbors' trends (bullish or bearish) is calculated to predict the current trend.
For more please check: Multi-TF AI SuperTrend with ADX - Strategy
🔶 Pivot Percentile Analysis
1. Percentile Calculation:
- This involves calculating the percentile ranks for high and low prices over a set of predefined lengths.
- The percentile function is typically defined as:
- Percentile = Value at (P/100) × (N + 1)th position
- Where P is the desired percentile, and N is the number of data points.
2. Trend Strength Evaluation:
- The calculated percentiles for highs and lows are used to determine the strength of bullish and bearish trends.
- For instance, a high percentile rank in the high prices may indicate a strong bullish trend, and vice versa for bearish trends.
For more please check: Pivot Percentile Trend - Strategy
🔶 Strategy Integration
1. Combining SuperTrend and Pivot Percentile:
- The strategy synthesizes the insights from both AI-enhanced SuperTrend and Pivot Percentile analysis.
- It compares the trend direction indicated by the SuperTrend with the strength of the trend as suggested by the Pivot Percentile analysis.
2. Signal Generation:
- A trading signal is generated when both the AI-enhanced SuperTrend and the Pivot Percentile analysis agree on the trend direction.
- For instance, a bullish signal is generated when both the SuperTrend is bullish, and the Pivot Percentile analysis shows strength in bullish trends.
🔶 Risk Management and Filters
- ADX and DMI Filter: The strategy uses the Average Directional Index (ADX) and the Directional Movement Index (DMI) as filters to assess the trend's strength and direction.
- Dynamic Trailing Stop Loss: Based on the SuperTrend indicator, the strategy dynamically adjusts stop-loss levels to manage risk effectively.
This strategy stands out for its ability to combine real-time AI analysis with established technical indicators, offering traders a nuanced and responsive tool for navigating complex market conditions. The equations and algorithms involved are pivotal in accurately identifying market trends and potential trade opportunities.
█ Usage
To effectively use this strategy, traders should:
1. Understand the AI and Pivot Percentile Indicators: A clear grasp of how these indicators work will enable traders to make informed decisions.
2. Interpret the Signals Accurately: The strategy provides bullish, bearish, and neutral signals. Traders should align these signals with their market analysis and trading goals.
3. Monitor Market Conditions: Given that this strategy is sensitive to market dynamics, continuous monitoring is crucial for timely decision-making.
4. Adjust Settings as Needed: Traders should feel free to tweak the input parameters to suit their trading preferences and to respond to changing market conditions.
█Default Settings and Their Impact on Performance
1. Trading Direction (Default: "Both")
Effect: Determines whether the strategy will take long positions, short positions, or both. Adjusting this setting can align the strategy with the trader's market outlook or risk preference.
2. AI Settings (Neighbors: 3, Data Points: 24)
Neighbors: The number of nearest neighbors in the KNN algorithm. A higher number might smooth out noise but could miss subtle, recent changes. A lower number makes the model more sensitive to recent data but may increase noise.
Data Points: Defines the amount of historical data considered. More data points provide a broader context but may dilute recent trends' impact.
3. SuperTrend Settings (Length: 10, Factor: 3.0, MA Source: "WMA")
Length: Affects the sensitivity of the SuperTrend indicator. A longer length results in a smoother, less sensitive indicator, ideal for long-term trends.
Factor: Determines the bandwidth of the SuperTrend. A higher factor creates wider bands, capturing larger price movements but potentially missing short-term signals.
MA Source: The type of moving average used (e.g., WMA - Weighted Moving Average). Different MA types can affect the trend indicator's responsiveness and smoothness.
4. AI Trend Prediction Settings (Price Trend: 10, Prediction Trend: 80)
Price Trend and Prediction Trend Lengths: These settings define the lengths of weighted moving averages for price and SuperTrend, impacting the responsiveness and smoothness of the AI's trend predictions.
5. Pivot Percentile Settings (Length: 10)
Length: Influences the calculation of pivot percentiles. A shorter length makes the percentile more responsive to recent price changes, while a longer length offers a broader view of price trends.
6. ADX and DMI Settings (ADX Length: 14, Time Frame: 'D')
ADX Length: Defines the period for the Average Directional Index calculation. A longer period results in a smoother ADX line.
Time Frame: Sets the time frame for the ADX and DMI calculations, affecting the sensitivity to market changes.
7. Commission, Slippage, and Initial Capital
These settings relate to transaction costs and initial investment, directly impacting net profitability and strategy feasibility.

Turtle Trader StrategyTurtle Trader Strategy :
Introduction :
This strategy is based on the well known « Turtle Trader Strategy », that has proven itself over the years. It sends long and short signals with pyramid orders of up to 5, meaning that the strategy can trigger up to 5 orders in the same direction. Good risk and money management.
It's important to note that the strategy combines 2 systems working together (S1 and S2). Let’s describe the specific features of this strategy.
1/ Position size :
Position size is very important for turtle traders to manage risk properly. This position sizing strategy adapts to market volatility and to account (gains and losses). It’s based on ATR (Average True Range) which can also be called « N ». Its length is per default 20.
ATR(20) = (previous_atr(20)*19 + actual_true_range)/20
The number of units to buy is :
Unit = 1% * account/(ATR(20)*dollar_per_point)
where account is the actual account value and dollar_per_point is the variation in dollar of the asset with a 1 point move.
Depending on your risk aversion, you can increase the percentage of your account, but turtle traders default to 1%. If you trade contracts, units must be rounded down by default.
There is also an additional rule to reduce the risk if the value of the account falls below the initial capital : in this case and only in this case, account in the unit formula must be replace by :
account = actual_account*actual_account/initial capital
2/ Open a position :
2 systems are working together :
System 1 : Entering a new 20 day breakout
System 2 : Entering a new 55 day breakout
A breakout is a new high or new low. If it’s a new high, we open long position and vice versa if it’s a new low we enter in short position.
We add an additional rule :
System 1 : Breakout is ignored if last long/short position was a winner
System 2 : All signals are taken
This additional rule allows the trader to be in the major trends if the system 1 signal has been skipped. If a signal for system 1 has been skipped, and next candle is also a new 20 day breakout, S1 doesn’t give a signal. We have to wait S2 signal or wait for a candle that doesn’t make a new breakout to reactivate S1.
3/ Pyramid orders :
Turtle Strategy allows us to add extra units to the position if the price moves in our favor. I've configured the strategy to allow up to 5 orders to be added in the same direction. So if the price varies from 0.5*ATR(20) , we add units with the position size formula. Note that the value of account will be replaced by "remaining_account", i.e. the cash remaining in our account after subtracting the value of open positions.
4/ Stop Loss :
We set a stop loss at 1.5*ATR(20) below the entry price for longs and above the entry price for shorts. If pyramid units are added, the stop is increased/decreased by 0.5*ATR(20). Note that if SL is configured for a loss of more than 10%, we set the SL to 10% for the first entry order to avoid big losses. This configuration does not work for pyramid orders as SL moves by 0.5*ATR(20).
5/ Exit signals :
System 1 :
Exit long on a 10 day low
Exit short on a 10 day high
System 2 :
Exit long on a 20 day low
Exit short on a 20 day high
6/ What types of orders are placed ?
To enter in a position, stop orders are placed meaning that we place orders that will be automatically triggered by the signal at the exact breakout price. Stop loss and exit signals are also stop orders. Pyramid orders are market orders which will be triggered at the opening of the next candle to avoid repainting.
PARAMETERS :
Risk % of capital : Percentage used in the position size formula. Default is 1%
ATR period : ATR length used to calculate ATR. Default is 20
Stop ATR : Parameters used to fix stop loss. Default is 1.5 meaning that stop loss will be set at : buy_price - 1.5*ATR(20) for long and buy_price + 1.5*ATR(20) for short. Turtle traders default is 2 but 1.5 is better for cryptocurrency as there is a huge volatility.
S1 Long : System 1 breakout length for long. Default is 20
S2 Long : System 2 breakout length for long. Default is 55
S1 Long Exit : System 1 breakout length to exit long. Default is 10
S2 Long Exit : System 2 breakout length to exit long. Default is 20
S1 Short : System 1 breakout length for short. Default is 15
S2 Short : System 2 breakout length for short. Default is 55
S1 Short Exit : System 1 breakout length to exit short. Default is 7
S2 Short Exit : System 2 breakout length to exit short. Default is 20
Initial capital : $1000
Fees : Interactive Broker fees apply to this strategy. They are set at 0.18% of the trade value.
Slippage : 3 ticks or $0.03 per trade. Corresponds to the latency time between the moment the signal is received and the moment the order is executed by the broker.
Pyramiding : Number of orders that can be passed in the same direction. Default is 5.
Important : Turtle traders don't trade crypto. For this specific asset type, I modify some parameters such as SL and Short S1 in order to maximize return while limiting drawdown. This strategy is the most optimal on BINANCE:BTCUSD in 1D timeframe with the parameters set per default. If you want to use this strategy for a different crypto please adapt parameters.
NOTE :
It's important to note that the first entry order (long or short) will be the largest. Subsequent pyramid orders will have fewer units than the first order. We've set a maximum SL for the first order of 10%, meaning that you won't lose more than 10% of the value of your first order. However, it is possible to lose more on your pyramid orders, as the SL is increased/decreased by 0.5*ATR(20), which does not secure a loss of more than 10% on your pyramid orders. The risk remains well managed because the value of these orders is less than the value of the first order. Remain vigilant to this small detail and adjust your risk according to your risk aversion.
Enjoy the strategy and don’t forget to take the trade :)

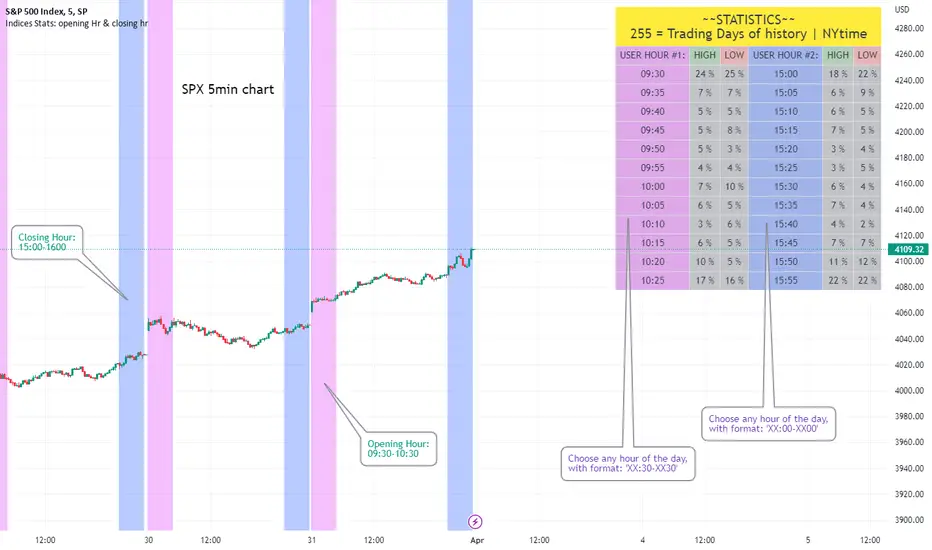
Key Levels | Flux Charts💎 GENERAL OVERVIEW
Introducing our new Key Levels indicator! This indicator allows you to see the key levels on the current chart such as previous day lows / highs, pre-market data, yesterday's close, today's open, pivot points, and much more! It's highly user-friendly with every line being individually customizable and having a wide range of text options.
Features of the new Key Levels indicator :
Today & Yesterday High, Low, Open & Close
Previous 3-10th Day Highs & Lows
Pre-Market Highs & Lows
Previous Month High & Low
High & Low Pivots
Combination Of Same Levels
Wide Customization Options
📌 HOW DOES IT WORK ?
Key levels are important areas in a chart where a significant reaction is expected. In this indicator, you can enable up to the previous 10 days highs and lows, yesterday's close / today's open, and the latest pivot points. Key levels generally act like support & resistance. Here are a few examples :
As shown, key levels play an important role determining the current trend and can be useful in identifying potential levels where the market will reverse or breakout.
🚩UNIQUENESS
1. More Key Levels
We believe that past key levels may be as important as current ones. Some of the key-levels indicators do not include them even though strong reactions can happen around them. Thus, our indicator let's you check up to 10 days backwards.
You can select the ones you think that are the most important and just enable them, making the indicator customizable to your liking.
2. Pre-Market Data
With assets that have pre-market data available, it's crucial to analyze it to have a better understanding of the market in regular trading hours. Our indicator will plot pre-market highs and lows, even if your chart is in the regular trading hours only mode. We believe this will be helpful with your analyzing process.
3. Combination
The indicator can dynamically combine same key levels, so you can have a clear look to the chart without lines & text colliding with each other. This would also help you determine stronger key levels as if a key level occured more than a time, it could be a sign that it's a stronger one. An example :
To summarize, using key levels is an essential skill while detecting zones where strong reactions are expected. This indicator provides up to 10 day's high and low levels, and all of them can be individually turned on / off. Traders that believe older key levels can be important and want to look at the whole picture may use this feature. Also for assets that have pre-market data available, the indicator provides pre-market levels as well. Besides all that, High & Low pivots will provide latest key levels so traders can use them in their decisions.
⚙️SETTINGS
1. General Configuration
You can enable / disable :
1. Today's High / Low / Open
2. Yesterday's High / Low / Close
3. 3th-10th Day High / Low
4. Pre-Market High / Low
5. Previous Month High / Low
You can also change the colors and switch their line styles between solid, dashed and dotted.
2. High & Low Pivots
Enabled -> Enable / Disable High & Low Pivots
Pivot Range -> The range used in the detection of pivot points. Larger values will result in less pivot points, while smaller values will provide more pivot points. This essentially determines how many bars to the right & left shouldn't exceed the pivot's high or low.
You can also change the text color and text size of the pivots from the settings.
3. Style settings
Text Offset -> How many bars of offset should the texts have to the right. Increase if text collides with bars while Align Labels option is set to "Right".
Extend Lines -> If enabled, lines will be extended infinitely to right & left. If disabled, all lines will be clamped in their timelines.
Show Line Values -> If enabled, line information text will contain their price.
Align Labels ->
Right = Align line labels to right.
Center = Line labels will always be at the center of the screen.

Donchian Quest Research// =================================
Trend following strategy.
// =================================
Strategy uses two channels. One channel - for opening trades. Second channel - for closing.
Channel is similar to Donchian channel, but uses Close prices (not High/Low). That helps don't react to wicks of volatile candles (“stop hunting”). In most cases openings occur earlier than in Donchian channel. Closings occur only for real breakout.
// =================================
Strategy waits for beginning of trend - when price breakout of channel. Default length of both channels = 50 candles.
Conditions of trading:
- Open Long: If last Close = max Close for 50 closes.
- Close Long: If last Close = min Close for 50 closes.
- Open Short: If last Close = min Close for 50 closes.
- Close Short: If last Close = max Close for 50 closes.
// =================================
Color of lines:
- black - channel for opening trade.
- red - channel for closing trade.
- yellow - entry price.
- fuchsia - stoploss and breakeven.
- vertical green - go Long.
- vertical red - go Short.
- vertical gray - close in end, don't trade anymore.
// =================================
Order size calculated with ATR and volatility.
You can't trade 1 contract in BTC and 1 contract in XRP - for example. They have different price and volatility, so 1 contract BTC not equal 1 contract XRP.
Script uses universal calculation for every market. It is based on:
- Risk - USD sum you ready to loss in one trade. It calculated as percent of Equity.
- ATR indicator - measurement of volatility.
With default setting your stoploss = 0.5 percent of equity:
- If initial capital is 1000 USD and used parameter "Permit stop" - loss will be 5 USD (0.5 % of equity).
- If your Equity rises to 2000 USD and used parameter "Permit stop"- loss will be 10 USD (0.5 % of Equity).
// =================================
This Risk works only if you enable “Permit stop” parameter in Settings.
If this parameter disabled - strategy works as reversal strategy:
⁃ If close Long - channel border works as stoploss and momentarily go Short.
⁃ If close Short - channel border works as stoploss and momentarily go Long.
Channel borders changed dynamically. So sometime your loss will be greater than ‘Risk %’. Sometime - less than ‘Risk %’.
If this parameter enabled - maximum loss always equal to 'Risk %'. This parameter also include breakeven: if profit % = Risk %, then move stoploss to entry price.
// =================================
Like all trend following strategies - it works only in trend conditions. If no trend - slowly bleeding. There is no special additional indicator to filter trend/notrend. You need to trade every signal of strategy.
Strategy gives many losses:
⁃ 30 % of trades will close with profit.
⁃ 70 % of trades will close with loss.
⁃ But profit from 30% will be much greater than loss from 70 %.
Your task - patiently wait for it and don't use risky setting for position sizing.
// =================================
Recommended timeframe - Daily.
// =================================
Trend can vary in lengths. Selecting length of channels determine which trend you will be hunting:
⁃ 20/10 - from several days to several weeks.
⁃ 20/20 or 50/20 - from several weeks to several months.
⁃ 50/50 or 100/50 or 100/100 - from several months to several years.
// =================================
Inputs (Settings):
- Length: length of channel for trade opening/closing. You can choose 20/10, 20/20, 50/20, 50/50, 100/50, 100/100. Default value: 50/50.
- Permit Long / Permit short: Longs are most profitable for this strategy. You can disable Shorts and enable Longs only. Default value: permit all directions.
- Risk % of Equity: for position sizing used Equity percent. Don't use values greater than 5 % - it's risky. Default value: 0.5%.
⁃ ATR multiplier: this multiplier moves stoploss up or down. Big multiplier = small size of order, small profit, stoploss far from entry, low chance of stoploss. Small multiplier = big size of order, big profit, stop near entry, high chance of stoploss. Default value: 2.
- ATR length: number of candles to calculate ATR indicator. It used for order size and stoploss. Default value: 20.
- Close in end - to close active trade in the end (and don't trade anymore) or leave it open. You can see difference in Strategy Tester. Default value: don’t close.
- Permit stop: use stop or go reversal. Default value: without stop, reversal strategy.
// =================================
Properties (Settings):
- Initial capital - 1000 USD.
- Script don't uses 'Order size' - you need to change 'Risk %' in Inputs instead.
- Script don't uses 'Pyramiding'.
- 'Commission' 0.055 % and 'Slippage' 0 - this parameters are for crypto exchanges with perpetual contracts (for example Bybit). If use on other markets - set it accordingly to your exchange parameters.
// =================================
Big dataset used for chart - 'BITCOIN ALL TIME HISTORY INDEX'. It gives enough trades to understand logic of script. It have several good trends.
// =================================

Targets For Many Indicators [LuxAlgo]The Targets For Many Indicators is a useful utility tool able to display targets for many built-in indicators as well as external indicators. Targets can be set for specific user-set conditions between two series of values, with the script being able to display targets for two different user-set conditions.
Alerts are included for the occurrence of a new target as well as for reached targets.
🔶 USAGE
Targets can help users determine the price limit where the price might start deviating from an indication given by one or multiple indicators. In the context of trading, targets can help secure profits/reduce losses of a trade, as such this tool can be useful to evaluate/determine user take profits/stop losses.
Due to these essentially being horizontal levels, they can also serve as potential support/resistances, with breakouts potentially confirming new trends.
In the above example, we set targets 3 ATR's away from the closing price when the price crosses over the script built-in SuperTrend indicator using ATR period 10 and factor 3. Using "Long Position Target" allows setting a target above the price, disabling this setting will place targets below the price.
Users might be interested in obtaining new targets once one is reached, this can be done by enabling "New Target When Reached" in the target logic setting section, resulting in more frequent targets.
Lastly, users can restrict new target creation until current ones are reached. This can result in fewer and longer-term targets, with a higher reach rate.
🔹 Dashboard
A dashboard is displayed on the top right of the chart, displaying the amount, reach rate of targets 1/2, and total amount.
This dashboard can be useful to evaluate the selected target distances relative to the selected conditions, with a higher reach rate suggesting the distance of the targets from the price allows them to be reached.
🔶 DETAILS
🔹 Indicators
Besides 'External' sources, each source can be set at 1 of the following Build-In Indicators :
ACCDIST : Accumulation/distribution index
ATR : Average True Range
BB (Middle, Upper or Lower): Bollinger Bands
CCI : Commodity Channel Index
CMO : Chande Momentum Oscillator
COG : Center Of Gravity
DC (High, Mid or Low): Donchian Channels
DEMA : Double Exponential Moving Average
EMA : Exponentially weighted Moving Average
HMA : Hull Moving Average
III : Intraday Intensity Index
KC (Middle, Upper or Lower): Keltner Channels
LINREG : Linear regression curve
MACD (macd, signal or histogram): Moving Average Convergence/Divergence
MEDIAN : median of the series
MFI : Money Flow Index
MODE : the mode of the series
MOM : Momentum
NVI : Negative Volume Index
OBV : On Balance Volume
PVI : Positive Volume Index
PVT : Price-Volume Trend
RMA : Relative Moving Average
ROC : Rate Of Change
RSI : Relative Strength Index
SMA : Simple Moving Average
STOCH : Stochastic
Supertrend
TEMA : Triple EMA or Triple Exponential Moving Average
VWAP : Volume Weighted Average Price
VWMA : Volume-Weighted Moving Average
WAD : Williams Accumulation/Distribution
WMA : Weighted Moving Average
WVAD : Williams Variable Accumulation/Distribution
%R : Williams %R
Each indicator is provided with a link to the Reference Manual or to the Build-In Indicators page.
The latter contains more information about each indicator.
Note that when "Show Source Values" is enabled, only values that can be logically found around the price will be shown. For example, Supertrend , SMA , EMA , BB , ... will be made visible. Values like RSI , OBV , %R , ... will not be visible since they will deviate too much from the price.
🔹 Interaction with settings
This publication contains input fields, where you can enter the necessary inputs per indicator.
Some indicators need only 1 value, others 2 or 3.
When several input values are needed, you need to separate them with a comma.
You can use 0 to 4 spaces between without a problem. Even an extra comma doesn't give issues.
The red colored help text will guide you further along (Only when Target is enabled)
Some examples that work without issues:
Some examples that work with issues:
As mentioned, the errors won't be visible when the concerning target is disabled
🔶 SETTINGS
Show Target Labels: Display target labels on the chart.
Candle Coloring: Apply candle coloring based on the most recent active target.
Target 1 and Target 2 use the same settings below:
Enable Target: Display the targets on the chart.
Long Position Target: Display targets above the price a user selected condition is true. If disabled will display the targets below the price.
New Target Condition: Conditional operator used to compare "Source A" and "Source B", options include CrossOver, CrossUnder, Cross, and Equal.
🔹 Sources
Source A: Source A input series, can be an indicator or external source.
External: External source if 'External" is selected in "Source A".
Settings: Settings of the selected indicator in "Source A", entered settings of indicators requiring multiple ones must be comma separated, for example, "10, 3".
Source B: Source B input series, can be an indicator or external source.
External: External source if 'External" is selected in "Source B".
Settings: Settings of the selected indicator in "Source B", entered settings of indicators requiring multiple ones must be comma separated, for example, "10, 3".
Source B Value: User-defined numerical value if "value" is selected in "Source B".
Show Source Values: Display "Source A" and "Source B" on the chart.
🔹 Logic
Wait Until Reached: When enabled will not create a new target until an existing one is reached.
New Target When Reached: Will create a new target when an existing one is reached.
Evaluate Wicks: Will use high/low prices to determine if a target is reached. Unselecting this setting will use the closing price.
Target Distance From Price: Controls the distance of a target from the price. Can be determined in currencies/points, percentages, ATR multiples, ticks, or using multiple of external values.
External Distance Value: External distance value when "External Value" is selected in "Target Distance From Price".

10x Bull Vs. Bear VP Intraday Sessions [Kioseff Trading]Hello!
This script "10x Bull Vs. Bear VP Intraday Sessions" lets the user configure up to 10 session ranges for Bull Vs. Bear volume profiles!
Features
Up To 10 Fixed Ranges!
Volume Profile Anchored to Fixed Range
Delta Ladder Anchored to Range
Bull vs Bear Profiles!
Standard Poc and Value Area Lines, in Addition to Separated POCs and Value Area Lines for Bull Profiles and Bear Profiles
Configurable Value Area Target
Up to 2000 Profile Rows per Visible Range
Stylistic Options for Profiles
This script generates Bull vs. Bear volume profiles for up to 10 fixed ranges!
Up to 2000 volume profile levels (price levels) Can be calculated for each profile, thanks to the new polyline feature, allowing for less aggregation / more precision of volume at price and volume delta.
Bull vs Bear Profiles
The image above shows primary functionality!
Green profiles = buying volume
Red profiles = selling volume
All colors are configurable.
Bullish & bearish POC + value areas for each fixed range are displayable!
That’s about it :D
This indicator is part of a series titled “Bull vs. Bear”.
If you have any suggestions please feel free to share!

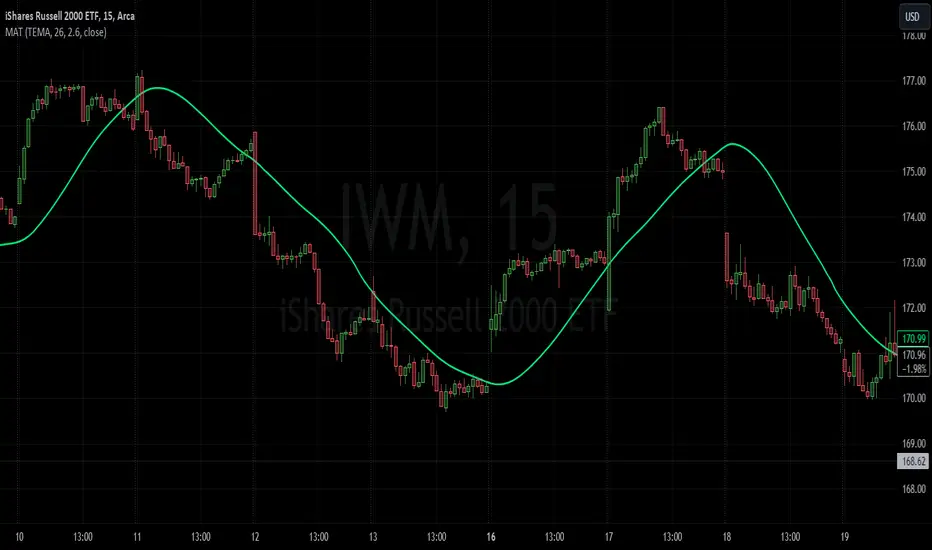
Moving Average TransformThe MAT is essentially a different kind of smoothed moving average. It is made to filter out data sets that deviate from the specified absolute threshold and the result becomes a smoothing function. The goal here, inspired by time series analysis within mathematical study, is to eliminate data anomalies and generate a more accurate trendline.
Functionality:
This script calculates a filtered average by:
Determining the mean of the entire data series.
Initializing sum and count variables.
Iterating through the data to filter values that deviate from the mean beyond the threshold.
Calculating a filtered mean based on the filtered data.
The filtered mean is then passed through a moving average function, where various types of moving averages like SMA, EMA, DEMA, TEMA, and ALMA can be applied. Some popular averages such as the HMA were omitted due to their heavy dependency on weighing specific data points.
Some information from "Time Series Analysis" regarding deviations
Definition of Anomaly: An anomaly or outlier is a data point that differs significantly from other observations in the dataset. It can be caused by various reasons such as measurement errors, data entry errors, or genuine extreme observations.
Impact on Mean: The mean (or average) of a dataset is calculated by summing all the values and dividing by the number of values. Since the mean is sensitive to extreme values, even a single outlier can significantly skew the mean.
Example: Consider a simple time series dataset: . The value "150" is an anomaly in this context. If we calculate the mean with this outlier, it is (10 + 12 + 11 + 9 + 150) / 5 = 38.4. However, if we exclude the outlier, the mean becomes (10 + 12 + 11 + 9) / 4 = 10.5. The presence of the outlier has substantially increased the mean.
Accuracy and Representativeness: While the mean calculated without outliers might be more "accurate" in the sense of being more representative of the central tendency of the bulk of the data, it's essential to note that anomalies might convey important information about the system being studied. Blindly removing or ignoring them might lead to overlooking significant events or phenomena.
Approaches to Handle Anomalies?
Detection and Removal
Robust Statistics
Transformation
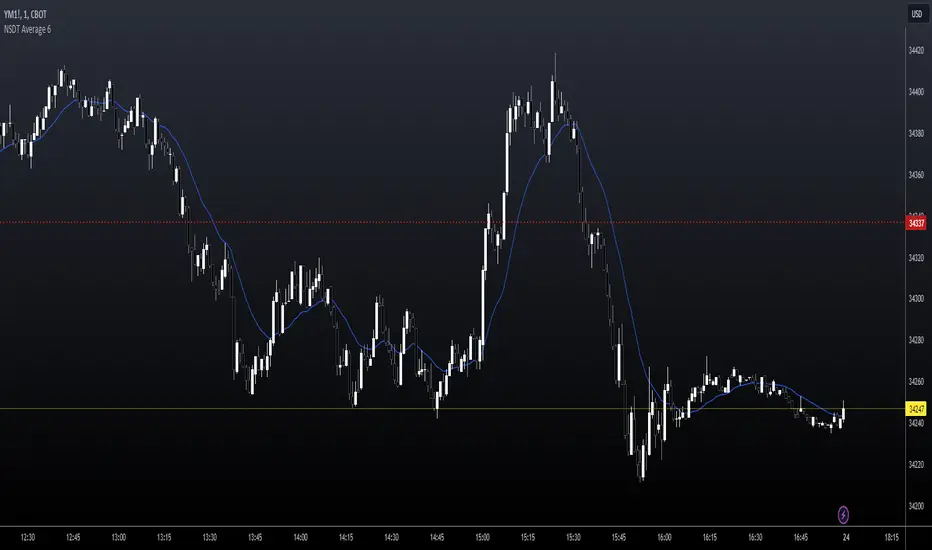
NSDT Average 6This is a pretty simple concept that we were asked to put together. It uses 6 Moving Averages, and takes the average of each one, then averages them all together.
If you don't want to use 6, and only 3 for example, then just enter the same length in two of the input fields as pairs.
Example:
For 6, you could use 10, 20, 30, 40, 50, 60
For 3, you could use 10, 10, 50, 50, 100, 100
It doesn't ploy 6 MA's, it only plots one - the result of the average of an average of an average, etc..
Publishing open source so other can modify as needed.
MarketSmith VolumesThe 'MarketSmith Volumes' is to be used with the 'MarketSmith Indicator' and 'EPS & Sales' in order to mimic fully MarketSmith Graphs with the maximum number of indicators allowed by a free Tradingview Plan: 3
This indicator is no more than a simple volume indicator where all parameters are already adjusted to resemble MarketSmith graphical volumes.
Also you will find integrated:
High Volumes Bars Peak :
They allow us to see peak volumes at a glance.
10-Week Average Volume :
When viewing a weekly chart, this line represents a 10-week moving average volume level. It allows you to see if the current Volume Bar of the week is above or under the average volume traded in the past 10 Weeks.
50-Day Average Volume :
When viewing a daily chart, this line represents a 50-day moving average volume level. Whether or not volume is above or below the average for a certain period could have a significant impact on your stock chart analysis.

Ticker Correlation Matrix Table and Heatmap [SS]Hello everyone,
I am in the process of releasing some of my own utility indicators/things I use to reference and perform analyses.
I do a lot of quantitative/math based analyses, including correlation assessments that I traditionally would need to export data from Tradingview and perform in SPSS, Excel or R. I have been slowly building a repertoire of Excel/R functionality right on pinescript so I do not need to constantly export data and can perform the assessments right on Tradingview.
This is an example of such an indicator.
About the Indicator:
It is a correlation table/matrix indicator. It will allow up to 10 ticker inputs, which can be stocks, economic data, anything available on Tradingview, and it will perform a correlation assessment in a matrix / heatmap style.
The indicator will show the various correlations among all of the selected ticker inputs and will colour them based on correlation strength and type.
Strong negative correlations will appear bright red.
Strong positive correlations will appear bright green.
Complete absence of correlation (i.e. 0) will show bright orange.
The rest will show a darker shade to indicate less strength/correlation.
Calculation Functions
In addition to outputting a correlation matrix, the indicator is also able to express the relationship between tickers in a linear expression using the y = mx + b formula.
If we look at table, we can see that MSFT and AAPL have a significantly strong correlation of 0.82.
If we wanted to express this relationship mathmatically, we can ask the indicator to represent the linear relationship in our y = mx + b format. We simply toggle to our menu and select the Convert From MSFT (Ticker 2) and convert to APPL (Ticker 3):
When we select this, a new table will populate below and give you the expression as well as the amount of error associated with it:
In this case, we can see that the equation is y = 0.553x + 0.626 with a range of around 10 points in either direction.
This means that, to convert MSFT to AAPL, we would multiply the MSFT price by 0.553 and then add 0.626. So if we try it, MSFT closed at 328.41. So we substitute:
AAPL price = 0.553(328.41) + 0.626
AAPL price = 181.61 + 0.626
AAPL Price = 182.24 +/- 10
AAPL actually closed at 184.12. So pretty good. If we try another, let's do SPY to XLF:
So we substitute, SPY closed at 449.16.
XLF Price = 449.16(0.077) + 0.084
XLF price = 34.59 + 0.084
XLF price = 34.67
XLF actually closed at 34.49.
This is handy if you want to see how one stock price may affect another. If you are long on one stock and short on another, you can use this to determine what the likely outcome may be for the alternative stock. However, I recommend only performing this on tickers that have a relationship of 0.7 or higher, or a relationship of -0.7 or lower.
I always had to use SPSS to do this, so being able to do this right in Pinescript for me is a huge convenience!
Some other uses:
As I tend to post educational stuff on Tradingview and I frequently use correlation matrices, I have formatted the indicator to be more aesthetically pleasing for these purposes. Thus, you can unselect extra ticker slots that you do not need. IF I only need to display 3 tickers, I can unselect tickers 4 - 10. The end result is a cleaner table:
Essential Functions:
The assessment length is defaulted to 75 candles on the daily timeframe. Be sure to have the daily timeframe opened when you are viewing the indicator.
You can increase or decrease the assessment length as you desire.
You can also specify the source. The source is defaulted to close, but if you want to see the direct correlation of ticker's highs and/or lows, you can modify the source input in the settings menu to look at this.
Just remember to have the chart opened to whatever timeframe you are looking at.
And that's the indicator! Hopefully you find it helpful. Its more of an academic indicator, but it is performing a function that I personally use frequently in analyses, so I hope you may also benefit from it as well!
Thanks for checking it out! Safe trades everyone!

Average Range LinesThis Average Range Lines indicator identifies high and low price levels based on a chosen time period (day, week, month, etc.) and then uses a simple moving average over the length of the lookback period chosen to project support and resistance levels, otherwise referred to as average range. The calculation of these levels are slightly different than Average True Range and I have found this to be more accurate for intraday price bounces.
Lines are plotted and labeled on the chart based on the following methodology:
+3.0: 3x the average high over the chosen timeframe and lookback period.
+2.5: 2.5x the average high over the chosen timeframe and lookback period.
+2.0: 2x the average high over the chosen timeframe and lookback period.
+1.5: 1.5x the average high over the chosen timeframe and lookback period.
+1.0: The average high over the chosen timeframe and lookback period.
+0.5: One-half the average high over the chosen timeframe and lookback period.
Open: Opening price for the chosen time period.
-0.5: One-half the average low over the chosen timeframe and lookback period.
-1.0: The average low over the chosen timeframe and lookback period.
-1.5: 1.5x the average low over the chosen timeframe and lookback period.
-2.0: 2x the average low over the chosen timeframe and lookback period.
-2.5: 2.5x the average low over the chosen timeframe and lookback period.
-3.0: 3x the average low over the chosen timeframe and lookback period.
Look for price to find support or resistance at these levels for either entries or to take profit. When price crosses the +/- 2.0 or beyond, the likelihood of a reversal is very high, especially if set to weekly and monthly levels.
This indicator can be used/viewed on any timeframe. For intraday trading and viewing on a 15 minute or less timeframe, I recommend using the 4 hour, 1 day, and/or 1 week levels. For swing trading and viewing on a 30 minute or higher timeframe, I recommend using the 1 week, 1 month, or longer timeframes. I don’t believe this would be useful on a 1 hour or less timeframe, but let me know if the comments if you find otherwise.
Based on my testing, recommended lookback periods by timeframe include:
Timeframe: 4 hour; Lookback period: 60 (recommend viewing on a 5 minute or less timeframe)
Timeframe: 1 day; Lookback period: 10 (also check out 25 if your chart doesn’t show good support/resistance at 10 days lookback – I have found 25 to be useful on charts like SPX)
Timeframe: 1 week; Lookback period: 14
Timeframe: 1 month; Lookback period: 10
The line style and colors are all editable. You can apply a global coloring scheme in the event you want to add this indicator to your chart multiple times with different time frames like I do for the weekly and monthly.
I appreciate your comments/feedback on this indicator to improve. Also let me know if you find this useful, and what settings/ticker you find it works best with!
Also check out my profile for more indicators!

ICT Silver Bullet [LuxAlgo]The ICT Silver Bullet indicator is inspired from the lectures of "The Inner Circle Trader" (ICT) and highlights the Silver Bullet (SB) window which is a specific 1-hour interval where a Fair Value Gap (FVG) pattern can be formed.
When a FVG is formed during the Silver Bullet window, Support & Resistance lines will be drawn at the end of the SB session.
There are 3 different Silver Bullet windows (New York local time):
The London Open Silver Bullet (3 AM — 4 AM ~ 03:00 — 04:00)
The AM Session Silver Bullet (10 AM — 11 AM ~ 10:00 — 11:00)
The PM Session Silver Bullet (2 PM — 3 PM ~ 14:00 — 15:00)
🔶 USAGE
The ICT Silver Bullet indicator aims to provide users a comprehensive display as similar as possible to how anyone would manually draw the concept on their charts.
It's important to use anything below the 15-minute timeframe to ensure proper setups can display. In this section, we are purely using the 3-minute timeframe.
In the image below, we can see a bullish setup whereas a FVG was successfully retested during the Silver Bullet session. This was then followed by a move upwards to liquidity as our target.
Alternatively, you can also see below a bearish setup utilizing the ICT Silver Bullet indicator outlined.
At this moment, the indicator has removed all other FVGs within the Silver Bullet session & has confirmed this FVG as the retested one.
There is also a support level marked below to be used as a liquidity target as per the ICT Silver Bullet concept suggests.
In the below chart we can see 4 separate consecutive examples of bullish & bearish setups on the 3-minute chart.
🔶 CONCEPTS
This technique can visualize potential support/resistance lines, which can be used as targets.
The script contains 2 main components:
• forming of a Fair Value Gap (FVG)
• drawing support/resistance (S/R) lines
🔹 Forming of FVG
1 basic principle: when a FVG at the end of the SB session is not retraced, it will be made invisible.
Dependable on the settings, different FVG's will be shown.
• 'All FVG': all FVG's are shown, regardless the trend
• 'Only FVG's in the same direction of trend': Only FVG's are shown that are similar to the trend at that moment (trend can be visualized by enabling ' Show ' -> ' Trend ')
-> only bearish FVG when the trend is bearish vs. bullish FVG when trend is bullish
• 'strict': Besides being similar to the trend, only FVG's are shown when the closing price at the end of the SB session is:
– below the top of the FVG box (bearish FVG)
– above bottom of the FVG box (bullish FVG)
• 'super-strict': Besides being similar to the trend, only FVG's are shown when the FVG box is NOT broken
in the opposite direction AND the closing price at the end of the SB session is:
– below bottom of the FVG box (bearish FVG)
– above the top of the FVG box (bullish FVG)
' Super-Strict ' mode resembles ICT lectures the most.
🔹 Drawing support/resistance lines
When the SB session has ended, the script draws potential support/resistance lines, again, dependable on the settings.
• Previous session (any): S/R lines are fetched between current and previous session.
For example, when current session is ' AM SB Session (10 AM — 11 AM) ', then previous session is
' London Open SB (3 AM — 4 AM) ', S/R lines between these 2 sessions alone will be included.
• Previous session (similar): S/R lines are fetched between current and previous - similar - session.
For example, when current session is ' London Open SB (3 AM — 4 AM)' , only S/R lines between
current session and previous ' London Open SB (3 AM — 4 AM) ' session are included.
When a new session starts, S/R lines will be removed, except when enabling ' Keep lines (only in strict mode) '
This is not possible in ' All FVG ' or ' Only FVG's in the same direction of trend ' mode, since the chart would be cluttered.
Note that in ' All FVG ' or ' Only FVG's in the same direction of trend ' mode, both, Support/Resistance lines will be shown,
while in Strict/Super-Strict mode:
• only Support lines will be shown if a bearish FVG appears
• only Resistance lines if a bullish FVG is shown
The lines will still be drawn the the end of the SB session, when a valid FVG appears,
but the S/R lines will remain visible and keep being updated until price reaches that line.
This publication contains a "Minimum Trade Framework (mTFW)", which represents the best-case expected price delivery, this is not your actual trade entry - exit range.
• 40 ticks for index futures or indices
• 15 pips for Forex pairs.
When on ' Strict/Super-Strict ' mode, only S/R lines will be shown which are:
• higher than the lowest FVG bottom + mTFW, in a bullish scenario
• lower than the highest FVG bottom - mTFW, in a bearish scenario
When on ' All FVG/Only FVG's in the same direction of trend ' mode, or on non-Forex/Futures/Indices symbols, S/R needs to be higher/lower than SB session high/low.
🔶 SETTINGS
(Check CONCEPTS for deeper insights and explanation)
🔹 Swing settings (left): Sets the length, which will set the lookback period/sensitivity of the Zigzag patterns (which directs the trend)
🔹 Silver Bullet Session; Show SB session: show lines and labels of SB session
Labels can be disabled separately in the ' Style ' section, color is set at the ' Inputs ' section.
🔹 FVG
– Mode
• All FVG
• Only FVG's in the same direction of trend
• Strict
• Super-Strict
– Colors
– Extend: extend till last bar of SB session
🔹 Targets – support/resistance lines
– Previous session (any): S/R lines fetched between current and previous SB session
– Previous session (similar): S/R lines fetched between current and previous similar SB session
– Colors
– Keep lines (only in strict mode)
🔹 Show
– MSS ~ Session: Show Market Structure Shift , only when this happens during a SB session
– Trend: Show trend (Zigzag, colored ~ trend)

ATR GOD Strategy by TradeSmart (PineConnector-compatible)This is a highly-customizable trading strategy made by TradeSmart, focusing mainly on ATR-based indicators and filters. The strategy is mainly intended for trading forex , and has been optimized using the Deep Backtest feature on the 2018.01.01 - 2023.06.01 interval on the EUR/USD (FXCM) 15M chart, with a Slippage value of 3, and a Commission set to 0.00004 USD per contract. The strategy is also made compatible with PineConnector , to provide an easy option to automate the strategy using a connection to MetaTrader. See tooltips for details on how to set up the bot, and check out our website for a detailed guide with images on how to automate the strategy.
The strategy was implemented using the following logic:
Entry strategy:
A total of 4 Supertrend values can be used to determine the entry logic. There is option to set up all 4 Supertrend parameters individually, as well as their potential to be used as an entry signal/or a trend filter. Long/Short entry signals will be determined based on the selected potential Supertrend entry signals, and filtered based on them being in an uptrend/downtrend (also available for setup). Please use the provided tooltips for each setup to see every detail.
Exit strategy:
4 different types of Stop Losses are available: ATR-based/Candle Low/High Based/Percentage Based/Pip Based. Additionally, Force exiting can also be applied, where there is option to set up 4 custom sessions, and exits will happen after the session has closed.
Parameters of every indicator used in the strategy can be tuned in the strategy settings as follows:
Plot settings:
Plot Signals: true by default, Show all Long and Short signals on the signal candle
Plot SL/TP lines: false by default, Checking this option will result in the TP and SL lines to be plotted on the chart.
Supertrend 1-4:
All the parameters of the Supertrends can be set up here, as well as their individual role in the entry logic.
Exit Strategy:
ATR Based Stop Loss: true by default
ATR Length (of the SL): 100 by default
ATR Smoothing (of the SL): RMA/SMMA by default
Candle Low/High Based Stop Loss: false by default, recent lowest or highest point (depending on long/short position) will be used to calculate stop loss value. Set 'Base Risk Multiplier' to 1 if you would like to use the calculated value as is. Setting it to a different value will count as an additional multiplier.
Candle Lookback (of the SL): 50 by default
Percentage Based Stop Loss: false by default, Set the stop loss to current price - % of current price (long) or price + % of current price (short).
Percentage (of the SL): 0.3 by default
Pip Based Stop Loss: Set the stop loss to current price - x pips (long) or price + x pips (short). Set 'Base Risk Multiplier' to 1 if you would like to use the calculated value as is. Setting it to a different value will count as an additional multiplier.
Pip (of the SL): 10 by default
Base Risk Multiplier: 4.5 by default, the stop loss will be placed at this risk level (meaning in case of ATR SL that the ATR value will be multiplied by this factor and the SL will be placed that value away from the entry level)
Risk to Reward Ratio: 1.5 by default, the take profit level will be placed such as this Risk/Reward ratio is met
Force Exiting:
4 total Force exit on custom session close options: none applied by default. If enabled, trades will close automatically after the set session is closed (on next candle's open).
Base Setups:
Allow Long Entries: true by default
Allow Short Entries: true by default
Order Size: 10 by default
Order Type: Capital Percentage by default, allows adjustment on how the position size is calculated: Cash: only the set cash amount will be used for each trade Contract(s): the adjusted number of contracts will be used for each trade Capital Percentage: a % of the current available capital will be used for each trade
ATR Limiter:
Use ATR Limiter: true by default, Only enter into any position (long/short) if ATR value is higher than the Low Boundary and lower than the High Boundary.
ATR Limiter Length: 50 by default
ATR Limiter Smoothing: RMA/SMMA by default
High Boundary: 1000 by default
Low Boundary: 0.0003 by default
MA based calculation: ATR value under MA by default, If not Unspecified, an MA is calculated with the ATR value as source. Only enter into position (long/short) if ATR value is higher/lower than the MA.
MA Type: RMA/SMMA by default
MA Length: 400 by default
Waddah Attar Filter:
Explosion/Deadzone relation: Not specified by default, Explosion over Deadzone: trades will only happen if the explosion line is over the deadzone line; Explosion under Deadzone: trades will only happen if the explosion line is under the deadzone line; Not specified: the opening of trades will not be based on the relation between the explosion and deadzone lines.
Limit trades based on trends: Not specified by default, Strong Trends: only enter long if the WA bar is colored green (there is an uptrend and the current bar is higher then the previous); only enter short if the WA bar is colored red (there is a downtrend and the current bar is higher then the previous); Soft Trends: only enter long if the WA bar is colored lime (there is an uptrend and the current bar is lower then the previous); only enter short if the WA bar is colored orange (there is a downtrend and the current bar is lower then the previous); All Trends: only enter long if the WA bar is colored green or lime (there is an uptrend); only enter short if the WA bar is colored red or orange (there is a downtrend); Not specified: the color of the WA bar (trend) is not relevant when considering entries.
WA bar value: Not specified by default, Over Explosion and Deadzone: only enter trades when the WA bar value is over the Explosion and Deadzone lines; Not specified: the relation between the explosion/deadzone lines to the value of the WA bar will not be used to filter opening trades.
Sensitivity: 150 by default
Fast MA Type: SMA by default
Fast MA Length: 10 by default
Slow MA Type: SMA
Slow MA Length: 20 by default
Channel MA Type: EMA by default
BB Channel Length: 20 by default
BB Stdev Multiplier: 2 by default
Trend Filter:
Use long trend filter 1: false by default, Only enter long if price is above Long MA.
Show long trend filter 1: false by default, Plot the selected MA on the chart.
TF1 - MA Type: EMA by default
TF1 - MA Length: 120 by default
TF1 - MA Source: close by default
Use short trend filter 1: false by default, Only enter long if price is above Long MA.
Show short trend filter 1: false by default, Plot the selected MA on the chart.
TF2 - MA Type: EMA by default
TF2 - MA Length: 120 by default
TF2 - MA Source: close by default
Volume Filter:
Only enter trades where volume is higher then the volume-based MA: true by default, a set type of MA will be calculated with the volume as source, and set length
MA Type: RMA/SMMA by default
MA Length: 200 by default
Date Range Limiter:
Limit Between Dates: false by default
Start Date: Jan 01 2023 00:00:00 by default
End Date: Jun 24 2023 00:00:00 by default
Session Limiter:
Show session plots: false by default, show market sessions on chart: Sidney (red), Tokyo (orange), London (yellow), New York (green)
Use session limiter: false by default, if enabled, trades will only happen in the ticked sessions below.
Sidney session: false by default, session between: 15:00 - 00:00 (EST)
Tokyo session: false by default, session between: 19:00 - 04:00 (EST)
London session: false by default, session between: 03:00 - 11:00 (EST)
New York session: false by default, session between: 08:00 - 17:00 (EST)
Trading Time:
Limit Trading Time: true by default, tick this together with the options below to enable limiting based on day and time
Valid Trading Days Global: 123567 by default, if the Limit Trading Time is on, trades will only happen on days that are present in this field. If any of the not global Valid Trading Days is used, this field will be neglected. Values represent days: Sunday (1), Monday (2), ..., Friday (6), Saturday(7) To trade on all days use: 123457
(1) Valid Trading Days: false, 123456 by default, values represent days: Sunday (1), Monday (2), ..., Friday (6), Saturday(7) The script will trade on days that are present in this field. Please make sure that this field and also (1) Valid Trading Hours Between is checked
(1) Valid Trading Hours Between: false, 1800-2000 by default, hours between which the trades can happen. The time is always in the exchange's timezone
All other options are also disabled by default
PineConnector Automation:
Use PineConnector Automation: false by default, In order for the connection to MetaTrader to work, you will need do perform prerequisite steps, you can follow our full guide at our website, or refer to the official PineConnector Documentation. To set up PineConnector Automation on the TradingView side, you will need to do the following:
1. Fill out the License ID field with your PineConnector License ID;
2. Fill out the Risk (trading volume) with the desired volume to be traded in each trade (the meaning of this value depends on the EA settings in Metatrader. Follow the detailed guide for additional information);
3. After filling out the fields, you need to enable the 'Use PineConnector Automation' option (check the box in the strategy settings);
4. Check if the chart has updated and you can see the appropriate order comments on your chart;
5. Create an alert with the strategy selected as Condition, and the Message as {{strategy.order.comment}} (should be there by default);
6. Enable the Webhook URL in the Notifications section, set it as the official PineConnector webhook address and enjoy your connection with MetaTrader.
License ID: 60123456789 by default
Risk (trading volume): 1 by default
NOTE! Fine-tuning/re-optimization is highly recommended when using other asset/timeframe combinations.

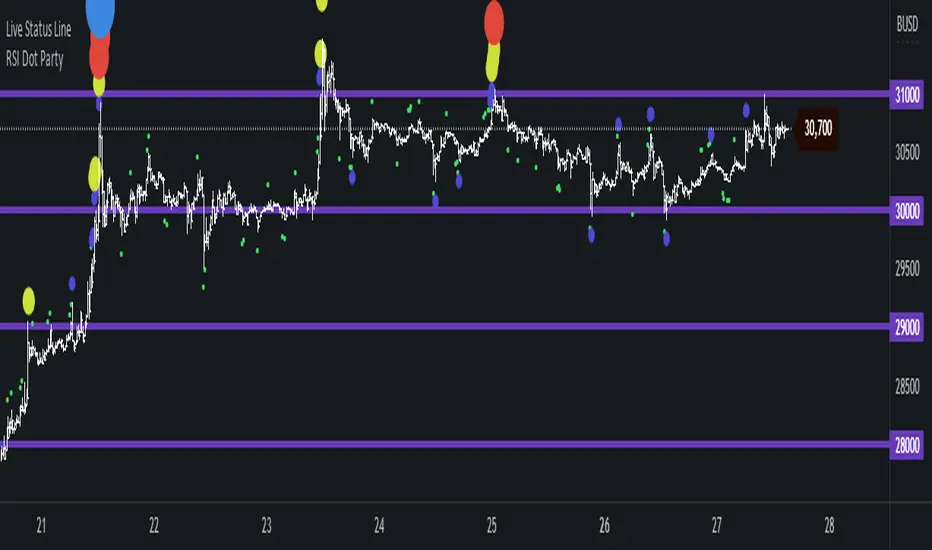
RSI Dot Party - All Lengths From 1 To 120The RSI Dot Party indicator displays all RSI lengths from 1 to 120 as different colored dots on the chart.
🔶 Purpose
Show the reversal point of price action to time entries and exits.
🔶 USAGE
When a dot displays it is a indication of the reversal of the price/trend. The larger the dot the more likely it is to reverse.
The Default settings generates dots for extreme cases where the RSI is over = 90 or under = 10 for every RSI length in the range of 1-120.
Example if the RSI of length 1 or 2 or 3 or 4 or ... or 15 or 16 or 17 or ... or 80 or 81 or 82 or ... if any of does RSI crosses a boundary a dot is shown.
A boundary is the over/under the RSI oscillates in.
Customize the settings until the dots match up with the high and lows of past price action.
🔶 SETTINGS
🔹 Source
Source 1: Is the First Source RSI is calculated from
Source 2: Is the Second Source RSI is calculated from
🔹 Meta Settings
Hours back to draw: To speed up the script calculate it only draws a set number of hours back, default is 300 hours back in time to draw then it cuts off.
Show Dots: Show or disable dots
Show Bar Color: Color the bars for each RSI incident
Filter Cross: Filters and only shows dots when the RSI crosses above or bellow a boundary. If not all candles above or bellow the boundaries will display a dot.
Dots Location Absolute: Instead of showing the dots above or bellow the candle, the dots will show up on the top and bottom of the window.
🔹 7 RSI Groups
There are a total of 7 RSI colors.
Range Very Tiny: Default Color Green
Range Tiny: Default Color Purple
Range Small: Default Color Yellow
Range Normal: Default Color Red
Range Large: Default Color Blue
Range Huge: Default Color Dark Purple
Range Very Huge: Default Color White
🔹 RSI Group Settings
Hi/Low Color: Change the Color of that group.
Start/End: The Start and End range of this RSI color. Example if start = 5 and end = 10 the RSI of 5,6,7,8,9,10 will be displayed on the chart for that color, if any of does RSI goes above or bellow the boundary a dot is displayed on that candle.
Delay: The RSI needs to be above or bellow a boundary for x number of candles before displaying a dot. For example if delay = 2 and the RSI is over = 70 for 2 candles then it will display a dot.
Under/Over: Boundaries that indicate when to draw a dot, if over = 70 and RSI crosses above 70 a dot is displayed.
🔹 Show
Section that allows you to disable RSI grounds you dont want to see, this also removes them from the alert signal generated.
Show Low: Show or disable Low RSI dots
Show High: Show or disable High RSI dots
🔶 ALERTS
Alert for all New RSIs Dots Created in real time
The alert generated depends on what groups are showing or not, if the green group is disabled for example the alert will not be generated.
🔶 Warning
When a dot shows up it can continue moving. For example if a purple dot shows itself above a 15 minute candle, if that candle/price continue to extend up the dot will move up with it.
Dots can also disappear occasionally if the RSI moves in and out of a boundary within that candles life span.
🔶 Community
I hope you guys find this useful, if you have any questions or feature requests leave me a comment! Take care :D
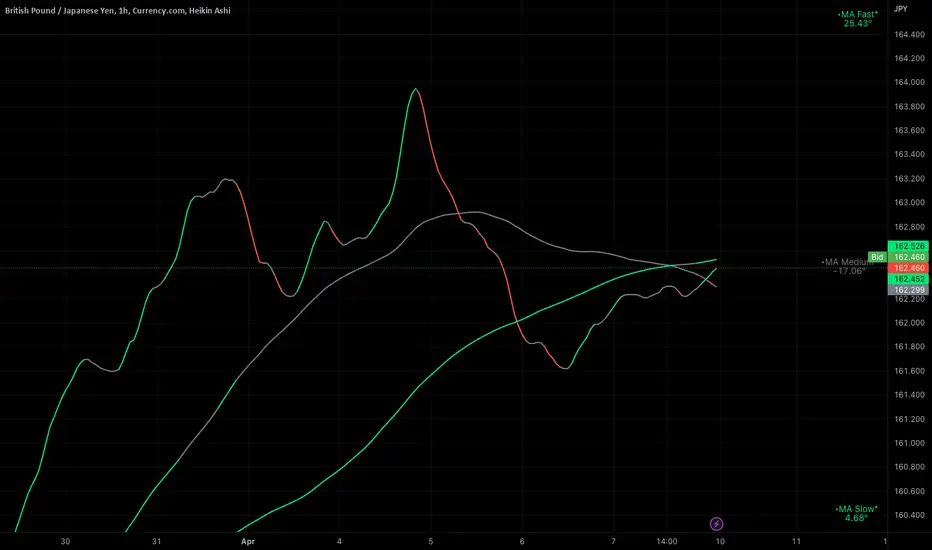
Bollinger Bands and SMA Channel Buy and Sell
This Indicator is a combination of a standard BB indicator incorporated with a SSL Channel by ErwinBeckers which is Simple Moving average with a length of set at 10 (Default) and calculates the high and low set for the default 10 to form a Channel.
The Settings for the Bollinger Band is the standard settings on a normal Bollinger Band - Length 20, source close and Standard dev 2
The setting for the SMA is length 10 and the high and low calculated or that length to form a channel.
The SMA Channel gives a green line for the Up channel and the Red line for the down Channel.
The basis of the indicator is that the Candle close above the Basis line of the BB and the SMA green line will give a buy indicator
and the same for Sell indicator the candle close below the basis BB and the SMA line Red will give a Sell indicator.
Please note that this indicator is a mix of 2 basic indicators found in Trading view, giving Buy and Sell indicators to make things easier to not look for this visually.
This code will be open source for anyone to use or back test or use it for whatever they want.
This code is for my own personal trading and cannot be relied upon. This indicator cannot be used and cannot guarantee anything, and caution should always be taken when trading. Use this with other indicators to give certanty.
Again use this for Paper Trading only.
I want to thank TradingView for its platform that facilitates development and learning.
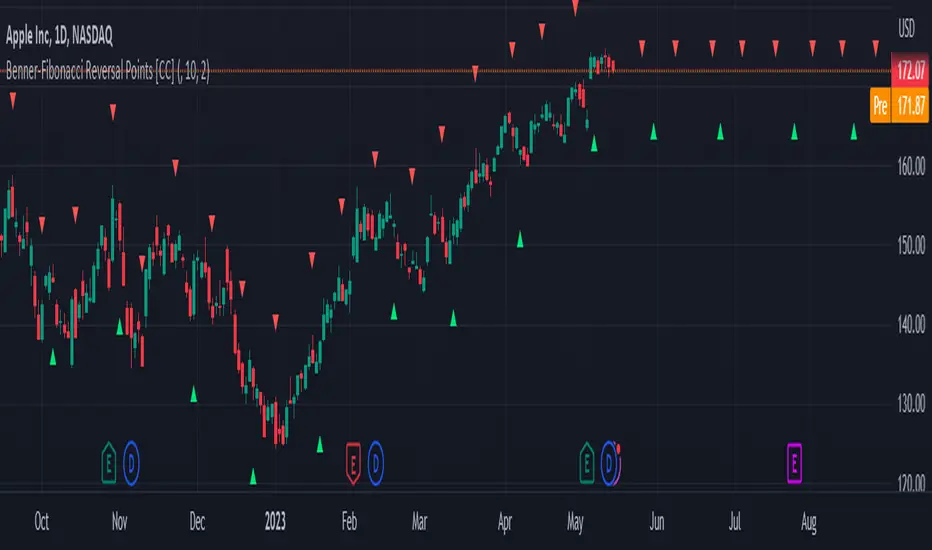
Benner-Fibonacci Reversal Points [CC]This is an original script based on a very old idea called the Benner Theory from the Civil War times. Benner discovered a pattern in pig iron prices (no clue what those are), and this turned out to be a parallel idea to indicators based on Fibonacci numbers. Because a year is 365 days (nearly 377, which is a Fibonacci number), made up of 52 weeks (nearly 55, which is another Fibonacci number), or 12 months (nearly 13, which is another Fibonacci number), Benner theorized that he could find both past and future turning points in the market by using a pattern he found. He discovered that peaks in prices seemed to follow a pattern of 8-9-10, meaning that after a recent peak, it would be 8 bars until the next peak, 9 bars until after that peak for the next, and 10 bars until the following peak. For past peaks, he would just need to reverse this pattern, and so the previous peak would be 10 bars before the most current peak, 9 bars before that peak, and 8 bars before the previous one, and these patterns seemed to repeat. For troughs, he found a pattern of 16,18,20 which follows the same logic, and this idea also seemed to work on long-term peaks and troughs as well.
This is my version of the Benner theory and the major difference between my version and his is that he would manually select a year or date and either work backwards or forwards from that point. I chose to go with an adaptive version that will automatically detect those points and plot those past and future points. I have included several options such as allowing the algorithm to be calculated in reverse which seems to work well for Crypto for some reason. I also have both short and long term options to only show one or both if you choose and of course the option to enable repainting or leave it disabled.
Big thanks to @HeWhoMustNotBeNamed and @RicardoSantos for helping me fix some bugs in my code and for @kerpiciwuasile for suggesting this idea in the first place.
Supply and DemandThis is a "Supply and Demand" script designed to help traders spot potential levels of supply (resistance) and demand (support) in the market by identifying pivot points from past price action.
Differences from Other Scripts:
Unlike many pivot point scripts, this one offers a greater degree of customization and flexibility, allowing users to determine how many ranges of pivot points they wish to plot (up to 10), as well as the number of the most recent ranges to display.
Furthermore, it allows users to restrict the plotting of pivot points to specific timeframes (15 minutes, 30 minutes, 1 hour, 4 hours, and daily) using a toggle input. This is useful for traders who wish to focus on these popular trading timeframes.
This script also uses the color.new function for a more transparent plotting, which is not commonly used in many scripts.
How to Use:
The script provides two user inputs:
"Number of Ranges to Plot (1-10)": This determines how many 10-bar ranges of pivot points the script will calculate and potentially plot.
"Number of Last Ranges to Show (1-?)": This determines how many of the most recent ranges will be displayed on the chart.
"Limit to specific timeframes?": This is a toggle switch. When turned on, the script only plots pivot points if the current timeframe is one of the following: 15 minutes, 30 minutes, 1 hour, 4 hours, or daily.
The pivot points are plotted as circles on the chart, with pivot highs in red and pivot lows in green. The transparency level of these plots can be adjusted in the script.
Market and Conditions:
This script is versatile and can be used in any market, including Forex, commodities, indices, or cryptocurrencies. It's best used in trending markets where supply and demand levels are more likely to be respected. However, like all technical analysis tools, it's not foolproof and should be used in conjunction with other indicators and analysis techniques to confirm signals and manage risk.
A technical analyst, or technician, uses chart patterns and indicators to predict future price movements. The "Supply and Demand" script in question can be an invaluable tool for a technical analyst for the following reasons:
Identifying Support and Resistance Levels : The pivot points plotted by this script can act as potential levels of support and resistance. When the price of an asset approaches these pivot points, it might bounce back (in case of support) or retreat (in case of resistance). These levels can be used to set stop-loss and take-profit points.
Timeframe Analysis : The ability to limit the plotting of pivot points to specific timeframes is useful for multiple timeframe analysis. For instance, a trader might use a longer timeframe to determine the overall trend and a shorter one to decide the optimal entry and exit points.
Customization : The user inputs provided by the script allow a technician to customize the ranges of pivot points according to their unique trading strategy. They can choose the number of ranges to plot and the number of the most recent ranges to display on the chart.
Confirmation of Other Indicators : If a pivot point coincides with a signal from another indicator (for instance, a moving average crossover or a relative strength index (RSI) divergence), it could provide further confirmation of that signal, increasing the chances of a successful trade.
Transparency in Plots : The use of the color.new function allows for more transparent plotting. This feature can prevent the chart from becoming too cluttered when multiple ranges of pivot points are plotted, making it easier for the analyst to interpret the data.
In summary, this script can be used by a technical analyst to pinpoint potential trading opportunities, validate signals from other indicators, and customize the display of pivot points to suit their individual trading style and strategy. Always remember, however, that no single indicator should be used in isolation, and effective risk management strategies should always be employed.

No Code SignalsNo Code Signals is an intuitive user interface for users to generate their own signals based on indicators they already have applied to their chart.
This indicator makes use of the new input.source() limits for importing data from external sources (indicators) into 1 indicator.
You are now able to import ANY number of sources from up to 10 different indicators.
Features:
- Import up to 10 unique values from up to 10 different indicators already on your chart!
- Compare those values against other imported indicator values, or chart ohlc values.
- Option to use a defined level instead of an active source.
- 5 Signal Options (Currently)
- Alerts, Each signal has its own alert condition.
- Labeled Signals, to tell which signal is which.
Potential Future Plans:
- More Signals & Analysis Options
- Possibly more imports
- Combining 2 (or more) signals into 1
Here is a Screenshot of a chart with signals, and the Interface creating the signals.
Enjoy!

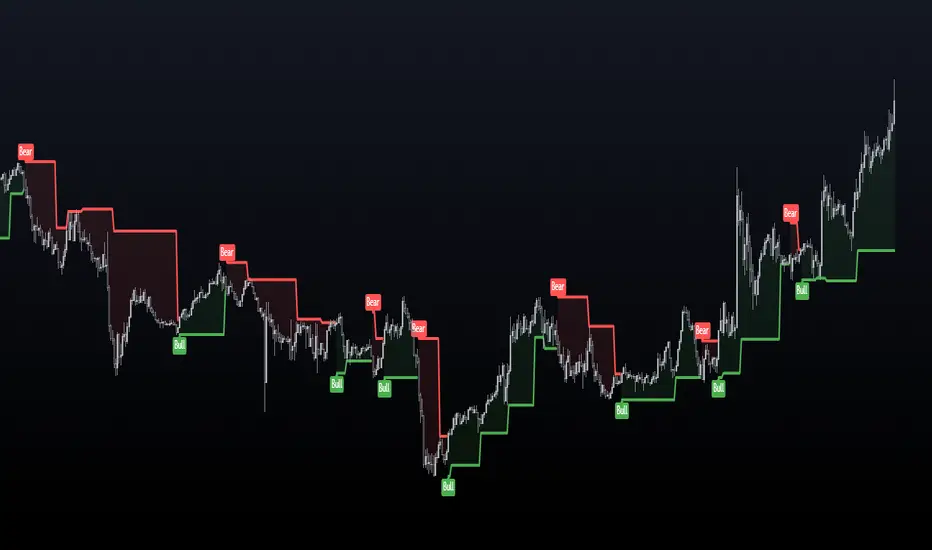
Sushi Trend [HG]🍣 The Sushi Roll, a trading concept conceived at a restaurant by Mark Fisher.
While the indicator itself goes by Sushi Trend, it is completely backed by the idea of Mark Fisher's Sushi Roll Reversal Pattern. No, it has nothing to do with raw fish, it just so happens that somebody was ordering sushi during the discussion of the idea, and that's how it got its name.
📝 Origin
First mentioned in his book, The Logical Trader --- the idea of the Sushi Roll is to serve as an early warning system to identify reversals in the market. Fisher defines the pattern as a series of 10 bars, split into two different sections, seen as 5 and 5. In order for the pattern to be emitted, the 5 bars to the right must completely engulf the 5 bars to the left. It's not a super complex system and is in fact extremely simple to grasp.
📈 Supertrend Similarities
Instead of displaying the pattern in the way Fisher meant for it to be portrayed (as seen in the photo above), I instead turned it into an indicator similar to that of Supertrend while also inheriting the same concepts from the pattern. I did this because the pattern itself has inconsistencies which can be quite noticeable when trading with it after a while. For example, these patterns can occur even during consolidating periods, and even though the pattern is meant to be recognized during trending markets, the engulfing bars can sometimes be left with indecisive directions.
➡️ The Result
Here is the result, visualized to be better in a trending format. (The indicator will not contain the boxes.)
While Fisher does mention the pattern to include 10 bars, you can actually use this pattern with any number of bars. At the end of the day, it's a concept derived from a discussion at a Japanese restaurant, and a pattern that has been around for years that has seen results. Due to this, I added an input option to control the series of bars for right-bar engulf detection.
To reassure the meaning of the pattern --> "A series of 10 bars" means 5 left bars and 5 right bars. So if you want to check if 5 right bars are engulfing the previous 5 bars (as seen in the photo above), you would want to select 5 in the input settings.
You can learn more about it from the following links
Market Reversals and the Sushi Roll Technique
The Logical Trader
Ignition Cha Cha ChaIgnition Cha Cha Cha (ICCC) is a 3 color coded moving average indicator which numerically quantify the angle of their trends. I have labeled them as fast, medium and slow. The trend colors are Green for bullish, Red for bearish and Grey for sideways. The sideways movement can be user defined for all 3 in the settings under Threshold. If you regard for example anything under 10º as sideways then place 10 in the corresponding threshold and any angle under 10º will give a grey moving average and a grey labeled text. I use this chart in several ways. If you don't want moving averages all over your Chartistic Masterpiece you can turn off the plots and leave the numeric angles which will give you an overview of the trend. Conversely if you want to make the ultimate trend chart you can setup a 4 chart layout, Weekly, Daily, 12 hour and 4 hour and add the indicator with 200/50/25 moving averages and look for confluence. I find the best way for this is turn off the candles and use the moving averages with the numeric labels. You also have the ability to turn off and on different aspects of the indicator so that there is good control over its look. Also I have given the indicator lots of Alert presets for all 3 of the moving averages so you can avoid demented screen-stairing. Please forgive the name, my mother made me do Ballroom dancing lessons as a kid.
Moving Average Resting Point [theEccentricTrader]█ OVERVIEW
This indicator uses peak and trough prices to calculate the moving average resting point and plots it as a line on the chart. The lookback length is variable and the indicator can plot up to three lines with different lookback lengths and colors.
█ CONCEPTS
Green and Red Candles
• A green candle is one that closes with a high price equal to or above the price it opened.
• A red candle is one that closes with a low price that is lower than the price it opened.
Swing Highs and Swing Lows
• A swing high is a green candle or series of consecutive green candles followed by a single red candle to complete the swing and form the peak.
• A swing low is a red candle or series of consecutive red candles followed by a single green candle to complete the swing and form the trough.
Peak and Trough Prices (Basic)
• The peak price of a complete swing high is the high price of either the red candle that completes the swing high or the high price of the preceding green candle, depending on which is higher.
• The trough price of a complete swing low is the low price of either the green candle that completes the swing low or the low price of the preceding red candle, depending on which is lower.
Historic Peaks and Troughs
The current, or most recent, peak and trough occurrences are referred to as occurrence zero. Previous peak and trough occurrences are referred to as historic and ordered numerically from right to left, with the most recent historic peak and trough occurrences being occurrence one.
Support and Resistance
• Support refers to a price level where the demand for an asset is strong enough to prevent the price from falling further.
• Resistance refers to a price level where the supply of an asset is strong enough to prevent the price from rising further.
Support and resistance levels are important because they can help traders identify where the price of an asset might pause or reverse its direction, offering potential entry and exit points. For example, a trader might look to buy an asset when it approaches a support level , with the expectation that the price will bounce back up. Alternatively, a trader might look to sell an asset when it approaches a resistance level , with the expectation that the price will drop back down.
It's important to note that support and resistance levels are not always relevant, and the price of an asset can also break through these levels and continue moving in the same direction.
Wave Cycles
A wave cycle is here defined as a complete two-part move between a swing high and a swing low, or a swing low and a swing high. As can be seen in the example above, the first swing high or swing low will set the course for the sequence of wave cycles that follow; a chart that begins with a swing low will form its first complete wave cycle upon the formation of the first complete swing high and vice versa.
Wave Length
Wave length is here measured in terms of bar distance between the start and end of a wave cycle. For example, if the current wave cycle ends on a swing low the wave length will be the difference in bars between the current swing low and current swing high. In such a case, if the current swing low completes on candle 100 and the current swing high completed on candle 95, we would simply subtract 95 from 100 to give us a wave length of 5 bars.
Average wave length is here measured in terms of total bars as a proportion as total waves. The average wavelength is calculated by dividing the total candles by the total wave cycles.
Wave Height
Wave height is here measured in terms of current range. For example, if the current peak price is 100 and the current trough price is 80, the wave height will be 20.
Amplitude
Amplitude is here measured in terms of current range divided by two. For example if the current peak price is 100 and the current trough price is 80, the amplitude would be calculated by subtracting 80 from 100 and dividing the answer by 2 to give us an amplitude of 10.
Resting Point
The resting point is here calculated by subtracting the current trough price from the current peak price and adding the difference to the current trough price to output the price in the middle of the two prices. Essentially it is the current trough price plus the amplitude. For example, if the current peak price is 100 and the current trough price is 80, the resting point 90.
The moving average resting point is here calculated by subtracting the moving average trough price from the moving average peak price, dividing the answer by two and adding the difference to the moving average trough price.
Frequency
Frequency is here measured in terms of wave cycles per second (Hertz). For example, if the total wave cycle count is 10 and the amount of time it has taken to complete these 10 cycles is 1-year (31,536,000 seconds), the frequency would be calculated by dividing 10 by 31,536,000 to give us a frequency of 0.00000032 Hz.
Range
The range is simply the difference between the current peak and current trough prices, generally expressed in terms of points or pips.
█ FEATURES
Inputs
Show MARP 1
Show MARP 2
Show MARP 3
MARP 1 Length
MARP 2 Length
MARP 3 Length
MARP 1 Color
MARP 2 Color
MARP 3 Color
█ HOW TO USE
This indicator can be used like any other moving average indicator to analyse trend direction and momentum, identify potential support and resistance levels, or for filtering trading strategies and developing new ones.
Opening Hour/Closing Hour Indices Statistics: high/low times; 5mVery specific indicator designed for 5min timeframe, to show the statistical timings of the highs and lows of Opening hour (9:30-10am) and Closing hour (3pm-4pm) NY time
~~Shown here on SPX 5min chart. Works all variants of the US indices. SPX and SPY typically show more days of history (non-extended session =>> more bars).
//Purpose:
-To get statistics on the timings of the high and low of the opening hour and the high & low of the closing hour.
//Design & Limitations:
- Designed for the 5minute chart ONLY . Need a sweet spot of 'bucket' size for the statistics: to allow meaningful comparison between times.
-Will also display on 1min chart but NOT the statistics panel, only the realtime data (today's opening hour/ closing hour timings).
-Can be slow to load depending on server load at the time. This is becasue of the multiple usage of looping array functions. Please be patient when loading or changing settings.
//User inputs:
-Standard formatting options: highlight color, table text color. Toggle on/off independently
-Decimal % percision (default = 0, i.e. 23%. If set to 1 => 22.8%)
-Show statistics: Show Opening hour statistics, Show Closing hour statistics
//Notes:
-Days of history shown at top of table; this is the size of the dataset. i.e. 254 here (254 trading days) =>> 254 opening hour highs, 254 closing hour lows etc.
--to illustrate with the above: 18% of those 254 closing hour highs occured on the 15:00 5min candle (i.e. between 15:00 and 15:05).
-SPY or SPX offer the largest history/dataset (circa 254 trading days).
-Note that the final timing in each hour is 10:25am and 15:55pm respectively: this is because the 10:25am 5min candle essentially ends at 10:30am =>> we properly captures the opening hour this way
-Pro+ users will get less data history than Premium users (half as much, due to 10k vs 20k bars history limit).