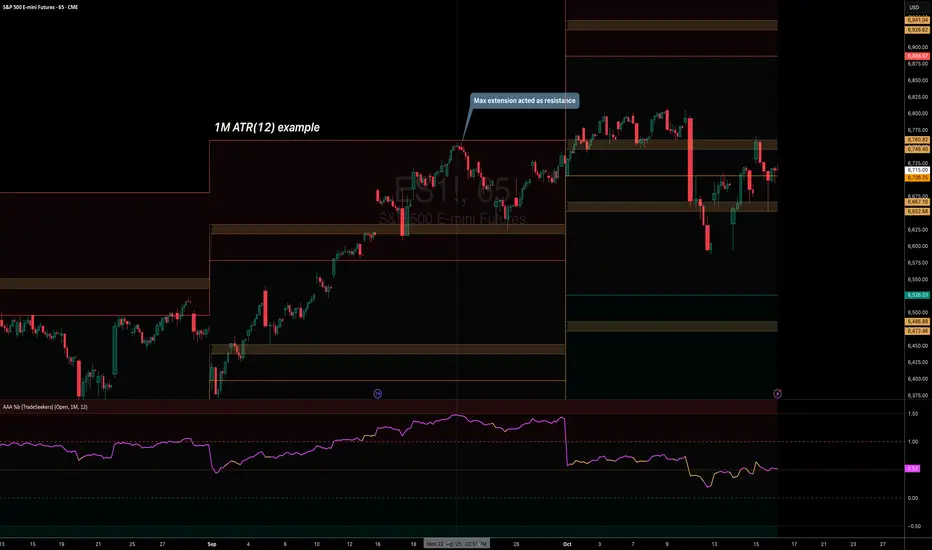
ATR Anchored Range %b by TradeSeekersAll time highs got you spooked to enter with no levels in sight?
Stuck in a multi-week range and wondering where the heck the pivots are!?
Wondering if you're longing the top or shorting the potential bottom and about to get smoked, sending you back to burger flipping?!
Fret not trading friends!
I've been crafting the ultimate map for scalpers, slingers, swingers, swindlers, swashbucklers -and traders too.
Why should I care about this, what's an ATR!?
Nearly any trader that's entered the markets has heard of ATR, perhaps even taken a stab at trying to calculate the flux capacity of a weekly ATR on a lower timeframe. Continually calculating things manually sucks!
Ok, so you haven't heard of ATR? It's the average true range... what's the true range!? It's simply the low subtracted from the high (high - low) of any given candle.
How is ATR useful?
The theory is simple, if the ATRs on the daily timeframe for a stock are 5, then traders may have a reasonable expectation that any day in the near future the stock will mostly move +/- 5 pts. This +/- 5 can be used as a possible daily high and low for traders to use.
But ATR changes as time passes, with every billionaire X post, viral cat meme, fed announcement or government shutdown the market makes it's move. This means without this tool, traders need to run the standard lame (sorry) ATR indicator and then hand draw a bunch of important levels (barf).
I'm convinced and ready to join the ATR army, what do I do?
Glad to have you aboard sailor, slap this indicator on your layout - it'll initially display a bottom panel, say nice things to it.
Usage
The lower panel provides a %b plot representative of the current price relative to the timeframe and period ATR. (Defaults to 1D timeframe and 20 - 20 trading days in a month yo)
This %b plot is a map for price against the key ATR based levels and resets each time the timeframe change occurs.
Keep reading! (maybe grab a snack, you're doing great)
If you want to see what the indicator sees, how it maths the math, open the settings and check the "overlay" option... it's amazing, I know.
Main base of operations
This will be the gray area between first red and green lines, imagine this is a future candle for the timeframe anchored. The red would represent the candle high (red means stop/overbought), and the green would represent the candle low (green means go/oversold).
Regardless of the timeframe anchored, this area always represents the area the ATR indicates will be the building area of the current candle being formed. Traders should expect most of the trading to occur within this area.
The mid line
Don't diddle in the middle, this by default is the open price and it's the ultimate bias filter for bull or bear riders.
Extension areas
Beyond the gray area is the extension zone, this provides a whole ATR from the mid line to the extension.
Assembling a trade plan
There are just a couple of key concepts to master in order to become the ultimate ATR samurai warrior, capable of slicing through even the messiest liquidity.
Above the midline and holding, but still within the gray area? Could be a great long entry with targets to upper levels. The same holds true for below open and holding while still being within the lower gray area.
As price makes it's ascension or decline towards the ends of the initial gray ATR range, consider managing trades here. If it's suspected, due to a strong hold of the midline, that the range low or high is the midline, then continue to manage trades towards the extension zones.
Timeframes and periods oh my
The tooltips already provide some hints, but not everyone goes around clicking and hovering everything in sight (maybe I'm the only one that does that?).
There's a thoughtful approach to the default values, I like to consider the big market participants with my day trades, swings trades and beyond.
By default I've chosen the daily timeframe and a period of 20, one for each trading day of the calendar month.
It's no large leap to consider alternatives, what about 1W timeframe and a period of 4 (1 month) or 52 (1 year)?
The possibilities are nearly infinite, comment on any particular favorite combos.
An Italian Special Bonus!!!
...sorry, it's not pizza....
First, did you know the famous Italian Fibonacci's real name was actually Leonardo? I'm not sure how I feel about that. Fun fact, my ancestors are Italian.
Alright, you may have guessed that the special bonus is the mythical Fibonacci inspired "Golden Pocket", maybe it's a foreshadowing of your pockets - one can only hope.
Use this feature to show the commonly referenced Fibonacci levels within each major ATR range. I've seen some totally mathematical epic-ness with these hence the addition.
Once key ATR levels have been hit look for reversals back to golden pockets (you tricksy hobbits) for potential entry back towards the prior hit ATR level.
The %b turns gold if you have the feature enabled and of course the overlay displays them also, how fun!
Final thoughts
I hope you have as much fun using this indicator as I do, it has brought much joy to my trading experience. If you don't have fun with it, well I hope you had fun reading about it at least.
100% human crafted and darn proud of it
- SyntaxGeek
Buscar en scripts para "ATR"
ATR Circle PlotTitle: ATR Circle Plot
Short Title: ATR Circle Plot
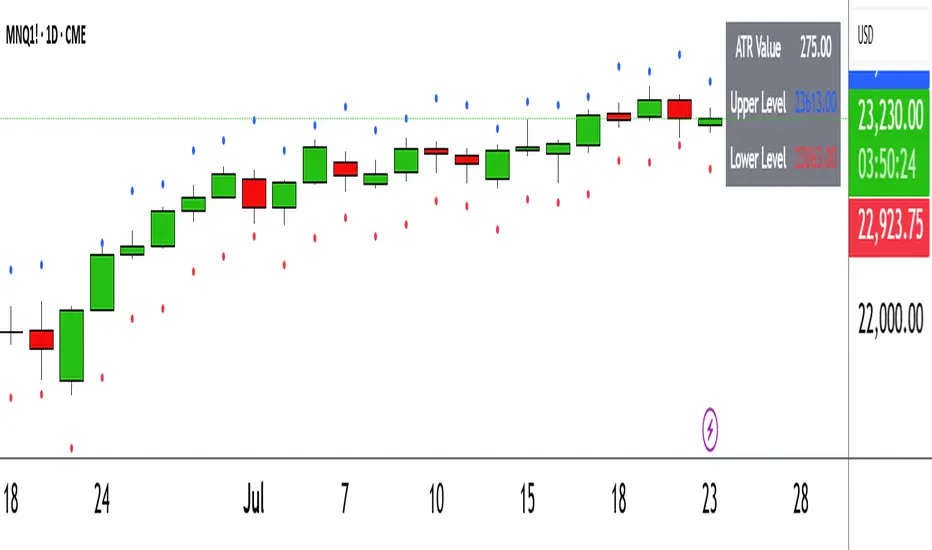
Description:
ATR Circle Plot is a dynamic overlay indicator that visualizes volatility-based levels around the open price of each bar, using the Average True Range (ATR). It plots two customizable levels—Upper and Lower ATR—calculated by multiplying the ATR by a user-defined factor (default: 1.0) and adding/subtracting it from the open price. These levels are displayed as colored circles on the chart, ideal for identifying potential breakout or stop-loss zones. A movable table summarizes the ATR value, Upper Level, and Lower Level with tick precision, and a new toggleable label feature displays these values directly on the chart for quick reference.
Perfect for traders in volatile markets like forex, futures, or stocks, this indicator helps set risk parameters or spot key price levels. Users can adjust the ATR timeframe, length, multiplier, table position, and circle colors to suit their strategy. The optional chart labels enhance usability by overlaying ATR metrics at the latest price levels, reducing the need to check the table during fast-moving markets.
Key Features:
Plots Upper and Lower ATR levels as colored circles around the open price.
Toggleable table (top/bottom, left/right) showing ATR and level values in ticks.
Optional chart labels for ATR, Upper, and Lower levels, toggleable via input.
Customizable ATR length, multiplier, timeframe, and colors for flexibility.
Lightweight and compatible with any chart timeframe.
How to Use:
Add the indicator to your chart and adjust the ATR length, multiplier, and timeframe as needed. Enable/disable the table or labels based on your preference. Use the Upper and Lower ATR levels as dynamic support/resistance or stop-loss guides. For example, place stops beyond the Upper/Lower levels or target breakouts when price crosses them. Combine with trend or momentum indicators for a robust setup.
Note: Leave the ATR Timeframe input empty to use the chart’s timeframe, or specify a higher timeframe (e.g., “D” for daily) for broader volatility context. Ensure your chart’s tick size aligns with the asset for accurate table values.
Tags: ATR, volatility, support resistance, stop loss, table, labels, breakout
Category: Volatility
ATR Overlay with Trailing Flip [ask2maniish]📘 ATR Overlay with Trailing Flip
🔍 Overview
The ATR Overlay with Trailing Flip is a dynamic, visually-enhanced overlay indicator designed to assist traders in trend detection, trailing stop management, and volatility-based decision making. It leverages the Average True Range (ATR) with optional dynamic multipliers, filters, and alerts to enhance trade execution precision.
⚙️ Features Summary
✅ Static & dynamic ATR multiplier
✅ Customizable trailing stop logic
✅ Volume & Bollinger Band filters
✅ Buy/Sell label signals with alerts
✅ ATR bands with color fill
✅ Optional candle coloring based on trend
✅ Table showing current ATR multiplier
✅ Fully customizable visual controls
🔧 User Inputs
📘 Info Panel
ATR Usage Guide
Tooltip with trading-style recommendations:
Scalping: ATR 5–10, Intraday: ATR 10–14 , Swing: ATR 14–21 , Position: ATR 21–50
📊 Visual Elements
📈 Plots
Upper/Lower ATR Bands
ATR Fill Zone
Dynamic Trailing Stop Line
🕯 Candle Coloring
Candles colored green (uptrend) or red (downtrend)
Wick coloring matches body
🏷 Signal Labels
"BUY" below candle when trend flips up
"SELL" above candle when trend flips down
📊 Table (Top Right)
Displays current multiplier value:
If static: Static: x.x
If dynamic: percentage format based on ATR ratio
🔔 Alerts
Two alert conditions:
Flip to Long → "📈 ATR flip to LONG"
Flip to Short → "📉 ATR flip to SHORT"
Sound can be enabled for real-time feedback.
🧠 Best Practices
Combine this tool with support/resistance or order flow indicators
Use dynamic ATR during volatile periods for better adaptability
Filter signals in ranging markets with BBand Width Filter
For scalping, reduce ATR period and multiplier for tighter risk
🛠️ Customization Tips
Adjust trailingPeriod for tighter/looser stops
Use color inputs to match your charting theme
Disable features (labels/fill) to declutter chart

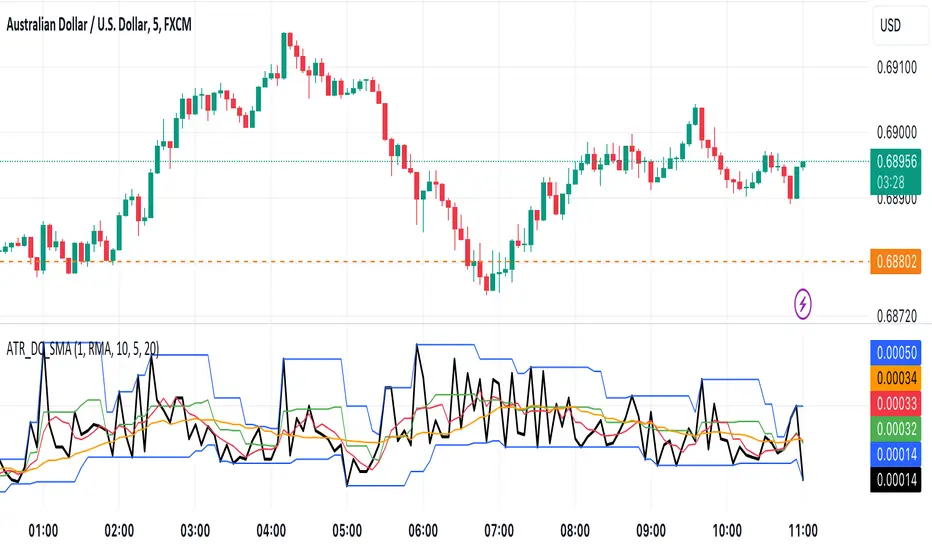
ATR with Donchian Channels and SMAsThis script combines the Average True Range (ATR), Donchian Channels, and Simple Moving Averages (SMAs) to provide a comprehensive tool for volatility and trend analysis.
Key Components:
ATR Calculation: The ATR is used to measure market volatility. It is calculated as a moving average of the true range over a specified length, which you can customize using different smoothing methods: RMA, SMA, EMA, or WMA. ATR helps identify periods of high and low volatility, giving insights into potential breakout or consolidation phases in the market.
Donchian Channels on ATR: The Donchian Channels are calculated based on the highest and lowest values of the ATR over a user-defined period. The upper and lower bands provide a volatility range, and the middle line represents the average of the two. This can help visualize the range of market volatility and detect possible trend reversals or continuations.
SMAs on ATR: Two Simple Moving Averages (SMA) are applied to the ATR values. These SMAs act as a smoothed version of the ATR, providing additional insight into volatility trends. By adjusting the length of these SMAs, you can track short-term and long-term volatility movements, helping in decision-making for potential entries and exits.
Inputs:
ATR Length: Set the length for calculating the ATR.
Smoothing Method: Choose from RMA, SMA, EMA, or WMA for smoothing the ATR calculation.
Donchian Channel Length: Set the length for calculating the highest and lowest ATR values for Donchian Channels.
SMA Lengths: Two adjustable lengths for applying SMAs to the ATR.
Visualization:
ATR Plot: The ATR is plotted in red, allowing you to see the market's volatility at a glance.
Donchian Channels: Blue lines represent the upper and lower bands, while the green line represents the middle line of the Donchian Channels, helping you visualize the volatility range.
SMAs: Two SMAs (green and orange) are plotted to smooth out the ATR and identify trends in volatility.
Use Cases:
Breakout Detection: High ATR values breaking out of the Donchian Channels may signal increased volatility and a potential breakout.
Trend Analysis: SMAs on ATR help smooth volatility trends, aiding in determining if the market is entering a more volatile or stable period.
Stop-Loss Placement: ATR and Donchian Channels can be used to set dynamic stop-loss levels based on market volatility.
This script is versatile and can be used across different asset classes, such as stocks, forex, crypto, and commodities. It is especially useful for traders who want to incorporate volatility into their trading strategies for better risk management and trend detection.
ATR Daily (Classic vs Robust, NY-Fix, Spike Control)📘 What this indicator does
This tool provides an advanced view of daily market volatility by comparing two versions of the Average True Range (ATR):
• Classic ATR — standard Wilder smoothing
• Robust ATR — uses median-based filtering and spike-control logic to reduce distortion from abnormal candles
Both values are calculated using daily data aligned to the New York trading session, so volatility resets at the same moment each institutional trading day begins. This keeps readings consistent across crypto, forex and stocks, even on intraday charts.
⚙️ How it works (in simple terms)
The script evaluates each True Range (TR) value relative to a median-based threshold:
• Abnormally large ranges are either clamped to a limit or excluded from updating ATR
• A hard cap prevents single spikes from inflating the entire indicator
• The result is a smoother and more realistic representation of daily volatility
This allows ATR to reflect typical market behaviour instead of rare one-off events.
📊 What appears on the chart
• Two daily ATR lines (Classic and Robust)
• Histogram showing the percentage of daily range already completed
• Red bars when price exceeds 100% of daily ATR
• A data table with volatility metrics
• Background highlights on days with extreme values
💡 How traders can use it
• Identify when a market has already completed most of its typical daily move
• Compare Classic vs Robust ATR to spot news-driven distortion
• Use Robust ATR for more stable stop-loss and take-profit logic
• Track volatility expansion or contraction across sessions
⚙️ Key settings
Setting Purpose
ATR period Standard smoothing length (default 14)
Robust mode Clamp, Freeze or Off
MAD multiplier Sensitivity to outliers
Cap × median(TR) Maximum allowed spike size
Base for passed ATR Which ATR is used to measure daily %
Freeze weekends Keeps ATR unchanged on Sat/Sun
🧩 Unique concept
Unlike typical ATR indicators, this one combines robust statistics (median + MAD) with session-based fixation. ATR values update only once per New York session, creating stable volatility measurements that match institutional timing.
🔒 Source code
The script is published with protected source code to preserve its statistical structure and prevent unauthorized modification.
🧭 Summary
ATR Daily (Classic vs Robust, NY-Fix) provides a clearer and more reliable view of daily volatility.
It helps determine whether the market is still in the early phase of its daily range or already exhausted.

ATR x Trend x Volume SignalsATR x Trend x Volume Signals is a multi-factor indicator that combines volatility, trend, and volume analysis into one adaptive framework. It is designed for traders who use technical confluence and prefer clear, rule-based setups.
🎯 Purpose
This tool identifies high-probability market moments when volatility structure (ATR), momentum direction (CCI-based trend logic), and volume expansion all align. It helps filter out noise and focus on clean, actionable trade conditions.
⚙️ Structure
The indicator consists of three main analytical layers:
1️⃣ ATR Trailing Stop – calculates two adaptive ATR lines (fast and slow) that define volatility context, trend bias, and potential reversal points.
2️⃣ Trend Indicator (CCI + ATR) – uses a CCI-based logic combined with ATR smoothing to determine the dominant trend direction and reduce false flips.
3️⃣ Volume Analysis – evaluates volume deviations from their historical average using standard deviation. Bars are highlighted as medium, high, or extra-high volume depending on intensity.
💡 Signal Logic
A Buy Signal (green) appears when all of the following are true:
• The ATR (slow) line is green.
• The Trend Indicator is blue.
• A bullish candle closes above both the ATR (slow) and the Trend Indicator.
• The candle shows medium, high, or extra-high volume.
A Sell Signal (red) appears when:
• The ATR (slow) line is red.
• The Trend Indicator is red.
• A bearish candle closes below both the ATR (slow) and the Trend Indicator.
• The candle shows medium, high, or extra-high volume.
Only one signal can appear per ATR trend phase. A new signal is generated only after the ATR direction changes.
❌ Exit Logic
Exit markers are shown when price crosses the slow ATR line. This behavior simulates a trailing stop exit. The exit is triggered one bar after entry to prevent same-bar exits.
⏰ Session Filter
Signals are generated only between the user-defined session start and end times (default: 14:00–18:00 chart time). This allows the trader to limit signal generation to active trading hours.
💬 Practical Use
It is recommended to trade with a fixed risk-reward ratio such as 1 : 1.5. Stop-loss placement should be beyond the slow ATR line and adjusted gradually as the trade develops.
For better confirmation, the Trend Indicator timeframe should be higher than the chart timeframe (for example: trading on 1 min → set Trend Indicator timeframe to 15 min; trading on 5 min → set to 1 hour).
🧠 Main Features
• Dual ATR volatility structure (fast and slow)
• CCI-based trend direction filtering
• Volume deviation heatmap logic
• Time-restricted signal generation
• Dynamic trailing-stop exit system
• Non-repainting logic
• Fully optimized for Pine Script v6
📊 Usage Tip
Best results are achieved when combining this indicator with additional technical context such as support-resistance, higher-timeframe confirmation, or market structure analysis.
📈 Credits
Inspired by:
• ATR Trailing Stop by Ceyhun
• Trend Magic by Kivanc Ozbilgic
• Heatmap Volume by xdecow

Rolling ATR Momentum - EnhancedATR Rolling Momentum Indicator – User Manual
---
🔍 Overview
The ATR Rolling Momentum Indicator is a dynamic volatility tool built on the Average True Range (ATR). It not only tracks increasing or decreasing momentum but also provides early warnings and confirmation signals for potential breakout moves. It’s especially powerful for futures and options traders looking to align with expanding price action.
---
📊 Core Components
✅ ATR Delta (Rolling ATR)
- Definition: Difference between current ATR and past ATR (user-defined lookback).
- Use: Tells whether volatility is expanding (positive delta) or contracting (negative delta).
- Visual: Green line for rising momentum, red for declining.
🟣 ATR Delta Slope
- Definition: Measures acceleration in momentum.
- Use: Helps identify early signs of breakout buildup.
- Visual: Purple line. Watch for slope turning up from below.
🟡 Volatility Squeeze (Yellow Dot)
- Definition: Current ATR is significantly lower than its 20-period average.
- Use: Indicates the market is coiling—possible breakout ahead.
🔼 Momentum Start (Green Triangle)
- Definition: ATR Delta slope turns from negative to positive.
- Use: Early warning to prepare for volatility expansion.
🔷 Breakout Confirmation (Blue Label Up)
- Definition: ATR Delta exceeds its high of the last 10 candles.
- Use: Confirms volatility breakout—trade opportunity if direction aligns.
🟩/🟥 Background Color
- Green Background: Momentum rising (positive ATR delta)
- Red Background: Momentum falling (negative ATR delta)
- Yellow Tint: Active squeeze zone
---
✅ How to Use It (Futures/Options Focus)
Step-by-Step:
1. Squeeze Detected (Yellow Dot) → Stay alert. Market is coiling.
2. Green Triangle Appears → Momentum is starting to rise.
3. Background Turns Green → Confirmed rising momentum.
4. Blue Label Appears → Confirmed breakout (enter trade if trend aligns).
Directional Bias:
- Use your main chart setup (price action, EMAs, trendlines, etc.) to decide direction (Call or Put, Long or Short).
- ATR Momentum only tells you how strong the move is—not which way.
---
⚙️ Inputs & Settings
- ATR Period: Default 14 (core volatility measure)
- Rolling Lookback: Used to calculate delta (default 5)
- Slope Length: Used to measure acceleration (default 3)
- Squeeze Factor: Default 0.8 — lower = more sensitive squeeze detection
- Breakout Lookback: Checks ATR delta against last X bars (default 10)
---
🧠 Pro Tips
- Works great when paired with EMA stacks, price structure, or breakout patterns.
- Avoid taking trades based only on squeeze or momentum—combine with chart confirmation.
- If background turns red after a breakout, it may be losing momentum—book partials or tighten stops.
---
🧭 Ideal For:
- Nifty/BankNifty Futures
- Option directional trades (call/put buying)
- Index scalping and momentum swing setups
---
Use this tool as your volatility compass—it won't tell you where to go, but it'll tell you when the wind is strong enough to move fast.
End of Manual

ATR and Moving AverageUsing ATR and Moving Average: A Technical Analysis Strategy
The Average True Range (ATR) and the Moving Average are two important technical analysis tools that can be used together to identify trading opportunities in the market. In this article, we will explore how to use these two tools and how the crossover between them can indicate changes in the market.
What is ATR?
The Average True Range (ATR) is a measure of the volatility of an asset, which calculates the average true range of an asset over a period of time. The true range is the difference between the closing price and the opening price of an asset, or the difference between the closing price and the highest or lowest price of the day. ATR is an important measure of volatility, as it helps to identify the magnitude of price fluctuations of an asset.
What is Moving Average?
The Moving Average is a technical analysis tool that calculates the average price of an asset over a period of time. The Moving Average can be used to identify trends and price patterns, and is an important tool for traders. There are different types of Moving Averages, including the Simple Moving Average (SMA), the Exponential Moving Average (EMA), and the Weighted Moving Average (WMA).
Crossover between ATR and Moving Average
The crossover between ATR and Moving Average can be an important indicator of changes in the market. When ATR crosses above the Moving Average, it may indicate that the volatility of the asset is increasing and that the price may be about to rise. This occurs because ATR is increasing, which means that the true range of the asset is increasing, and the Moving Average is being surpassed, which means that the price is rising.
On the other hand, when ATR crosses below the Moving Average, it may indicate that the volatility of the asset is decreasing and that the price may be about to fall. This occurs because ATR is decreasing, which means that the true range of the asset is decreasing, and the Moving Average is being surpassed, which means that the price is falling.
Trading Strategies
There are several trading strategies that can be used with the crossover between ATR and Moving Average. Some of these strategies include:
Buying when ATR crosses above the Moving Average, with the expectation that the price will rise.
Selling when ATR crosses below the Moving Average, with the expectation that the price will fall.
Using the crossover between ATR and Moving Average as a filter for other trading strategies, such as trend analysis or pattern recognition.
In summary, the crossover between ATR and Moving Average can be an important indicator of changes in the market, and can be used as a technical analysis tool to identify trading opportunities. However, it is important to remember that no trading strategy is foolproof, and that it is always important to use a disciplined approach and manage risk adequately.

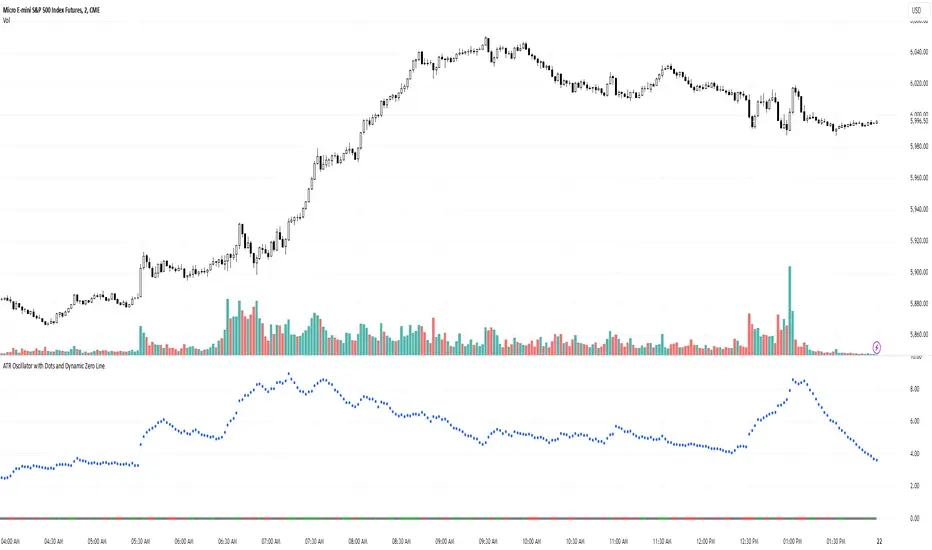
ATR Oscillator with Dots and Dynamic Zero LineWhat It Is
The ATR Oscillator with Dots and Dynamic Zero Line is a custom indicator based on the Average True Range (ATR), designed to provide traders with enhanced insights into market volatility and directional bias. Unlike traditional ATR oscillators that plot continuous lines, this version uses distinct dots to display ATR values and includes a dynamic zero line that changes color based on market direction (uptrend, downtrend, or consolidation).
How It Works
ATR Calculation:
The indicator calculates the Average True Range over a user-defined period (default: 14 bars). ATR measures market volatility by considering the range between the high, low, and close of each bar.
Dots for ATR Values:
Instead of plotting ATR values as a continuous line, the indicator represents each value as an individual blue dot. This format highlights changes in volatility without visually connecting them, helping to avoid false trends and clutter.
Dynamic Zero Line:
A horizontal zero line provides additional directional context. The line changes color dynamically:
Green: Indicates an uptrend (price is consistently closing higher over consecutive bars).
Red: Indicates a downtrend (price is consistently closing lower over consecutive bars).
Gray: Indicates market consolidation or sideways movement (no clear trend in price).
The thickness and step-like style of the zero line make it visually prominent, enabling quick interpretation of market direction.
What It Does
Visualizes Market Volatility:
By plotting ATR values as dots, the oscillator emphasizes periods of heightened or reduced market activity, helping traders anticipate breakout opportunities or avoid low-volatility zones.
Provides Trend Context:
The dynamic zero line gives traders a clear signal of the prevailing market trend (uptrend, downtrend, or consolidation), which can be used to align trading strategies with the broader market context.
Avoids Misleading Trends:
Unlike traditional ATR oscillators that use continuous lines, this version eliminates visual artifacts caused by noise, such as false trends during consolidation periods.
Simplifies Interpretation:
The combination of ATR dots and a color-coded zero line creates a straightforward and intuitive tool for assessing both volatility and market direction.
Why It’s More Useful Than a Traditional ATR Oscillator
Enhanced Visibility:
The use of dots instead of a continuous line makes it easier to spot discrete changes in ATR values, avoiding visual clutter and false impressions of smooth trends.
Dynamic Market Context:
Traditional ATR oscillators only measure volatility, offering no indication of market direction. The dynamic zero line in this oscillator adds valuable directional context, helping traders align their strategies with the trend.
Better for Range-Bound Markets:
The zero line’s color-changing feature highlights consolidation periods, enabling traders to identify and avoid trading during sideways, low-volatility conditions where false signals are common.
Quick Decision-Making:
With clear visual cues (dots and color-coded lines), traders can quickly assess market conditions without needing to analyze multiple charts or indicators.
Improved Confluence:
The oscillator’s signals can easily be combined with other tools like VWAP, Volume Profile, or Order Flow indicators for more confident trade decisions.
When to Use It
Trending Markets:
Use the dynamic zero line to confirm the market’s direction and align trades accordingly.
Breakout Opportunities:
Look for periods of increasing ATR (dots moving higher) to anticipate high-volatility breakout scenarios.
Avoiding Noise:
During consolidation (gray zero line), this oscillator warns traders to wait for clearer signals before entering trades.
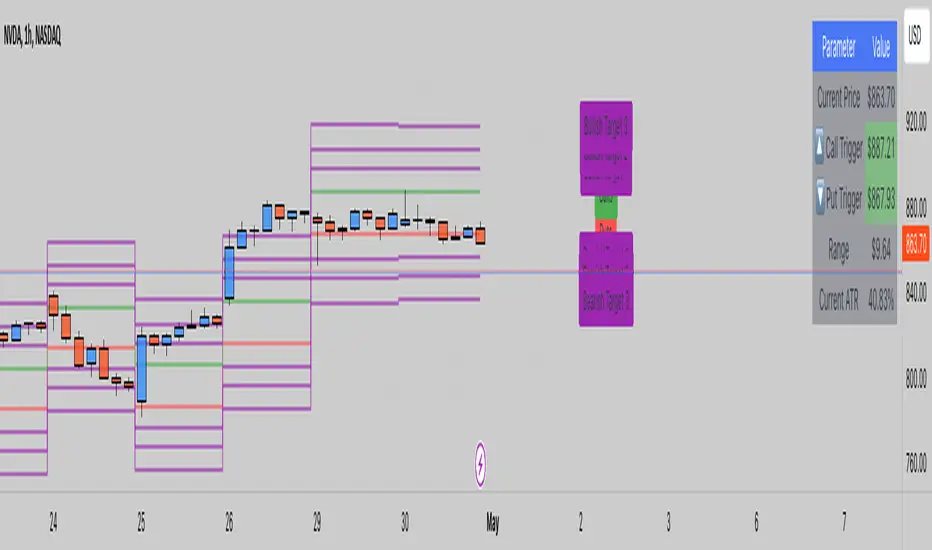
ATR LevelsThe indicator calculates and displays key levels based on the Average True Range (ATR) of an asset's price. The ATR is a measure of market volatility, and this indicator uses it to create trigger levels and ATR target levels. The "ATR Levels" indicator helps traders identify potential entry and exit points based on market volatility, providing valuable information for their trading decisions.
The indicator adds text labels to indicate whether the levels are for "Puts" or "Calls" on the trigger levels, and "Target 1" or "Target 2" on the ATR target levels.
Input Description:
ATR Length: This is an input parameter that allows the user to set the number of periods used to calculate the Average True Range (ATR). The ATR measures the market's volatility, and a higher length value will result in a smoother ATR line.
Trigger Percentage: Another input parameter that determines the percentage above and below the previous day's close at which the trigger levels will be plotted. It allows traders to set the sensitivity of the trigger levels.
Lower Trigger Level Color and Upper Trigger Level Color: These input parameters allow the user to customize the colors of the trigger levels. The indicator will plot two lines representing the lower and upper trigger levels.
Level Size: This input parameter allows the user to adjust the thickness of the trigger level lines.
ATR Target Color: An input parameter that sets the color for the ATR target level lines.
ATR Target Multiplier 1 and ATR Target Multiplier 2: These are input parameters that allow the user to set the multiplier for calculating the ATR target levels. The indicator will plot two ATR target lines above and below the previous day's close, each multiplied by the specified multiplier.
ATR GOD Strategy by TradeSmart (PineConnector-compatible)This is a highly-customizable trading strategy made by TradeSmart, focusing mainly on ATR-based indicators and filters. The strategy is mainly intended for trading forex , and has been optimized using the Deep Backtest feature on the 2018.01.01 - 2023.06.01 interval on the EUR/USD (FXCM) 15M chart, with a Slippage value of 3, and a Commission set to 0.00004 USD per contract. The strategy is also made compatible with PineConnector , to provide an easy option to automate the strategy using a connection to MetaTrader. See tooltips for details on how to set up the bot, and check out our website for a detailed guide with images on how to automate the strategy.
The strategy was implemented using the following logic:
Entry strategy:
A total of 4 Supertrend values can be used to determine the entry logic. There is option to set up all 4 Supertrend parameters individually, as well as their potential to be used as an entry signal/or a trend filter. Long/Short entry signals will be determined based on the selected potential Supertrend entry signals, and filtered based on them being in an uptrend/downtrend (also available for setup). Please use the provided tooltips for each setup to see every detail.
Exit strategy:
4 different types of Stop Losses are available: ATR-based/Candle Low/High Based/Percentage Based/Pip Based. Additionally, Force exiting can also be applied, where there is option to set up 4 custom sessions, and exits will happen after the session has closed.
Parameters of every indicator used in the strategy can be tuned in the strategy settings as follows:
Plot settings:
Plot Signals: true by default, Show all Long and Short signals on the signal candle
Plot SL/TP lines: false by default, Checking this option will result in the TP and SL lines to be plotted on the chart.
Supertrend 1-4:
All the parameters of the Supertrends can be set up here, as well as their individual role in the entry logic.
Exit Strategy:
ATR Based Stop Loss: true by default
ATR Length (of the SL): 100 by default
ATR Smoothing (of the SL): RMA/SMMA by default
Candle Low/High Based Stop Loss: false by default, recent lowest or highest point (depending on long/short position) will be used to calculate stop loss value. Set 'Base Risk Multiplier' to 1 if you would like to use the calculated value as is. Setting it to a different value will count as an additional multiplier.
Candle Lookback (of the SL): 50 by default
Percentage Based Stop Loss: false by default, Set the stop loss to current price - % of current price (long) or price + % of current price (short).
Percentage (of the SL): 0.3 by default
Pip Based Stop Loss: Set the stop loss to current price - x pips (long) or price + x pips (short). Set 'Base Risk Multiplier' to 1 if you would like to use the calculated value as is. Setting it to a different value will count as an additional multiplier.
Pip (of the SL): 10 by default
Base Risk Multiplier: 4.5 by default, the stop loss will be placed at this risk level (meaning in case of ATR SL that the ATR value will be multiplied by this factor and the SL will be placed that value away from the entry level)
Risk to Reward Ratio: 1.5 by default, the take profit level will be placed such as this Risk/Reward ratio is met
Force Exiting:
4 total Force exit on custom session close options: none applied by default. If enabled, trades will close automatically after the set session is closed (on next candle's open).
Base Setups:
Allow Long Entries: true by default
Allow Short Entries: true by default
Order Size: 10 by default
Order Type: Capital Percentage by default, allows adjustment on how the position size is calculated: Cash: only the set cash amount will be used for each trade Contract(s): the adjusted number of contracts will be used for each trade Capital Percentage: a % of the current available capital will be used for each trade
ATR Limiter:
Use ATR Limiter: true by default, Only enter into any position (long/short) if ATR value is higher than the Low Boundary and lower than the High Boundary.
ATR Limiter Length: 50 by default
ATR Limiter Smoothing: RMA/SMMA by default
High Boundary: 1000 by default
Low Boundary: 0.0003 by default
MA based calculation: ATR value under MA by default, If not Unspecified, an MA is calculated with the ATR value as source. Only enter into position (long/short) if ATR value is higher/lower than the MA.
MA Type: RMA/SMMA by default
MA Length: 400 by default
Waddah Attar Filter:
Explosion/Deadzone relation: Not specified by default, Explosion over Deadzone: trades will only happen if the explosion line is over the deadzone line; Explosion under Deadzone: trades will only happen if the explosion line is under the deadzone line; Not specified: the opening of trades will not be based on the relation between the explosion and deadzone lines.
Limit trades based on trends: Not specified by default, Strong Trends: only enter long if the WA bar is colored green (there is an uptrend and the current bar is higher then the previous); only enter short if the WA bar is colored red (there is a downtrend and the current bar is higher then the previous); Soft Trends: only enter long if the WA bar is colored lime (there is an uptrend and the current bar is lower then the previous); only enter short if the WA bar is colored orange (there is a downtrend and the current bar is lower then the previous); All Trends: only enter long if the WA bar is colored green or lime (there is an uptrend); only enter short if the WA bar is colored red or orange (there is a downtrend); Not specified: the color of the WA bar (trend) is not relevant when considering entries.
WA bar value: Not specified by default, Over Explosion and Deadzone: only enter trades when the WA bar value is over the Explosion and Deadzone lines; Not specified: the relation between the explosion/deadzone lines to the value of the WA bar will not be used to filter opening trades.
Sensitivity: 150 by default
Fast MA Type: SMA by default
Fast MA Length: 10 by default
Slow MA Type: SMA
Slow MA Length: 20 by default
Channel MA Type: EMA by default
BB Channel Length: 20 by default
BB Stdev Multiplier: 2 by default
Trend Filter:
Use long trend filter 1: false by default, Only enter long if price is above Long MA.
Show long trend filter 1: false by default, Plot the selected MA on the chart.
TF1 - MA Type: EMA by default
TF1 - MA Length: 120 by default
TF1 - MA Source: close by default
Use short trend filter 1: false by default, Only enter long if price is above Long MA.
Show short trend filter 1: false by default, Plot the selected MA on the chart.
TF2 - MA Type: EMA by default
TF2 - MA Length: 120 by default
TF2 - MA Source: close by default
Volume Filter:
Only enter trades where volume is higher then the volume-based MA: true by default, a set type of MA will be calculated with the volume as source, and set length
MA Type: RMA/SMMA by default
MA Length: 200 by default
Date Range Limiter:
Limit Between Dates: false by default
Start Date: Jan 01 2023 00:00:00 by default
End Date: Jun 24 2023 00:00:00 by default
Session Limiter:
Show session plots: false by default, show market sessions on chart: Sidney (red), Tokyo (orange), London (yellow), New York (green)
Use session limiter: false by default, if enabled, trades will only happen in the ticked sessions below.
Sidney session: false by default, session between: 15:00 - 00:00 (EST)
Tokyo session: false by default, session between: 19:00 - 04:00 (EST)
London session: false by default, session between: 03:00 - 11:00 (EST)
New York session: false by default, session between: 08:00 - 17:00 (EST)
Trading Time:
Limit Trading Time: true by default, tick this together with the options below to enable limiting based on day and time
Valid Trading Days Global: 123567 by default, if the Limit Trading Time is on, trades will only happen on days that are present in this field. If any of the not global Valid Trading Days is used, this field will be neglected. Values represent days: Sunday (1), Monday (2), ..., Friday (6), Saturday(7) To trade on all days use: 123457
(1) Valid Trading Days: false, 123456 by default, values represent days: Sunday (1), Monday (2), ..., Friday (6), Saturday(7) The script will trade on days that are present in this field. Please make sure that this field and also (1) Valid Trading Hours Between is checked
(1) Valid Trading Hours Between: false, 1800-2000 by default, hours between which the trades can happen. The time is always in the exchange's timezone
All other options are also disabled by default
PineConnector Automation:
Use PineConnector Automation: false by default, In order for the connection to MetaTrader to work, you will need do perform prerequisite steps, you can follow our full guide at our website, or refer to the official PineConnector Documentation. To set up PineConnector Automation on the TradingView side, you will need to do the following:
1. Fill out the License ID field with your PineConnector License ID;
2. Fill out the Risk (trading volume) with the desired volume to be traded in each trade (the meaning of this value depends on the EA settings in Metatrader. Follow the detailed guide for additional information);
3. After filling out the fields, you need to enable the 'Use PineConnector Automation' option (check the box in the strategy settings);
4. Check if the chart has updated and you can see the appropriate order comments on your chart;
5. Create an alert with the strategy selected as Condition, and the Message as {{strategy.order.comment}} (should be there by default);
6. Enable the Webhook URL in the Notifications section, set it as the official PineConnector webhook address and enjoy your connection with MetaTrader.
License ID: 60123456789 by default
Risk (trading volume): 1 by default
NOTE! Fine-tuning/re-optimization is highly recommended when using other asset/timeframe combinations.

ATR OSC and Volume Screener (ATROSCVS)In today's world of trading, having the right tools and indicators can make all the difference. With the vast number of cryptocurrencies available, I've found it challenging to keep track of the market's overall direction and make informed decisions. That's where the ATR OSC and Volume Screener comes in, a powerful Pine Script that I use to identify potential trading opportunities across multiple cryptocurrencies, all in one convenient place.
This script combines two essential components: the ATR Oscillator (ATR OSC) and a Volume Screener. It is designed to work with the TradingView platform. Let me explain how this script works and how it benefits my trading.
Firstly, the ATR Oscillator is an RSI-like oscillator that performs better under longer lookback periods. Unlike traditional RSI, the ATR OSC doesn't lose its min and max ranges with a long lookback period, as the scale remains intact. It calculates the true range by considering the high, low, open, and close prices of a financial instrument, and uses this true range instead of the standard deviation in a modified z-score calculation. This unique approach helps provide a more precise assessment of the market's volatility.
The Volume Screener, on the other hand, helps me identify unusual trading volumes across various cryptocurrencies. It employs a normalized volume calculation method, effectively filtering out outliers and highlighting potentially significant trading opportunities.
One feature I find particularly impressive about the ATR OSC and Volume Screener is its versatility and the way it displays information using color gradients. With support for over 30 different cryptocurrencies, including popular options like Bitcoin (BTC), Ethereum (ETH), Ripple (XRP), and Dogecoin (DOGE), I can monitor a wide range of markets simultaneously. The color gradient on the grid is visually appealing and makes it easy to identify the strength of the indicators for each cryptocurrency, allowing me to make quick comparisons and spot potential trading opportunities.
The customizable input options allow me to fine-tune the script to suit my individual trading preferences and strategies. In summary, the ATR OSC and Volume Screener has been an invaluable tool for me as I navigate the ever-evolving world of cryptocurrencies. By combining the power of the ATR Oscillator with a robust Volume Screener, this Pine Script makes it easier than ever to identify promising trading opportunities and stay ahead of the game.
The color gradient in the ATR OSC and Volume Screener is essential for visually representing the data on the heatmap. It uses a range of colors to indicate the strength of the indicators for each cryptocurrency, making it easier to understand the market dynamics at a glance.
In the heatmap, the color gradient typically starts from a cooler color, such as blue or green, at the lower extremes (low ATR OSC values) and progresses towards warmer colors, like yellow, orange, or red, as the ATR OSC values approach the upper extremes (high ATR OSC values). This color-coding system enables me to quickly identify and interpret the data without having to examine individual numerical values.
For example, cooler colors (blue or green) might represent lower values of the ATR Oscillator, suggesting oversold conditions in the respective cryptocurrencies. On the other hand, warmer colors (yellow, orange, or red) indicate higher ATR OSC values, signaling overbought market conditions. This visual representation allows me to make rapid comparisons between different cryptocurrencies and spot potential trading opportunities more efficiently.
By utilizing the color gradient in the heatmap, the ATR OSC and Volume Screener simplifies the analysis of multiple cryptocurrencies, helping me to quickly identify market trends and make better-informed trading decisions.
I highly recommend testing the ATR OSC and Volume Screener and seeing the difference it can make in your trading decisions. Happy trading!

ATR Risk Display - Multi FuturesWhat This Does
I got tired of manually calculating my ATR stops and risk for different futures contracts, especially when switching between ES, NQ, and their micro versions. This indicator automatically detects what futures symbol you're trading and shows you the exact tick count and dollar risk for your stop loss.
The Problem It Solves
If you trade futures with ATR-based stops, you know the hassle:
Different contracts have different tick values
You need to calculate position risk in dollars
Switching between symbols means redoing all the math
Renko charts make it even more confusing since ATR needs to come from regular candles
This handles all of that automatically.
Key Features
Auto-detects futures symbols - ES, NQ, YM, RTY, GC, CL, and all the micros (MES, MNQ, etc.)
Shows everything you need in one line: ATR(timeframe) × multiplier = X ticks ($XXX)
Works on Renko charts - pulls ATR from regular timeframe charts (super important if you use Renko)
Adjustable position sizing - set your contract count and see total risk instantly
Clean, minimal display - just the info you need, no clutter
How to Use
Add it to any futures chart
Set your preferred ATR timeframe (I use 5-minute)
Set your ATR multiplier (I use 1.5x for my stops)
Set your contract size
That's it - the indicator handles the rest
The display will show something like: "ES ATR(5) × 1.5 = 12 ticks ($150)"
Settings Explained
ATR Timeframe: What timeframe to calculate ATR from (always uses regular candles, even on Renko)
ATR Multiplier: How many ATRs for your stop (1.5 is common, 2.0 for wider stops)
Number of Contracts: Your position size for risk calculation
Auto-Detect Symbol: Leave on unless you want to manually override
Supported Futures
Full size: ES, NQ, YM, RTY, GC, CL, ZB, ZN, 6E, 6J
Micros: MES, MNQ, MYM, M2K, MGC, MCL
Notes
Made this primarily for my own ES trading but figured others might find it useful
The tick values are based on standard CME specs
If you trade other futures, you can modify the code to add them
Works great alongside level indicators for risk management
Why This Exists
I use ATR trailing stops on all my trades and got tired of doing mental math every time I switched between charts or contracts. Especially useful if you trade both full-size and micro contracts - the risk difference is huge and easy to mess up.
Hope this helps your trading! Feel free to suggest improvements.

ATR Price Targets w/POC
ATR Price Targets with Point of Control (POC):
This script is designed to help traders identify key price target levels based on configurable multipliers of the the Average True Range (ATR) and the volume based Point of Control (POC). It is intended for intraday traders looking to capture significant price movements.
Features:
ATR Price Targets: The script calculates three levels of price targets above and below the first bar of the day, based on the ATR of the last 22 days (assuming 5-minute candles). These targets are adjustable through the settings, allowing traders to set their own ATR multipliers.
Point of Control (POC): The POC is determined as the price level of the highest volume bar since the start time, providing an indication of the most traded price within the specified period.
Customizable Start Time: Traders can set their desired start time for the calculation of price targets and POC, allowing for flexibility in aligning the indicator with their trading strategy.
Plot Lines: The ATR price targets are plotted as lines for easy visualization on the chart.
Usage:
The ATR price targets can be used as potential take-profit or stop-loss levels.
The POC can serve as a key level for assessing market sentiment and potential reversals.
Traders can adjust the ATR multipliers and start time based on their specific trading style and market conditions.
Settings:
ATR Price Targets 1, 2, 3: Adjust the multipliers for the ATR price targets. By default, these are set to 1*ATR for T1+/T1-, 3*ATR for T2+/T2- and ATR*6 for T3+/T3-. Adjust with caution as the price targets found in defaults have proven to be more accurate over intraday cycles for volatile stocks.
Start Hour & Start Minute: Set the starting hour and minute for the calculations. By default, these are set to the opening 5 minute intraday bar, but can also be set to the opening bar of pre-market hours.

ATR Channel (Bottom & Top)The ATR Channel (Bottom & Top) indicator dynamically visualizes market volatility zones based on the Average True Range (ATR). It automatically builds adaptive upper and lower boundaries around the current price, helping traders identify potential market extremes, volatility-driven reversals, and dynamic support/resistance levels.
This version is specifically optimized for Bitcoin (BTCUSDT) but works with any asset or timeframe.
⚙️ How It Works
The indicator calculates ATR over a user-defined period (default 200) and applies separate multipliers for the top and bottom bands (default ×1).
The Top Band = Close + (ATR × Multiplier)
The Bottom Band = Close - (ATR × Multiplier)
These two adaptive bands create a volatility envelope, allowing traders to visualize where the price may encounter potential exhaustion or reversal zones.
💡 Signal Logic
LONG Signal (Green Tab):
Triggered when the low of the candle touches or dips below the ATR bottom line — suggesting a possible oversold or volatility-based bottoming area.
The label displays the exact ATR line value (not the close), formatted for better readability (e.g. “LONG\n103 885”).
SELL Signal (Red Tab):
Triggered when the high of the candle touches or exceeds the ATR top line — signaling possible overbought conditions or an exhaustion zone.
Signal Filtering:
The script intelligently avoids duplicate signals — e.g., multiple consecutive LONGs or SELLs will not appear until the opposite signal is triggered.
This ensures cleaner visualization and reduces signal noise during consolidation periods.
🎯 Features
✅ Adaptive ATR-based volatility channel
✅ Automatic LONG/SELL signal labeling with real ATR-touch prices
✅ Customizable parameters:
✅ Intelligent filtering (one signal per phase)
✅ Works on any market and timeframe (crypto, forex, indices, stocks)
🧭 Trading Applications
Identify volatility extremes (ATR-based overbought/oversold zones)
Detect reversal points or exhaustion moves after extended trends
Use with trend filters (e.g. EMA200) to confirm trend continuation vs mean reversion setups
Combine with oscillators (RSI, Stoch) for confluence signals
📊 Summary
The ATR Channel (Bottom & Top) provides a clear, professional-grade visualization of volatility dynamics and price extremes.
It is especially useful for traders using mean-reversion, volatility breakout, or swing-trading strategies — helping them identify statistically significant reaction zones and improving trade timing precision.

ATR Adaptive (auto timeframe)This indicator automatically adjusts the Average True Range (ATR) period based on the current chart timeframe, helping traders define dynamic Stop Loss (SL) and Take Profit (TP) levels that adapt to market volatility.
The ATR measures the average range of price movement over a defined number of bars. By using adaptive periods, the indicator ensures that volatility is interpreted consistently across different timeframes — from 1-minute charts to daily or weekly charts.
It plots two main levels on the chart:
🔴 Low – ATR × Multiplier → Suggested Stop Loss (below the candle’s low)
🟢 High + ATR × Multiplier → Suggested Take Profit or trailing level (above the candle’s high)
Optional additional lines show ATR-based TP levels calculated from the current close.
💡 How to use
Select your desired ATR multiplier (e.g., 1.3× for SL, 1.0× for TP).
The script automatically detects the chart timeframe and uses an appropriate ATR length (e.g., ATR(30) on M5, ATR(21) on H1, ATR(14) on Daily).
Use the plotted levels to:
Set Stop Loss just below the red ATR band (for long trades).
Set Take Profit near or slightly below the green ATR band (for short trades, reverse logic).
⚙️ Why it helps
Maintains consistent volatility-based risk across multiple timeframes.
Avoids arbitrary fixed SL/TP values.
Makes the trading strategy more responsive in high-volatility markets and more conservative when volatility contracts.
Particularly useful for intraday and swing trading, where volatility varies significantly between sessions.

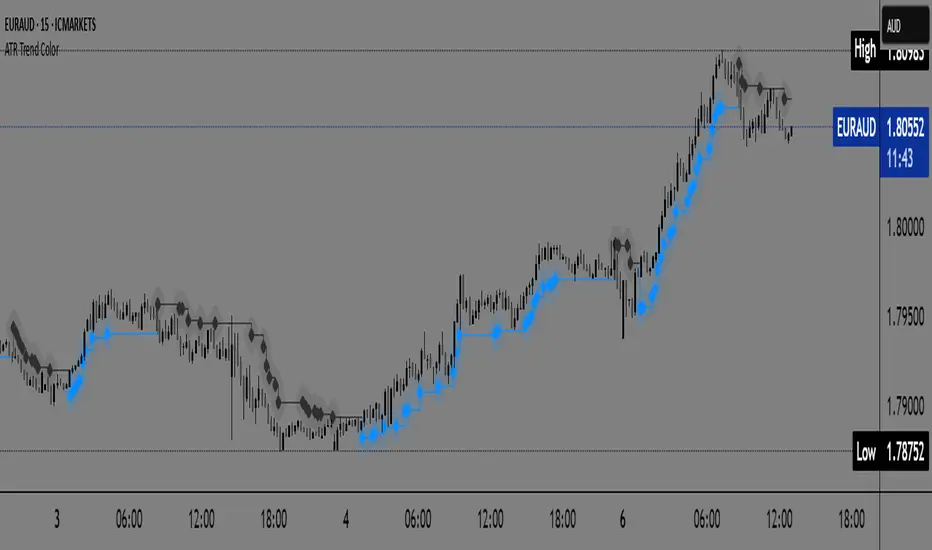
ATR Trend Color📌 ATR Trend Color — Visually clean trend-following tool based on adaptive ATR trailing stop
► Description
ATR Trend Color is a simple yet powerful indicator designed to visually identify and follow the market trend using an adaptive ATR-based trailing stop. Its main advantage lies in clarity — it uses just a single line that dynamically changes color based on trend direction:
✅ Blue line indicates price is above the trailing stop (bullish trend).
🔻 Black line indicates price is below the trailing stop (bearish trend).
This clean display allows for instant trend recognition and potential exit or reversal zones.
► How it works
The indicator uses the Average True Range (ATR) to calculate a dynamic trailing stop level. ATR measures volatility and adjusts the trailing line to match current market conditions:
When the price rises, the line moves up and acts as dynamic support.
When the price drops, the line moves down and acts as resistance.
This behavior makes it ideal for trend following and volatility-adjusted stop-loss placement.
► Key Features:
✅ Clean chart with just one ATR trailing line
✅ Dynamic color changes in real-time
✅ Great for trend confirmation and management
✅ Customizable ATR period and multiplier
✅ Step line with diamonds for high visual clarity
► How to use
Add the indicator to your chart.
Adjust ATR period and multiplier to your strategy (default: ATR 7 / multiplier 3.1).
Follow the line color:
Blue: Bullish trend — may signal to stay in long positions.
Black: Bearish trend — may suggest exit or short entries.
► Originality
Unlike typical ATR trailing stop indicators that display two lines or static colors, ATR Trend Color simplifies visualization by using a single smart line with real-time visual feedback on trend direction.
Additionally, it uses the “Step line with diamonds” display mode to enhance readability in fast or noisy markets.
ATR Trailing Stop by GideonMATR Trailing Stop Indicator
This ATR Trailing Stop Indicator is designed for traders who wish to enhance their exit strategies by leveraging volatility-based stops. It offers a systematic approach to trend management and risk control, enabling traders to capture extended trends while protecting their capital during market reversals. Works on Indian Indices as well.
Overview:
The ATR Trailing Stop indicator is a dynamic trend-following tool that adjusts stop levels based on market volatility. By incorporating the Average True Range (ATR), the indicator provides a flexible exit strategy that adapts to changing market conditions, helping traders lock in profits during trends and limit losses during reversals.
How It Works:
True Range and ATR Calculation:
The indicator first calculates the True Range (TR) for each bar, defined as the maximum of:
The difference between the high and low,
The absolute difference between the high and the previous close, and
The absolute difference between the low and the previous close.
Using the TR values, the ATR is computed over a user-defined period (default is 14 bars) with an option to use either a Simple Moving Average (SMA) or an Exponential Moving Average (EMA) as the smoothing method.
Trailing Stop Determination:
Two potential stop levels are calculated:
For an uptrend, the stop is determined as:
Stop = Close – (Multiplier × ATR)
For a downtrend, the stop is:
Stop = Close + (Multiplier × ATR)
The indicator maintains a persistent trailing stop that dynamically adjusts:
In an uptrend, the trailing stop only moves upward (or remains flat) to secure gains.
In a downtrend, it only moves downward, thereby protecting the position from excessive losses.
A reversal in trend is identified when the price crosses the trailing stop level, at which point the indicator flips the trend and resets the stop level accordingly.
Rationale:
Utilizing the ATR for trailing stops ensures that the stop levels are directly influenced by market volatility. This dynamic adjustment helps accommodate the natural price fluctuations of the market, providing a more adaptive risk management tool compared to fixed stop-loss levels. The approach is particularly useful in volatile markets where traditional static stops might be triggered prematurely.
Customization:
Key parameters that can be adjusted include:
ATR Period: The number of bars used to calculate the ATR.
ATR Multiplier: The factor that determines how far the trailing stop is set from the current price.
Smoothing Method: Option to choose between SMA and EMA for ATR calculation, allowing traders to tailor the sensitivity of the indicator to their specific trading style.

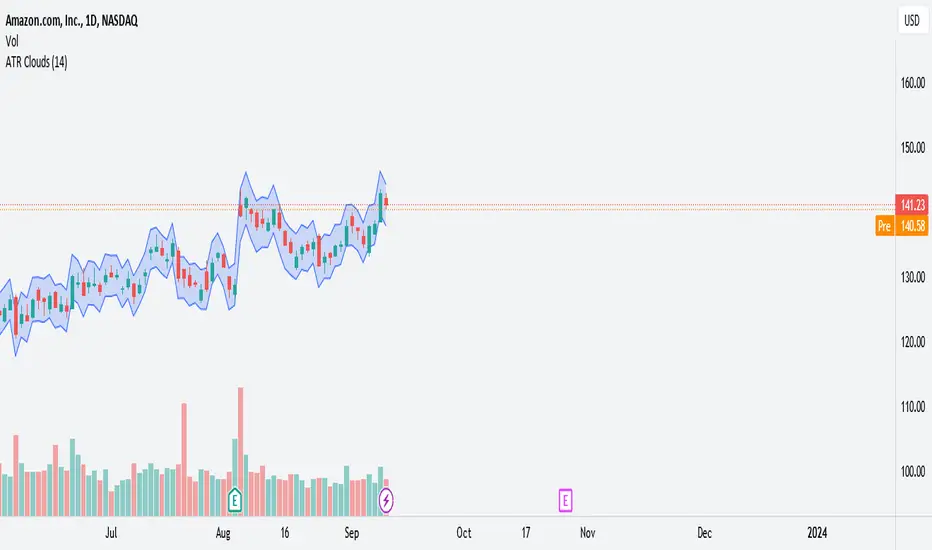
ATR Clouds*Updated with Version 5*
ATR Clouds
The "ATR Clouds" indicator provides a visual representation of the stock's volatility based on the Average True Range (ATR) calculation. It operates by plotting two bands around the closing price of a stock, using the ATR as a measure of volatility.
Features:
ATR Calculation: The Average True Range is a commonly used metric to understand the volatility of an asset. The indicator calculates the ATR over a user-defined period, with the default being 14 periods.
ATR Bands: Using the ATR value, the script defines two bands:
Upper Band: This is calculated by adding the ATR value to the closing price of the stock. It represents a higher volatility boundary.
Lower Band: This is derived by subtracting the ATR value from the closing price. It indicates a lower volatility boundary.
Cloud Visualization: The space between the upper and lower bands is shaded to create a "cloud" on the chart. This cloud gives traders a clear visual cue of the stock's current volatility range. The cloud has an 80% transparency, allowing the underlying price chart to remain visible.
Customization: Users have the ability to adjust the period for the ATR calculation based on their preferences.
Usage:
Traders can use the ATR Clouds indicator to get a sense of the stock's volatility. Wider clouds indicate periods of higher volatility, while narrower clouds suggest lower volatility. This can be beneficial for se
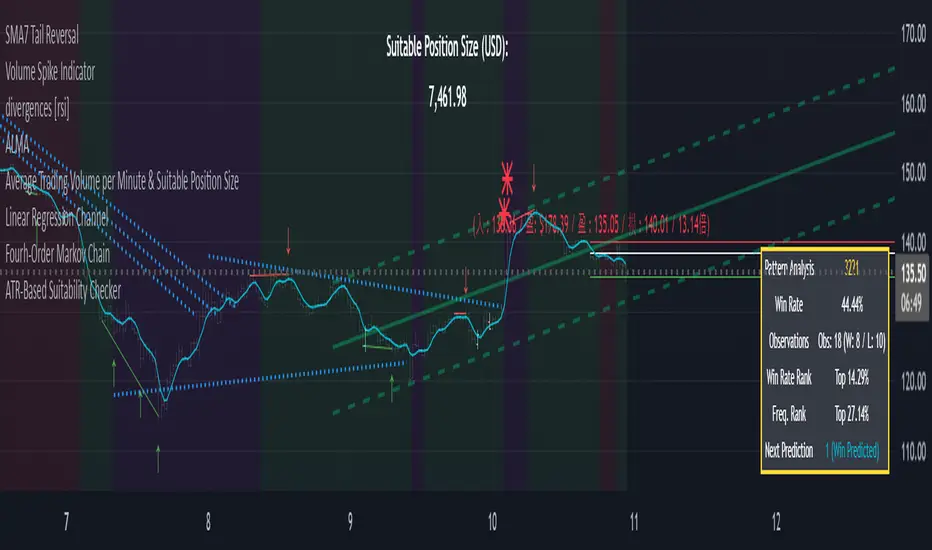
ATR-Based Suitability CheckerPurpose:
This indicator helps traders identify the most suitable timeframe for trading by comparing fees to market volatility (ATR). Instead of filtering out specific assets or strategies, it focuses on finding optimal trading conditions for the selected timeframe. It is designed to adapt dynamically, ensuring that traders can align their approach with the current market environment.
Key Features:
Dynamic ATR Analysis: Measures volatility using the Average True Range (ATR) and evaluates how fees impact potential profitability across timeframes.
Fee-to-ATR Ratio: Calculates the proportion of fees to ATR, highlighting conditions where fees are too large relative to price movements.
Visual Feedback: **Red Background:** Indicates unsuitable trading conditions where fees dominate. **Green Background:** Highlights suitable conditions for trading efficiency. Markers provide quick visual identification of suitability.
Custom Transparency: Enables users to adjust the background’s transparency for better chart visibility.
How to Use:
Timeframe Optimization: When volatility rises, price movements become larger, making shorter timeframes more suitable for trading. Conversely, during periods of low volatility, longer timeframes are preferable to avoid overtrading within a narrow price range.
Spot & Leverage Trading: For spot trading, this tool identifies conditions where fees (e.g., 0.25%-0.3%) might excessively impact profitability. For instance, if ATR is comparable to fees, the trading environment may not be ideal. In leveraged trading, the indicator helps assess whether the current volatility supports your chosen leverage level, ensuring that leverage does not amplify undue risks.
Efficiency Focus: The indicator emphasizes finding a balance between market conditions and your trading strategy. Not all timeframes need to be "suitable" at all times; instead, it highlights the best opportunities based on current market dynamics. Utilize the suitability ratio across different timeframes to guide and adjust your trading strategies effectively.
Input Parameters:
ATR Length: Defines the period for ATR calculation (default: 14).
Fee Percentage (%): Trading fee as a percentage of the closing price (default: 0.1%).
Unsuitable Threshold (% of 1 ATR): Sets the maximum acceptable fee-to-ATR ratio for suitable conditions (default: 20%).
Background Transparency (0-100): Adjusts the opacity of the background highlight (default: 80).
Who Should Use This:
This tool is ideal for traders seeking to align their strategy with market conditions by finding the most suitable timeframe. It applies to both spot and leveraged markets, helping optimize efficiency while managing fees and volatility.
Notes:
The ATR-Based Suitability Checker is a supplementary tool. Combine it with other forms of analysis for comprehensive decision-making.
Regularly adjust the parameters to match your trading preferences and market conditions.
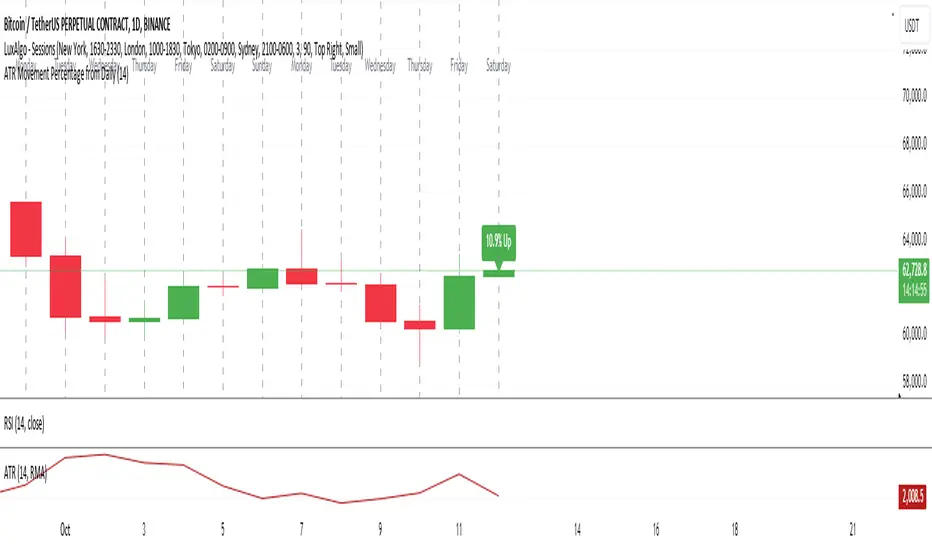
ATR Movement Percentage from Daily (Bal)Script Description: ATR Movement Percentage from Daily
The script titled "ATR Movement Percentage from Daily" is designed to help traders analyze the price movement of an asset in relation to its daily volatility, as represented by the Average True Range (ATR). Here's a breakdown of how the script works:
Key Features of the Script:
ATR Calculation:
The script allows the user to input the length of the ATR calculation (default is 14 periods).
It retrieves the daily ATR value using the request.security function, ensuring that the ATR is based on the daily timeframe, regardless of the current chart's timeframe.
Price Movement Calculation:
It calculates the opening price of the current day using request.security to ensure it is aligned with the daily timeframe.
It retrieves the current closing price and computes the price change from the opening price.
Movement Percentage:
The percentage of price movement relative to the daily ATR is calculated. This value helps traders understand how significant the current price movement is compared to the expected volatility for the day.
Direction of Movement:
The script determines the direction of the price movement (upward or downward) based on whether the price change is positive or negative.
Dynamic Label Display:
A label is created and updated to show the movement percentage and direction on the chart.
If the price movement is upward, the label is displayed in green; if downward, it is shown in red.
The label position updates with each new bar, keeping it relevant to the current price action.
Plotting Daily ATR:
The daily ATR value is plotted on the chart as a blue line, providing a visual reference for traders to see the volatility levels in relation to price movements.
Conclusion:
This script is particularly useful for traders who want to assess market conditions based on volatility. By understanding how much the price has moved in relation to the daily ATR, traders can make informed decisions about entry and exit points, and adjust their risk management strategies accordingly. The dynamic labeling feature enhances the usability of the script, allowing for quick visual assessments of market behavior.
ATR/ADR Support and Resistance LevelsATR/ADR Support and Resistance Levels Indicator
This script is designed to provide traders with precise ATR (Average True Range) and ADR (Average Daily Range) support and resistance levels. It can be effectively used to identify price breakouts or rejections near these critical lines and assist in confirming trend retests.
How It Works:
Support and Resistance Lines: The script plots ATR/ADR-based support and resistance lines, which can be toggled on or off.
Daily Data Integration: It incorporates daily open and close prices to enhance the accuracy of the support and resistance levels.
Clear Visuals: The indicator uses distinct colors for support (green) and resistance (red) levels, providing clear visual cues.
Default Settings: The default settings are optimized for most trading environments. Adjusting the ATR/ADR Length can fine-tune the indicator's responsiveness to market movements.
Key Features:
ATR & ADR Calculation: Choose between using ATR, ADR, or both. ATR is recommended for most scenarios.
Customizable Lengths: Adjust the ATR/ADR Length to refine the average calculation to your preference, with 14 being the standard value.
EMA for Market Bias: The EMA helps determine the ticker bias. It is colored green when the market is above the average price and red when it is below. This allows you to more easily determine whether or not the ADR/ATR levels are valid.
Versatile Usage: Suitable for various trading types, ensuring broad applicability across different market conditions.
How to Use:
ATR vs ADR: You should use ADR if you are day trading AND do not want to include gap data in the levels. It is recommended you use ATR.
Bounces off Levels: When price bounces off of a support/resistance level, it is very likely that price will respect this level. This indicates that price is unlikely to move beyond the ticker's average volatility. You should wait for an additional bounce to confirm.
Breakthroughs of Levels: When price breaks through a support/resistance level, it is very likely that price will continue beyond this level. This indicates that price has moved beyond that ticker's average volatility. You should wait for a bounce off the level to confirm.
This indicator is a valuable tool for traders seeking to enhance their technical analysis with support and resistance levels based on ATR and ADR calculations. It is perfect for identifying key price points and understanding market trends.

ATR with MAOVERVIEW
The Average True Range Moving Average (ATRMA) is a technical indicator that gauges the amount of volatility currently present in the market, relative to the historical average volatility that was present before. It adds a moving average to the Average True Range (ATR) indicator.
This indicator is extremely similar to the VOXI indicator, but instead of measuring volume, it measures volatility. Volume measures the amount of shares/lots/units/contracts exchanged per unit of time. Volatility, on the other hand, measures the range of price movement per unit of time.
The purpose of this indicator is to help traders filter between non-volatile periods in the market from volatile periods in the market without introducing subjectivity. It can also help long-term investors to determine market regime using volatility without introducing subjectivity.
CONCEPTS
This indicator assumes that trends are more likely to start during periods of high volatility, and consolidation is more likely to persist during periods of low volatility. The indicator also assumes that the average true range (ATR) of the last 14 candles is reflective of the current volatility in the market. ATR is the average height of all the candles, where height = |high - low|.
Suppose the ATR of the last 14 candles is greater than a moving average of the ATR(14) of the last 20 candles (this occurs whenever the indicator's filled region is colored BLUE). In that case, we can assume that the current volatility in the market is high.
Suppose the ATR of the last 14 candles is less than the moving average of the ATR(14) of the last 20 candles (this occurs whenever the indicator's filled region is colored RED). In that case, we can assume that the current volatility in the market is low.
HOW DO I READ THIS INDICATOR?
If the ATR line is above the ATR MA line (indicated by the blue color), the current volatility is greater than the historical average volatility.
If the ATR line is above the ATR MA line (indicated by the red color), the current volatility is less than the historical average volatility.
