IO_BB_WidthJohn Bollinger's academic version of Bollinger Bands width
Added some customizations around background colors.
If background color is colored, then the market is trending.
Buscar en scripts para "弘历投教boll指标代码分析"

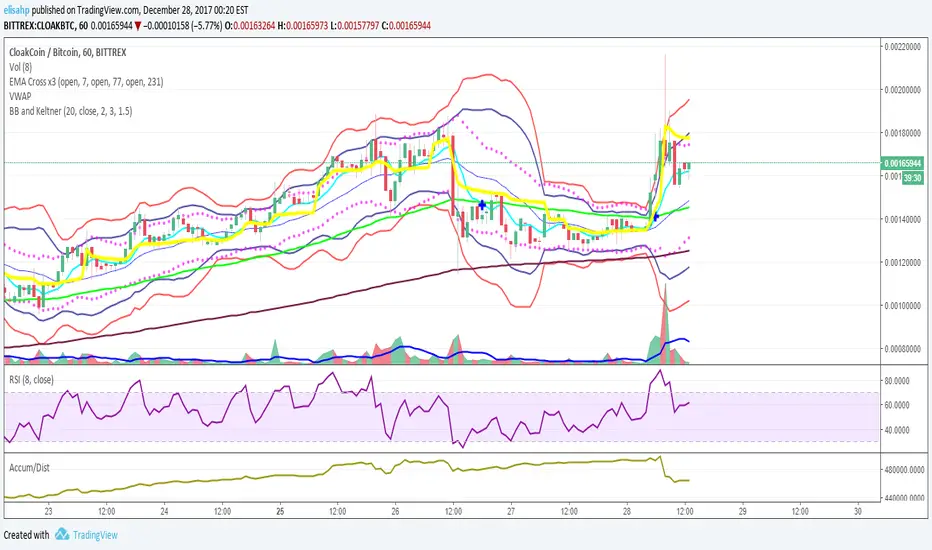
BB and KeltnerStrategy using the Bollinger band with the Keltner Channels. Watch for the Bollinger bands (blue/red lines) squeezing inside the Keltner Channels (pink dots) for a breakout - this could be up or down so use in conjunction with other indicators.
Moving Average Cross and/or Bbands botHello TradingView and world!
This is one of our latest concepts for an actual bot builder. This script comes with a bunch of features that we're hoping will alleviate a lot of the stress and confusion around using and building strategies here on TV. Especially if the end-goal is to automate the strategies using Autoview.
This is a combination of 2 strategies, and gives you full control of each component within the script.
The 2 strategies are:
2 Moving Averages == if close is greater than moving average and moving average 1 is greater than moving average 2
Bolling Bands == if close is less than lower or greater than upper
Features / Settings included :
- Ability to change settings from a commodity market (default) to an altcoin or forex market.
- Backtest time period selector component
- Heiken Ashi Candles on/off
- Moving Average Strategy on/off
- Bollinger Bands Strategy on/off
- Both Moving Average settings can be adjusted
- Bollinger Bands length and multiplier can be adjusted.
- Pyramiding Greater Than, Equal To, or Less Than
- Trailing Stop with the ability to set a price in which the Trailing Stop activate
- Take Profit on/off and editable
- Stop Loss on/off and editable
- Margin Call on/off dependent on Leverage which is editable
- If pyramiding is used, the strategy will calculate and display your average on the chart
- Profit and Loss visuals added to the chart
You can watch a video here on how all the settings can be used and work together.
www.youtube.com
You can learn more about Autoview here:
autoview.with.pink
Get your invite and join us in slack here:
slack.with.pink

Bollinger BandsThis strategy is inspired from Power of Stock aka Subhasish Panni.
Target is minimum 1:3 when you get this setup right.
Buy when:
1) Low is greater than upper band of BB and next candle breaks high of that candle, SL is Low of previous candle which is has low above upper band.
2) High is lower than lower band of BB and next candle breaks high of that candle, SL is low of previous candle which has high lower than lower band.
Sell when:
1) Low is greater than upper band of BB and next candle breaks low of that candle, SL is high of previous candle which is has low above upper band.
2) High is lower than lower band of BB and next candle breaks high of that candle, SL is high of previous candle which has high lower than lower band.
Disclaimer: this setup will cause many small stoploss hit, you have to accept that loss but you will be profitable because of R:R.

(JS) VWAP BandsThis is a pretty simple script here - I took the VWAP and combined it with Bollinger Bands.
The bands can vary a lot based on chart resolution, so I wanted to make sure the resolution could be modified so you can use the resolution you're most comfortable with, or find the most success with.
Length:
Length of bars used to calculate the bands.
Standard Deviation Band 1-3:
There's three bands all together, this option allows you to modify the number of standard deviations per band.
VWAP Period:
This modifies when you want the VWAP to begin (Session, Week, Month, Year).
Offset:
This moves the VWAP and the bands the amount of bars you select, default is of course set to zero.
Source:
This selects the source of calculation, HLC/3 is the default VWAP calculation.
This is a pretty self explanatory script, I thought being able to see the standard deviations of the VWAP could prove to be useful - hope you all like it!

BBPivotIt can helps you to see BB pivots . It's based on bollinger bands .
Best Settings: (20,3) - (50,2)
Cheers :)

VDUB BB %B REVERSAL_v4.2 revised by JustUncleLThis is an revised Open Public version of Vdub Bollinger Band %B reversal indicator. This version includes optional Divergence Finder with selectable channel width, optional Market Session time highlighting and optional Binary Option expiry markers.

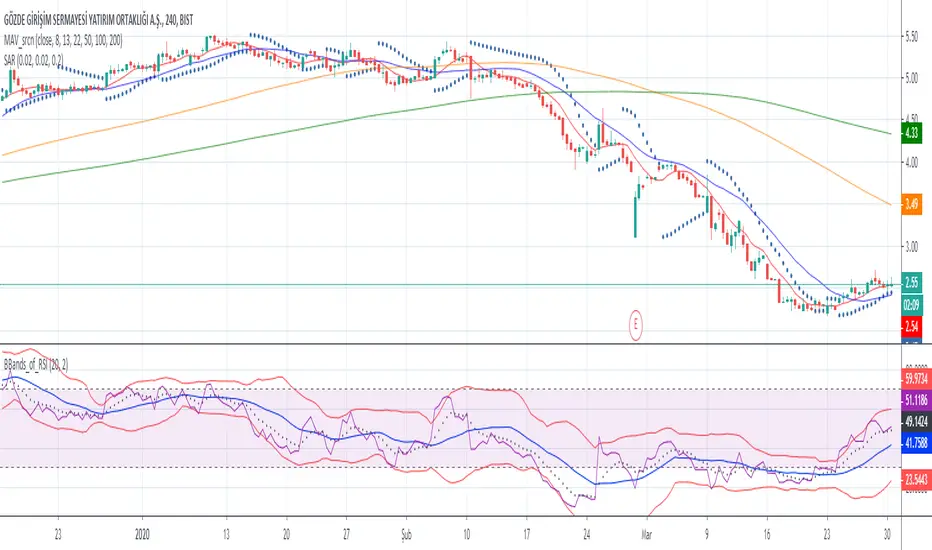
Bollinger Bands of RSIwith this script you can follow ema8 of RSI and also SMA20 of RSI with ∓ 2 standart deviation
Sunil BB Blast Heikin Ashi StrategySunil BB Blast Heikin Ashi Strategy
The Sunil BB Blast Heikin Ashi Strategy is a trend-following trading strategy that combines Bollinger Bands with Heikin-Ashi candles for precise market entries and exits. It aims to capitalize on price volatility while ensuring controlled risk through dynamic stop-loss and take-profit levels based on a user-defined Risk-to-Reward Ratio (RRR).
Key Features:
Trading Window:
The strategy operates within a user-defined time window (e.g., from 09:20 to 15:00) to align with market hours or other preferred trading sessions.
Trade Direction:
Users can select between Long Only, Short Only, or Long/Short trade directions, allowing flexibility depending on market conditions.
Bollinger Bands:
Bollinger Bands are used to identify potential breakout or breakdown zones. The strategy enters trades when price breaks through the upper or lower Bollinger Band, indicating a possible trend continuation.
Heikin-Ashi Candles:
Heikin-Ashi candles help smooth price action and filter out market noise. The strategy uses these candles to confirm trend direction and improve entry accuracy.
Risk Management (Risk-to-Reward Ratio):
The strategy automatically adjusts the take-profit (TP) level and stop-loss (SL) based on the selected Risk-to-Reward Ratio (RRR). This ensures that trades are risk-managed effectively.
Automated Alerts and Webhooks:
The strategy includes automated alerts for trade entries and exits. Users can set up JSON webhooks for external execution or trading automation.
Active Position Tracking:
The strategy tracks whether there is an active position (long or short) and only exits when price hits the pre-defined SL or TP levels.
Exit Conditions:
The strategy exits positions when either the take-profit (TP) or stop-loss (SL) levels are hit, ensuring risk management is adhered to.
Default Settings:
Trading Window:
09:20-15:00
This setting confines the strategy to the specified hours, ensuring trading only occurs during active market hours.
Strategy Direction:
Default: Long/Short
This allows for both long and short trades depending on market conditions. You can select "Long Only" or "Short Only" if you prefer to trade in one direction.
Bollinger Band Length (bbLength):
Default: 19
Length of the moving average used to calculate the Bollinger Bands.
Bollinger Band Multiplier (bbMultiplier):
Default: 2.0
Multiplier used to calculate the upper and lower bands. A higher multiplier increases the width of the bands, leading to fewer but more significant trades.
Take Profit Multiplier (tpMultiplier):
Default: 2.0
Multiplier used to determine the take-profit level based on the calculated stop-loss. This ensures that the profit target aligns with the selected Risk-to-Reward Ratio.
Risk-to-Reward Ratio (RRR):
Default: 1.0
The ratio used to calculate the take-profit relative to the stop-loss. A higher RRR means larger profit targets.
Trade Automation (JSON Webhooks):
Allows for integration with external systems for automated execution:
Long Entry JSON: Customizable entry condition for long positions.
Long Exit JSON: Customizable exit condition for long positions.
Short Entry JSON: Customizable entry condition for short positions.
Short Exit JSON: Customizable exit condition for short positions.
Entry Logic:
Long Entry:
The strategy enters a long position when:
The Heikin-Ashi candle shows a bullish trend (green close > open).
The price is above the upper Bollinger Band, signaling a breakout.
The previous candle also closed higher than it opened.
Short Entry:
The strategy enters a short position when:
The Heikin-Ashi candle shows a bearish trend (red close < open).
The price is below the lower Bollinger Band, signaling a breakdown.
The previous candle also closed lower than it opened.
Exit Logic:
Take-Profit (TP):
The take-profit level is calculated as a multiple of the distance between the entry price and the stop-loss level, determined by the selected Risk-to-Reward Ratio (RRR).
Stop-Loss (SL):
The stop-loss is placed at the opposite Bollinger Band level (lower for long positions, upper for short positions).
Exit Trigger:
The strategy exits a trade when either the take-profit or stop-loss level is hit.
Plotting and Visuals:
The Heikin-Ashi candles are displayed on the chart, with green candles for uptrends and red candles for downtrends.
Bollinger Bands (upper, lower, and basis) are plotted for visual reference.
Entry points for long and short trades are marked with green and red labels below and above bars, respectively.
Strategy Alerts:
Alerts are triggered when:
A long entry condition is met.
A short entry condition is met.
A trade exits (either via take-profit or stop-loss).
These alerts can be used to trigger notifications or webhook events for automated trading systems.
Notes:
The strategy is designed for use on intraday charts but can be applied to any timeframe.
It is highly customizable, allowing for tailored risk management and trading windows.
The Sunil BB Blast Heikin Ashi Strategy combines two powerful technical analysis tools (Bollinger Bands and Heikin-Ashi candles) with strong risk management, making it suitable for both beginners and experienced traders.
Feebacks are welcome from the users.

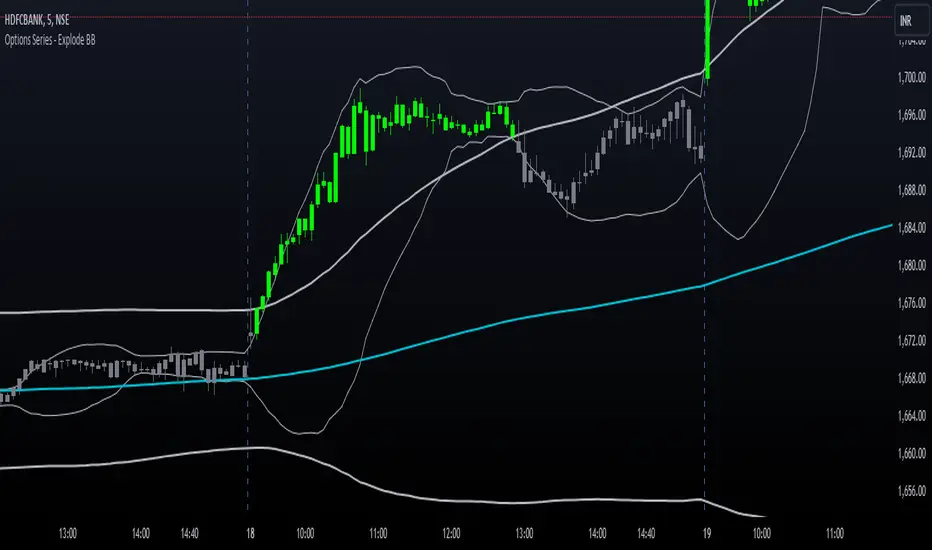
Options Series - Explode BB⭐ Bullish Zone:
⭐ Bearish Zone:
⭐ Neutral Zone:
The provided script integrates Bollinger Bands with different lengths (20 and 200 periods) and applies customized candle coloring based on certain conditions. Here's a breakdown of its importance and insights:
⭐ 1. Dual Bollinger Bands (BBs):
Bollinger Bands (BB) with 20-period length:
This is the standard setting for Bollinger Bands, with a 20-period simple moving average (SMA) as the central line and upper/lower bands derived from the standard deviation.
These bands are used to identify volatility. Wider bands indicate higher volatility, while narrower bands indicate low volatility.
200-period BB:
This is a longer-term indicator providing insight into the overall trend and long-term volatility.
The 200-period bands filter out noise and offer a "macro" view of price movements compared to the 20-period bands, which focus on short-term price actions.
⭐ 2. Overlay of Bollinger Bands and SMA:
The script plots the Bollinger Bands along with the SMA (Simple Moving Average) of the 200-period BB. This gives traders both a short-term (20-period) and long-term (200-period) perspective, which is valuable for detecting major trend shifts or key support and resistance zones.
Using multiple time frames (20-period for short-term and 200-period for long-term) can help traders spot both immediate opportunities and overarching trends.
⭐ 3. Candle Coloring Based on Key Conditions:
Bullish Signal (GreenFluroscent): When the price closes above the upper 200-period Bollinger Band, the candle turns green, indicating a potential bullish breakout.
Bearish Signal (RedFluroscent): If the price closes below the lower 200-period Bollinger Band, the candle turns red, suggesting a bearish breakout.
Neutral or Uncertain Market: Candles are gray when the price remains between the upper and lower bands, indicating a lack of a strong directional bias.
This color-coded visualization allows traders to quickly assess market sentiment based on the Bollinger Bands' extremes.
⭐ 4. Strategic Importance of the Setup:
Multi-timeframe Analysis: Combining short-term (20-period) and long-term (200-period) Bollinger Bands enables traders to assess the market's overall volatility and trend strength. The longer-term bands act as a reference for broader trend direction, while the shorter-term bands can signal shorter-term pullbacks or entry/exit points.
Breakout Identification: By color-coding the candles when prices cross either the upper or lower 200-period bands, the script makes it easier to spot potential breakouts. This can be particularly helpful in trading strategies that rely on volatility expansions or trend-following tactics.
⭐ 5. Customization and Flexibility:
Custom Colors: The script uses distinct fluorescent green and red colors to highlight key bullish and bearish conditions, providing clear visual cues.
Simplicity with Flexibility: Despite its simplicity, the script leaves room for customization, allowing traders to adjust the Bollinger Band multipliers or apply different conditions to candle coloring for more nuanced setups.
This script enhances standard Bollinger Band usage by introducing multi-timeframe analysis, breakout signals, and visual cues for trend strength, making it a powerful tool for both trend-following and mean-reversion strategies.
🚀 Conclusion:
This script effectively simplifies volatility analysis by visually marking bullish, bearish, and neutral zones, making it a robust tool for identifying trade opportunities across multiple timeframes. Its dual-band approach ensures both trend-following and mean-reversion strategies are supported.
MTF BB+KC Avg
Bollinger Bands (BB) are a widely used technical analysis created by John Bollinger in the early 1980’s. Bollinger Bands consist of a band of three lines which are plotted in relation to instrument prices. The line in the middle is usually a Simple Moving Average (SMA) set to a period of 20 days (The type of trend line and period can be changed by the trader; however a 20 day moving average is by far the most popular). This indicator does not plot the middle line. The Upper and Lower Bands are used as a way to measure volatility by observing the relationship between the Bands and price. Typically the Upper and Lower Bands are set to two standard deviations away from the middle line, however the number of standard deviations can also be adjusted in the indicator.
Keltner Channels (KC) are banded lines similar to Bollinger Bands and Moving Average Envelopes. They consist of an Upper Envelope above a Middle Line (not plotted in this indicator) as well as a Lower Envelope below the Middle Line. The Middle Line is a moving average of price over a user-defined time period. Either a simple moving average or an exponential moving average are typically used. The Upper and Lower Envelopes are set a (user-defined multiple) of a range away from the Middle Line. This can be a multiple of the daily high/low range, or more commonly a multiple of the Average True Range.
This indicator is built on AVERAGING the BB and KC values for each bar, so you have an efficient metric of AVERAGE volatility. The indicator visualizes changes in volatility which is of course dynamic.
What to look for
High/Low Prices
One thing that must be understood about this indicator's plots is that it averages by adding BB levels to KC levels and dividing by 2. So the plots provide a relative definition of high and low from two very popular indicators. Prices are almost always within the upper and lower bands. Therefore, when prices move up near the upper or lower bands or even break through the band, many traders would see that price action as OVER-EXTENDED (either overbought or oversold, as applicable). This would preset a possible selling or buying opportunity.
Cycling Between Expansion and Contraction
Volatility can generally be seen as a cycle. Typically periods of time with low volatility and steady or sideways prices (known as contraction) are followed by period of expansion. Expansion is a period of time characterized by high volatility and moving prices. Periods of expansion are then generally followed by periods of contraction. It is a cycle in which traders can be better prepared to navigate by using Bollinger Bands because of the indicators ability to monitor ever changing volatility.
Walking the Bands
Of course, just like with any indicator, there are exceptions to every rule and plenty of examples where what is expected to happen, does not happen. Previously, it was mentioned that price breaking above the Upper Band or breaking below the Lower band could signify a selling or buying opportunity respectively. However this is not always the case. “Walking the Bands” can occur in either a strong uptrend or a strong downtrend.
During a strong uptrend, there may be repeated instances of price touching or breaking through the Upper Band. Each time that this occurs, it is not a sell signal, it is a result of the overall strength of the move. Likewise during a strong downtrend there may be repeated instances of price touching or breaking through the Lower Band. Each time that this occurs, it is not a buy signal, it is a result of the overall strength of the move.
Keep in mind that instances of “Walking the Bands” will only occur in strong, defined uptrends or downtrends.
Inputs
TimeFrame
You can select any timeframe froom 1 minute to 12 months for the bar measured.
Length of the internal moving averages
You can select the period of time to be used in calculating the moving averages which create the base for the Upper and Lower Bands. 20 days is the default.
Basis MA Type
Determines the type of Moving Average that is applied to the basis plot line. Default is SMA and you can select EMA.
Source
Determines what data from each bar will be used in calculations. Close is the default.
StdDev/Multiplier
The number of Standard Deviations (for BB) or Multiplier (for KC) away from the moving averages that the Upper and Lower Bands should be. 2 is the default value for each indicator.

Tristan's Tri-band StrategyTristan's Tri-band Strategy - Confluence Trading System
Strategy Overview:
This strategy combines three powerful technical indicators - RSI, Williams %R, and Bollinger Bands - into a single visual trading system. Instead of cluttering your chart with separate indicator panels, all signals are displayed directly on the price chart using color-coded gradient overlays, making it easy to spot high-probability trade setups at a glance.
How It Works:
The strategy identifies trading opportunities when multiple indicators align (confluence), suggesting strong momentum shifts:
📈 Long Entry Signals:
RSI drops to 30 or below (oversold)
Williams %R reaches -80 to -100 range (oversold)
Price touches or breaks below the lower Bollinger Band
All three conditions must align during your selected trading session
📉 Short Entry Signals:
RSI rises to 70 or above (overbought)
Williams %R reaches 0 to -20 range (overbought)
Price touches or breaks above the upper Bollinger Band
All three conditions must align during your selected trading session
Visual Indicators:
(faint) Green gradients below candles = Bullish oversold conditions (buying opportunity)
(faint) Red/Orange gradients above candles = Bearish overbought conditions (selling opportunity)
Stacked/brighter gradients = Multiple indicators confirming the same signal (higher probability) will stack and show brighter / less faint
Blue Bollinger Bands = Volatility boundaries and mean reversion zones
Exit Strategy:
Long trades exit when price reaches the upper Bollinger Band OR RSI becomes overbought (≥70)
Short trades exit when price reaches the lower Bollinger Band OR RSI becomes oversold (≤30)
Key Features:
✅ Session Filters - Trade only during NY (9:30 AM-4 PM), London (3 AM-11:30 AM), or Asia (7 PM-1 AM EST) sessions
✅ No Repainting - Signals are confirmed on candle close for realistic backtesting and live trading
✅ Customizable Parameters - Adjust RSI levels, BB standard deviations, Williams %R periods, and gradient visibility
✅ Visual Clarity - See all three indicators at once without switching between panels
✅ Built-in Alerts - Get notified when entry and exit conditions are met
How to Use Effectively:
Choose Your Trading Session - For day trading US stocks, enable only the NY session. For forex or 24-hour markets, select the sessions that match your schedule.
Look for Gradient Stacking - The brightest, most visible gradients occur when both RSI and Williams %R signal together. These are your highest-probability setups.
Confirm with Price Action - Wait for the candle to close before entering. The strategy enters on the next bar's open to prevent repainting.
Respect the Bollinger Bands - Entries occur at the outer bands (price extremes), and exits occur at the opposite band or when momentum reverses.
Backtest First - Test the strategy on your preferred instruments and timeframes. Works best on liquid assets with clear trends and mean reversion patterns (stocks, major forex pairs, indices).
Adjust Gradient Visibility - Use the "Gradient Strength" slider (lower = more visible) to make signals stand out on your chart style.
Best Timeframes: 5-minute to 1-hour charts for intraday trading; 4-hour to daily for swing trading (I have also found the 3 hour timeframe to work really well for some stocks / ETFs.)
Best Markets: Liquid instruments with volatility - SPY, QQQ, major stocks, EUR/USD, GBP/USD, major indices
Risk Management: This is a mean reversion strategy that works best in ranging or choppy markets. In strong trends, signals may appear less frequently. Always use proper position sizing and stop losses based on your risk tolerance.
----------------------------------------------
Note: Past performance does not guarantee future results. This strategy is provided for educational purposes. Always backtest thoroughly and practice proper risk management before live trading.RetryClaude can make mistakes. Please double-check responses. Sonnet 4.5

Price Volume Trend [sgbpulse]1. Introduction: What is Price Volume Trend (PVT)?
The Price Volume Trend (PVT) indicator is a powerful technical analysis tool designed to measure buying and selling pressure in the market based on price changes relative to trading volume. Unlike other indicators that focus solely on volume or price, PVT combines both components to provide a more comprehensive picture of trend strength.
How is it Calculated?
The PVT is calculated by adding or subtracting a proportional part of the daily volume from a cumulative total.
When the closing price rises, a proportional part of the daily volume (based on the percentage price change) is added to the previous PVT value.
When the closing price falls, a proportional part of the daily volume is subtracted from the previous PVT value.
If there is no change in price, the PVT value remains unchanged.
The result of this calculation is a cumulative line that rises when buying pressure is strong and falls when selling pressure dominates.
2. Why PVT? Comparison to Similar Indicators
While other indicators measure volume-price pressure, PVT offers a unique advantage:
PVT vs. On-Balance Volume (OBV):
OBV simply adds or subtracts the entire day's volume based on the closing direction (up/down), regardless of the magnitude of the price change. This means a 0.1% price change is treated the same as a 10% change.
PVT, on the other hand, gives proportional weight to volume based on the percentage price change. A trading day with a large price increase and high volume will impact the PVT significantly more than a small price increase with the same volume. This makes PVT more sensitive to trend strength and changes within it.
PVT vs. Accumulation/Distribution Line (A/D Line):
The A/D Line focuses on the relationship between the closing price and the bar's trading range (Close Location Value) and multiplies it by volume. It indicates whether the pressure is buying or selling within a single bar.
PVT focuses on the change between closing prices of consecutive bars, multiplying this by volume. It better reflects the flow of money into or out of an asset over time.
By combining volume with percentage price change, PVT provides deeper insights into trend confirmation, identifying divergences between price and volume, and spotting signs of weakness or strength in the current trend.
3. Indicator Settings (Inputs)
The "Price Volume Trend " indicator offers great flexibility for customization to your specific needs through the following settings:
Moving Average Type: Allows you to select the type of moving average used for the central line on the PVT. Your choice here will affect the line's responsiveness to PVT movements.
- "None" : No moving average will be displayed on the PVT.
- "SMA" (Simple Moving Average): A simple average, smoother, ideal for identifying longer-term trends in PVT.
- "SMA + Bollinger Bands": This unique option not only displays a Simple Moving Average but also activates the Bollinger Bands around the PVT. This is the recommended option for analyzing volatility and ranges using Bollinger Bands.
- "EMA" (Exponential Moving Average): An exponential average, giving more weight to recent data, responding faster to changes in PVT.
- "SMMA (RMA)" (Smoothed Moving Average): A smoothed average, providing extra smoothing, less sensitive to noise.
- "WMA" (Weighted Moving Average): A weighted average, giving progressively more weight to recent data, responding very quickly to changes in PVT.
Moving Average Length: Defines the number of bars used to calculate the moving average (and, if applicable, the standard deviation for the Bollinger Bands). A lower value will make the line more responsive, while a higher value will smooth it out.
PVT BB StdDev (Bollinger Bands Standard Deviation): Determines the width of the Bollinger Bands. A higher value will result in wider bands, making it less likely for the PVT to cross them. The standard value is 2.0.
4. Visual Aid: Current PVT Level Line
This indicator includes a unique and highly useful visual feature: a dynamic horizontal line displayed on the PVT graph.
Purpose: This line marks the exact level of the PVT on the most recent trading bar. It extends across the entire chart, allowing for a quick and intuitive comparison of the current level to past levels.
Why is it Important?
- Identifying Divergences: Often, an asset's price may be lower or higher than past levels, but the PVT level might be different. This auxiliary line makes it easy to spot situations where PVT is at a higher level when the price is lower, or vice-versa, which can signal potential trend changes (e.g., higher PVT than in the past while price is low could indicate strong accumulation).
- Quick Direction Indication: The line's color changes dynamically: it will be green if the PVT value on the last bar has increased (or remained the same) relative to the previous bar (indicating positive buying pressure), and red if the PVT value has decreased relative to the previous bar (indicating selling pressure). This provides an immediate visual cue about the direction of the cumulative momentum.
5. Important Note: Trading Risk
This indicator is intended for educational and informational purposes only and does not constitute investment advice or a recommendation for trading in any form whatsoever.
Trading in financial markets involves significant risk of capital loss. It is important to remember that past performance is not indicative of future results. All trading decisions are your sole responsibility. Never trade with money you cannot afford to lose.

Smart Mean Reversion DashboardThis indicator is designed to help traders identify potential mean reversion opportunities using a combination of Bollinger Bands, RSI, and deviation from the moving average. It provides a clean, visually appealing dashboard that displays key metrics and signals in real-time.
How to Read and Use:
Deviation from Mean:
Displays the percentage deviation of the current price from the moving average.
A high positive or negative deviation may indicate overextension and a potential mean reversion opportunity.
Bollinger Band Status:
Indicates whether the price is inside or outside the Bollinger Bands.
"Outside Upper" suggests overbought conditions, while "Outside Lower" suggests oversold conditions.
RSI Status:
Shows whether the RSI is in overbought (>70), oversold (<30), or neutral conditions.
Overbought and oversold levels can confirm potential reversal zones.
Signal:
BUY: Triggered when the price is outside the lower Bollinger Band and RSI is in the oversold zone.
SELL: Triggered when the price is outside the upper Bollinger Band and RSI is in the overbought zone.
WAIT: No clear signal; wait for better conditions.
Important Notes:
This is NOT a buy or sell recommendation. This indicator is a tool to assist in identifying potential trading opportunities. Always use it in conjunction with your own analysis and risk management.
The signals generated by this indicator are based on historical data and do not guarantee future performance.
It is recommended to use this indicator alongside other technical analysis tools and confirm signals with price action or other strategies.
Features:
Dashboard: Displays deviation, Bollinger Band status, RSI status, and signals in a clean, movable interface.
Customizable Settings: Adjust Bollinger Band length, RSI length, and moving average length to suit your trading style.
Visual Enhancements: Color-coded signals and metrics for easy interpretation in both light and dark modes.
Disclaimer:
Trading involves significant risk, and past performance is not indicative of future results. This indicator is for educational purposes only and should not be considered financial advice. Always consult with a financial advisor before making trading decisions.

BBVOL SwiftEdgeBBVOL SwiftEdge – Precision Scalping with Volume and Trend Filtering
Optimized for scalping and short-term trading on fast-moving markets (e.g., 1-minute charts), BBVOL SwiftEdge combines Bollinger Bands, Heikin Ashi smoothing, volume momentum, and EMA trend alignment to deliver actionable buy/sell signals with visual trend cues. Ideal for forex, crypto, and stocks.
What Makes BBVOL SwiftEdge Unique?
Unlike traditional Bollinger Bands scripts that focus solely on price volatility, BBVOL SwiftEdge enhances signal precision by:
Using Heikin Ashi to filter out noise and confirm trend direction, reducing false signals in choppy markets.
Incorporating volume analysis to ensure signals align with significant buying or selling pressure (customizable thresholds).
Adding an EMA overlay to keep trades in sync with the short-term trend.
Coloring candlesticks (green for bullish, red for bearish, purple for consolidation) to visually highlight market conditions at a glance.
How Does It Work?
Buy Signal: Triggers when price crosses above the lower Bollinger Band, Heikin Ashi shows bullish momentum (close > open), buy volume exceeds your set threshold (default 30%), and price is above the EMA. A green triangle appears below the candle.
Sell Signal: Triggers when price crosses below the upper Bollinger Band, Heikin Ashi turns bearish (close < open), sell volume exceeds the threshold (default 30%), and price is below the EMA. A red triangle appears above the candle.
Trend Visualization: Candles turn green when price is significantly above the Bollinger Bands’ basis (indicating a bullish trend), red when below (bearish trend), or purple when near the basis (consolidation), based on a customizable threshold (default 10% of BB width).
Risk Management: Each signal calculates a stop-loss (10% beyond the opposite band) and take-profit (opposite band), plotted for reference.
How to Use It
Timeframe: Best on 1-minute to 5-minute charts for scalping; test higher timeframes for swing trading.
Markets: Works well in volatile markets like forex pairs (e.g., EUR/USD), crypto (e.g., BTC/USD), or liquid stocks.
Customization: Adjust Bollinger Bands length (default 10), multiplier (default 1.2), volume thresholds (default 30%), EMA length (default 3), and consolidation threshold (default 0.1%) to match your strategy.
Interpretation: Look for green/red triangles as entry signals, confirmed by candle colors. Purple candles suggest caution—wait for a breakout. Use stop-loss/take-profit levels for trade management.
Underlying Concepts
Bollinger Bands: Measures volatility and identifies overbought/oversold zones.
Heikin Ashi: Smooths price action to emphasize trend direction.
Volume Momentum: Calculates cumulative buy/sell volume percentages to confirm market strength (e.g., buyVolPercent = buyVolume / totalVolume * 100).
EMA: A fast-moving average (default length 3) ensures signals align with the immediate trend.
Chart Setup
The chart displays Bollinger Bands (orange), Heikin Ashi close (green circles), EMA (purple), and volume-scaled lines (lime/red). Signals are marked with triangles, and candle colors reflect trend state. Keep the chart clean by focusing on these outputs for clarity.

Spread Entry Balance of PowerThis is a bar chart showing the strength of a potential option spread entry using 8 conditions for each side of a trade, bull or bear.
In theory, if the SE Strength (Spread Entry Strength) is at one of the extremes of the Bear or Bull side, then a spread is prime for entry.
To calculate this, the 8 conditions receive a 1 or zero dependent on whether the condition is true (1) or false (0), and then all of those are summed. The primary gist of the strength comes from Nishant's book, or my interpretation thereof, with some additives that limits what I need to review (such as condition 8 below.)
The 8 Bull Conditions are:
1) Bollinger Bands are outside of the Keltner Channels
2) ADX is trending up
3) RSI is trending up
4) -DI is trending down
5) RSI is under 30
6) Price is below the lower Keltner Channel
7) Price is between the lower Bollinger Band and the Bollinger basis.
8) Price at one point within the last 5 bars was below the lower Bollinger Band
The 8 Bear Conditions are the inverse conditions (except the first), and the conditions are given a negative disposition (meaning they sum to -8 :)):
1) Bollinger Bands are outside of the Keltner Channels
2) ADX is trending down
3) RSI is trending down
4) +DI is trending up
5) RSI is over 70
6) Price is above the upper Keltner Channel
7) Price is between the upper Bollinger Band and the Bollinger basis.
8) Price at one point within the last 5 bars was above the upper Bollinger Band

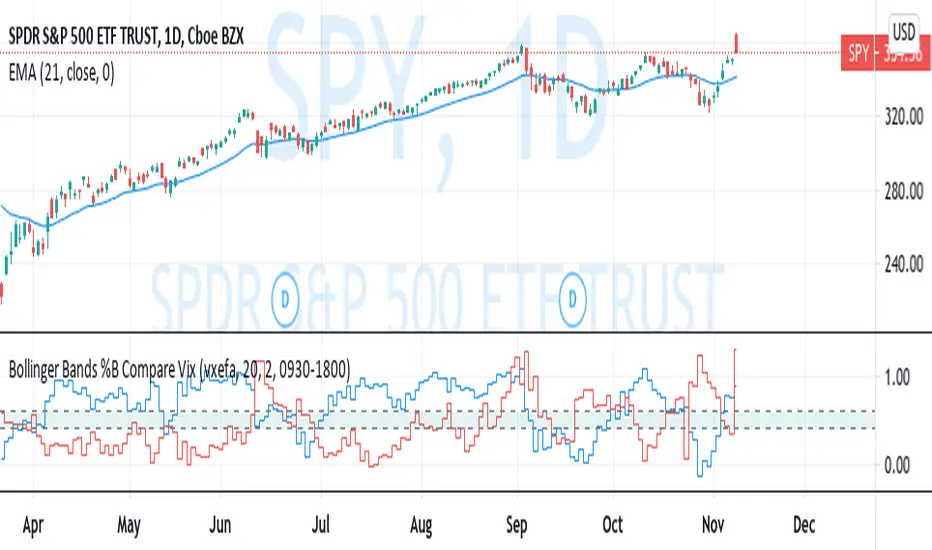
Bollinger Bands %B Compare VixThis imple script converts your chosen chart price and outputs it as a percentage in relation to the Vix percentage.
If price (Blue line) is higher than 0.60 and vix (Red Line) is lower than 0. 40 then there is lower volatility and this is good for buying.
If price (Blue line) is lower than 0. 40 and vix (Red Line) is higher than 0.60 then there is higher volatility and this is good for selling, exiting and cash only.
If you like risk you can enter as soon as the price and vix cross in either direction
This is my first script, please give me a lot of critique, I won't cry hahaha :)
For greater accuracy, you use these Vix products for their specific stocks/Indicies:
Apple - VXAPL
Google - VXGOG
Amazon - CBOE:VXAZN
IBM - CBOE:VXIBM
Goldman Sachs - CBOE:VXGS
NASDAQ 100 = CBOE:VXN
SP100 - CBOE:VXO
SP500 (3months) - VIX3M
XLE(energy sector) - CBOE:VXXLE
EWZ(brazil etf) - VXEWZ
EEM( emerging markets etf) - CBOE:VXEEM
EFA (MSCI ETF) - CBOE:VXEFA
FXI (Cina ETF) - CBOE:VXFXI
Trading Strategy based on BB/KC squeeze**** [Edit: New version (v02) posted, see the comments section for the code *****
Simple strategy. You only consider taking a squeeze play when both the upper and lower Bollinger Bands go inside the Keltner Channel. When the Bollinger Bands (BOTH lines) start to come out of the Keltner Channel, the squeeze has been released and a move is about to take place.
I have added more support indicators -- I highlight the bullish / bearish KC breaches (using GREEN/RED crosses) and a SAR to see where price action is trending.
Appreciate any feedback. Enjoy!
Color codes for v02:
----------------------------
When both the upper and lower Bollinger Bands go inside the Keltner Channel, the squeeze is on and is highlighted in RED.
When the Bollinger Bands (BOTH lines) start to come out of the Keltner Channel, the squeeze has been released and is highlighted in GREEN.
When one of the Bollinger Bands is out of Keltner Channel, no highlighting is done (this means, the background color shows up, so don't get confused if you have RED/GREEN in your chart's bground :))
Color codes for v01:
----------------------------
When both the upper and lower Bollinger Bands go inside the Keltner Channel, the squeeze is on and is highlighted in YELLOW.
When the Bollinger Bands (BOTH lines) start to come out of the Keltner Channel, the squeeze has been released and is highlighted in BLUE.

Triple SuperTrend + RSI + Fib BBTriple SuperTrend + RSI + Fibonacci Bollinger Bands Strategy
📊 Overview
This advanced trading strategy combines the power of three SuperTrend indicators with RSI confirmation and Fibonacci Bollinger Bands to generate high-probability trade signals. The strategy is designed to capture strong trending moves while filtering out false signals through multi-indicator confluence.
🔧 Core Components
Three SuperTrend Indicators
The strategy uses three SuperTrend indicators with progressively longer periods and multipliers:
SuperTrend 1: 10-period ATR, 1.0 multiplier (fastest, most sensitive)
SuperTrend 2: 11-period ATR, 2.0 multiplier (medium sensitivity)
SuperTrend 3: 12-period ATR, 3.0 multiplier (slowest, most stable)
This layered approach ensures that all three timeframe perspectives align before generating a signal, significantly reducing false entries.
RSI Confirmation (7-period)
The Relative Strength Index acts as a momentum filter:
Long signals require RSI > 50 (bullish momentum)
Short signals require RSI < 50 (bearish momentum)
This prevents entries during weak or divergent price action.
Fibonacci Bollinger Bands (200, 2.618)
Uses a 200-period Simple Moving Average with 2.618 standard deviation bands (Fibonacci ratio). These bands serve dual purposes:
Visual representation of price extremes
Automatic exit trigger when price reaches overextended levels
📈 Entry Logic
LONG Entry (BUY Signal)
A LONG position is opened when ALL of the following conditions are met simultaneously:
All three SuperTrend indicators turn green (bullish)
RSI(7) is above 50
This is the first bar where all conditions align (no repainting)
SHORT Entry (SELL Signal)
A SHORT position is opened when ALL of the following conditions are met simultaneously:
All three SuperTrend indicators turn red (bearish)
RSI(7) is below 50
This is the first bar where all conditions align (no repainting)
🚪 Exit Logic
Positions are automatically closed when ANY of these conditions occur:
SuperTrend Color Change: Any one of the three SuperTrend indicators changes direction
Fibonacci BB Touch: Price reaches or exceeds the upper or lower Fibonacci Bollinger Band (2.618 standard deviations)
This dual-exit approach protects profits by:
Exiting quickly when trend momentum shifts (SuperTrend change)
Taking profits at statistical price extremes (Fib BB touch)
🎨 Visual Features
Signal Arrows
Green Up Arrow (BUY): Appears below the bar when long entry conditions are met
Red Down Arrow (SELL): Appears above the bar when short entry conditions are met
Yellow Down Arrow (EXIT): Appears above the bar when exit conditions are met
Background Coloring
Light Green Tint: All three SuperTrends are bullish (uptrend environment)
Light Red Tint: All three SuperTrends are bearish (downtrend environment)
SuperTrend Lines
Three colored lines plotted with varying opacity:
Solid line (ST1): Most responsive to price changes
Semi-transparent (ST2): Medium-term trend
Most transparent (ST3): Long-term trend structure
Dashboard
Real-time information panel showing:
Individual SuperTrend status (UP/DOWN)
Current RSI value and color-coded status
Current position (LONG/SHORT/FLAT)
Net Profit/Loss
⚙️ Customizable Parameters
SuperTrend Settings
ATR periods for each SuperTrend (default: 10, 11, 12)
Multipliers for each SuperTrend (default: 1.0, 2.0, 3.0)
RSI Settings
RSI length (default: 7)
RSI source (default: close)
Fibonacci Bollinger Bands
BB length (default: 200)
BB multiplier (default: 2.618)
Strategy Options
Enable/disable long trades
Enable/disable short trades
Initial capital
Position sizing
Commission settings
💡 Strategy Philosophy
This strategy is built on the principle of confluence trading - waiting for multiple independent indicators to align before taking a position. By requiring three SuperTrend indicators AND RSI confirmation, the strategy filters out the majority of low-probability setups.
The multi-timeframe SuperTrend approach ensures that short-term, medium-term, and longer-term trends are all in agreement, which typically occurs during strong, sustainable price moves.
The exit strategy is equally important, using both trend-following logic (SuperTrend changes) and mean-reversion logic (Fibonacci BB touches) to adapt to different market conditions.
📊 Best Use Cases
Trending Markets: Works best in markets with clear directional bias
Higher Timeframes: Designed for 15-minute to daily charts
Volatile Assets: SuperTrend indicators excel in assets with clear trends
Swing Trading: Hold times typically range from hours to days
⚠️ Important Notes
No Repainting: All signals are confirmed and will not change on historical bars
One Signal Per Setup: The strategy prevents duplicate signals on consecutive bars
Exit Protection: Always exits before potentially taking an opposite position
Visual Clarity: All three SuperTrend lines are visible simultaneously for transparency
🎯 Recommended Settings
While default parameters are optimized for general use, consider:
Crypto/Volatile Markets: May benefit from slightly higher multipliers
Forex: Default settings work well for major pairs
Stocks: Consider longer BB periods (250-300) for daily charts
Lower Timeframes: Reduce all periods proportionally for scalping
📝 Alerts
Built-in alert conditions for:
BUY signal triggered
SELL signal triggered
EXIT signal triggered
Set up notifications to never miss a trade opportunity!
Disclaimer: This strategy is for educational and informational purposes only. Past performance does not guarantee future results. Always backtest thoroughly and practice proper risk management before live trading.

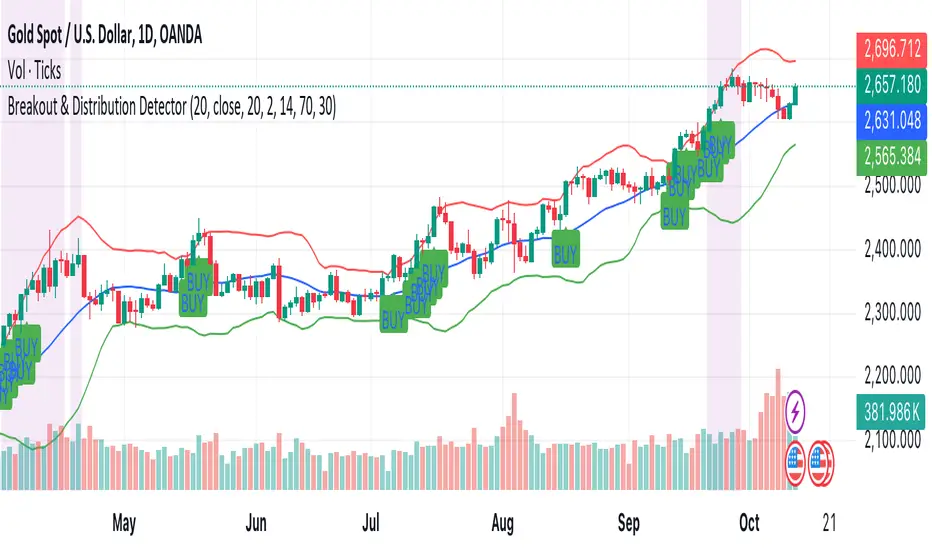
Breakout & Distribution DetectorHow the Script Works:
1. Bollinger Bands:
• The upper and lower Bollinger Bands are used to detect volatility and potential breakouts. When the price closes above the upper band, it’s considered a bullish breakout. When the price closes below the lower band, it’s a bearish breakout.
2. RSI (Relative Strength Index):
• The RSI is used for momentum confirmation. A bullish breakout is confirmed if the RSI is above 50, and a bearish breakout is confirmed if the RSI is below 50.
• If the RSI enters overbought (above 70) or oversold (below 30) levels, it signals a distribution phase, indicating the market may be ready to reverse or consolidate.
3. Moving Average:
• A simple moving average (SMA) of 20 periods is used to ensure we’re trading in the direction of the trend. Breakouts above the upper Bollinger Band are valid if the price is above the SMA, while breakouts below the lower Bollinger Band are valid if the price is below the SMA.
4. Signals and Alerts:
• BUY Signal: A green “BUY” label appears below the candle if a bullish breakout is detected.
• SELL Signal: A red “SELL” label appears above the candle if a bearish breakout is detected.
• Distribution Phase: The background turns purple if the market enters a distribution phase (RSI in overbought or oversold territory).
• Alerts: You can set alerts based on these conditions to get notifications for breakouts or when the market enters a distribution phase.
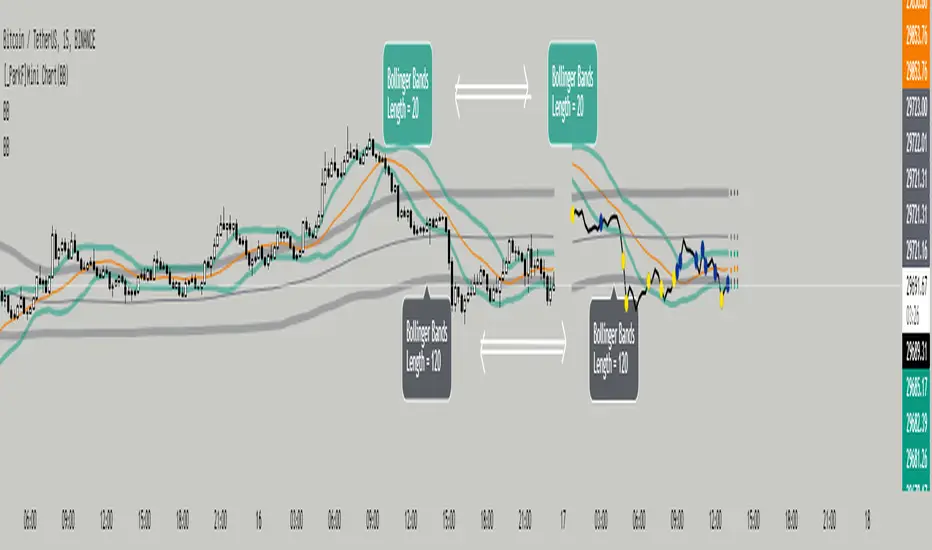
[_ParkF]Mini Chart(BB)Bollinger Bands of different lengths are displayed with a line chart in front of the candle.
A Bollinger band with a length of 20 and a Bollinger band with a length of 120 can be easily identified by the circle and color displayed whenever the line passes.
In the input menu, you can edit the length and deviation of the Bollinger band, the number of candles to be displayed in front, the thickness of the line, the color, and the color of the circle.
And the expected value of each Bollinger band was measured and displayed.
You can change the thickness and color of the displayed predictive circle in Predictive of the input menu.
-------------------------------------------------------------------------------------------------------------------------------------------------------------------------------------------------------------------------------------------
서로 다른 기간값을 가진 볼린저밴드를 캔들보다 앞쪽에 선 차트와 함께 표시하였습니다.
20의 기간값을 가진 볼린저밴드와 120의 기간값을 가진 볼린저밴드를 선차트가 크로스할 때 마다 표시되는 점과 색을 통해 쉽게 식별할 수 있습니다.
input 메뉴에서 볼린저밴드의 기간값과 편차, 앞 쪽에 표시될 캔들의 수와 선의 두께, 색상, 점의 색상을 수정할 수 있습니다.
그리고 각 볼린저밴드의 예상 값을 측정하여 표시하였습니다.
input 메뉴의 Predictive에서 표시된 Predictive circle의 두께와 색상을 변경할 수 있습니다.
Zig Lines with Percent & ValueOverview, Features, and Usage:
The Zig Lines with Percent & Value is an indicator that highlights the highest and lowest points of the market from pivot points and zigzag lines based on the ZigZag Period setting. By a default value of 13 for the ZigZag Period this works well on Bitcoin or other alt coins on the 1 hour or higher timeframe charts.
What makes this indicator unique is that it draws a green line to signify an uptrend or a red line to signify a down trend. It will also show the percent difference between the previous point/line, for example: If you see a -negative percentage point with a red line drawn to it, then you are looking at a low pivot point and then as the green line is drawn to a +positive percentage value the percentage you see is the difference between the two points. This is great to see a trend reversal as you can look at previous pivot points and notice about how far the price moves before it changes direction (trend reversal).
There is an invisible EMA line that is used to assist with coloring the negative vs positive values. The value above or below the percentage is the lowest or highest price at that pivot point . The display of the price at the pivot point depends on your ZigZag Period setting and the timeframe of your chart.
Added Bollinger Bands as it fits perfectly with the visuals of the Zig Lines & Pivots.
Usage of Bollinger Bands:
~As the price or candle gets close to the top or bottom of the Bollinger band it can give you a better confirmation that the pivot location is at it's final place, and the trend is more likely to switch directions.
It’s important to know this indicator should not be used for alerts of any type it does repaint as the green or red line is drawing based on live chart data and it can change depending on the direction of the market. This is a great visual tool for trend analysis or to be used with other indicators as a confirmation for a possible good entry or exit position.
Credits ( and consent to use ):
Credits go to user LonesomeTheBlue for creation of this 'Double Zig Zag with HHLL' script.
The addition of the Value above/below the Percentages is from user Noldo and that script is found here:
The Bollinger Bands setup was suggested by user countseven12 and his script that uses the same BB setup is found here:
References:
1. Chen, James. (2021 March 15). Zig Zag Indicator . Received from http: www.investopedia.com
2. Mitchell, Cory. (2021 April 30). Pivot Points . Received from http: www.investopedia.com

Inverse BandsThis was the result of quite some time spent examining how much information could be gleamed by studying the interactions between Keltner Channels, STARC Bands and Bollinger Bands. I was surprised by the results.
First of all, there are four fills that are black. Set the transparency of those to 0 and you'll see this indicator the way that it's meant to be seen. Those fills belong to unused sections of the Bollinger Bands.
There are two clouds which represent STARC Bands and the Keltner Channel. There is some delay when they flip from bullish (green) to bearish (red), but they are indicative of the trend. The space between them is black and the narrower that space is, the greater volatility is. Because of this, we don't need the exterior Bollinger Bands.
The Bollinger Bands remain visible as the yellow interior clouds on the top cloud and the blue interior clouds on the bottom cloud. Often, the thicker the yellow or blue cloud is, the less severe a throwback from a given trend reversal will be. Often the thinner that yellow or blue cloud is, the more severe the trend reversal will be. If price is rising into a thin interior yellow cloud, the following dip will be substantial. If price action dips towards a thicker interior blue cloud, often the pump following that dump will be less enthusiastic.
We preserve the Keltner Channel and STARC bands as our cloud because the way that they interact with the three basis lines yields a lot of information.
The yellow Bollinger basis line tells us about trend strength. The closer the BB basis line is to the top of the top cloud or the bottom of the bottom cloud, the stronger the trend is. When it enters the cloud very close to the bottom of the bottom cloud, you know you're looking at a strong pump, and vice versa when it's close to the top of the top cloud.
The purple Keltner Channel basis line and orange STARC Band basis line can forecast short term trend changes one candlestick in advance by contacting any line in either cloud. The moment either basis line touches or crosses any boundary of the clouds, you know that the next candle will change directions. In an uptrend, a touch or cross means the next candle will have a lower high point. In a downtrend, a cross or touch means the next candle will have a higher high point. This is most useful in scalping.
It'd be pretty easy to slap some crossover alerts on to this and useful considering that they come a candle in advance. Feel free to further explore and develop this.
