Position Size calculatorOverview 
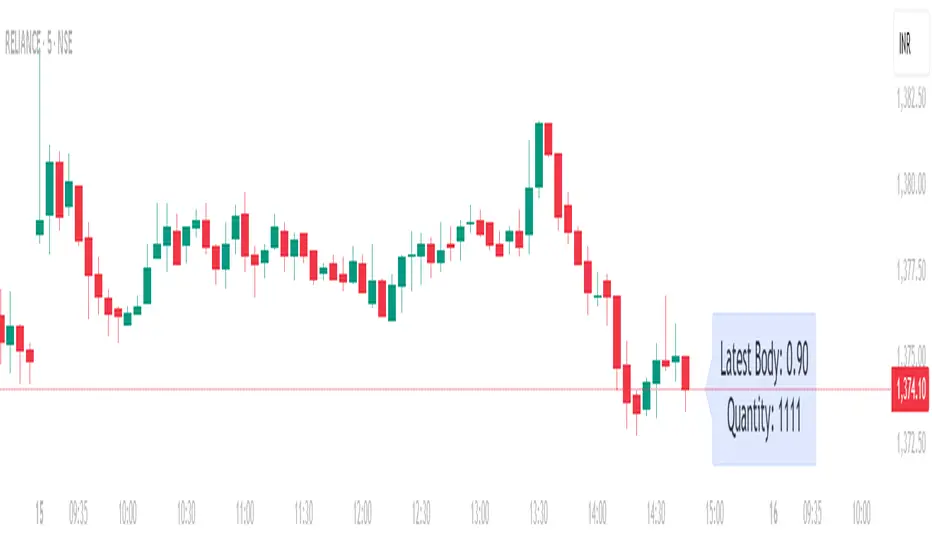
This indicator automatically calculates the average candle body size (|open − close|) for the current trading day and derives a position size (quantity) based on your fixed risk per trade (default ₹1000).
For example:
If today’s average candle body = ₹3.50 and risk = ₹1000 → Quantity = 285
 How It Works: 
The indicator calculates the absolute difference between open and close (the candle’s body) for every bar of the current day.
It averages those body sizes to estimate the average daily volatility.
Then it divides your chosen risk per trade by the average body size to estimate an appropriate quantity.
It automatically resets at the start of each new day.
 Why Use It 
While risk size can be derived manually or using TradingView’s built-in Long/Short Position Tool, this indicator provides a  faster, more practical alternative  when you need to make  quick trade decisions  — especially in  fast-moving intraday markets .
It keeps you  focused on execution rather than calculation. 
 Tip 
You can still verify or fine-tune the quantity using the Long/Short Position Tool or a manual calculator, but this indicator helps you react instantly when opportunities appear.
Riskpertrade
Risk ModuleThis indicator provides a visual reference for position sizing and approximate stop and target placement. It supports trade planning by calculating equalized risk per trade and maintaining consistent exposure across different markets.
For more information about the concept, see the post  Position Sizing and Risk Management .
 Fixed Fractional Risk 
The indicator calculates the number of shares that can be traded to maintain consistent monetary risk. The formula is based on the distance between the current price and stop reference, adjusting position size proportionally. A closer stop results in a larger position size, while a wider stop results in a smaller one.
 Position Size = (Account Size × Risk %) ÷ (Entry Price – Stop Price) 
 Stop and Target 
Stop placement is derived from volatility using the Average True Range (ATR). The target is plotted as a multiple of the stop distance, defining the risk-to-reward relationship in R units.
 Stop = Price ± ATR × Multiplier
Target = Price ± (R × Risk Distance) 
 Chart Elements 
The stop and target levels are plotted above and below the current price, with the stop marked by a red dot and the target by a green dot. The information table displayed on the chart shows the number of shares to trade, stop level, and target level.
 Setup and Configuration 
This configuration only needs to be set once, but can be adjusted later if preferred.
1. Start by setting the account size and risk percentage per trade to define the monetary amount risked on each trade. These values form the basis for position size calculation.
2. Set the ATR multiplier to determine stop distance, common values range between 1 and 3 ATR. Lower values place stops closer to price, increasing sensitivity but risking short-term noise. Higher values widen the stop, which reduces noise impact but extends time in risk.
3. Set the R-multiple to determine target distance relative to the stop. A value of 1 represents a 1:1 risk-to-reward relationship. Lower values reduce potential reward but tend to increase win rate, whereas higher values increase potential reward but tend to reduce win rate. The selection depends on system characteristics and trade expectancy.
When the parameters are defined, the indicator displays the stop, target, and calculated position size on the chart. All that remains is to enter the trade with the number of shares shown in the table and place bracket orders at the plotted stop and target levels.
 Settings Overview 
 
 Account Size / Risk %: Defines account capital and per-trade exposure.
 ATR Multiplier: Adjusts stop distance relative to volatility.
 R Multiple: Sets target distance relative to stop (risk-reward ratio).
 Position: Choose Long or Short direction.
 Table Position: Controls information table placement and scale.

