Market Structure Confluence [AlgoAlpha]OVERVIEW
This script is called "Market Structure Confluence" and it combines classic market structure analysis with a dynamic volatility-based band system to detect shifts in trend and momentum more reliably. It tracks key swing points (higher highs, higher lows, lower highs, lower lows) to define the trend, then overlays a basis and ATR-smoothed volatility bands to catch rejection signals and highlight potential inflection points in the market.
CONCEPTS
Market structure is the foundation of price action trading, focusing on the relationship between successive highs and lows to understand trend conditions. Break of Structure (BOS) and Change of Character (CHoCH) events are important because they signal when a market might be shifting direction. This script enhances traditional structure by integrating volatility bands, which act like dynamic support/resistance zones based on ATR, allowing it to capture momentum surges and rejections beyond just structural shifts.
FEATURES
Swing Detection: It detects and labels Higher Highs (HH), Higher Lows (HL), Lower Highs (LH), and Lower Lows (LL) based on user-defined time horizons, helping traders quickly spot the trend direction.
BOS and CHoCH Lines: When a previous swing point is broken, the script automatically plots a Break of Structure (BOS) line. If the break represents a major trend reversal (a CHoCH), it is marked differently to separate simple breakouts from real trend changes.
Rejection Signals: Special arrows plot when price pierces a band and then pulls back, suggesting a potential trap move or rejection signal in the direction of the new structure.
Alerts: Built-in alerts for structure breaks, CHoCHs, swing points, rejections at bands, and trend flips make it easy to automate setups without manually watching the chart.
USAGE
Set your preferred swing detection size depending on your timeframe and trading style — smaller numbers for intraday, larger numbers for swing trading. Choose whether you want BOS/CHoCH confirmed by candle closes or by wick breaks. Use the volatility band settings to fine-tune how tightly or loosely the bands hug the price, adjusting sensitivity based on market conditions. When a BOS or CHoCH occurs, or when a rejection happens at the bands, the script will highlight it clearly and optionally trigger alerts. Watch for combinations where both structure breaks and volatility band rejections happen together — those are high-quality trade signals. This setup works best when used with basic trend filtering and higher timeframe confirmation.
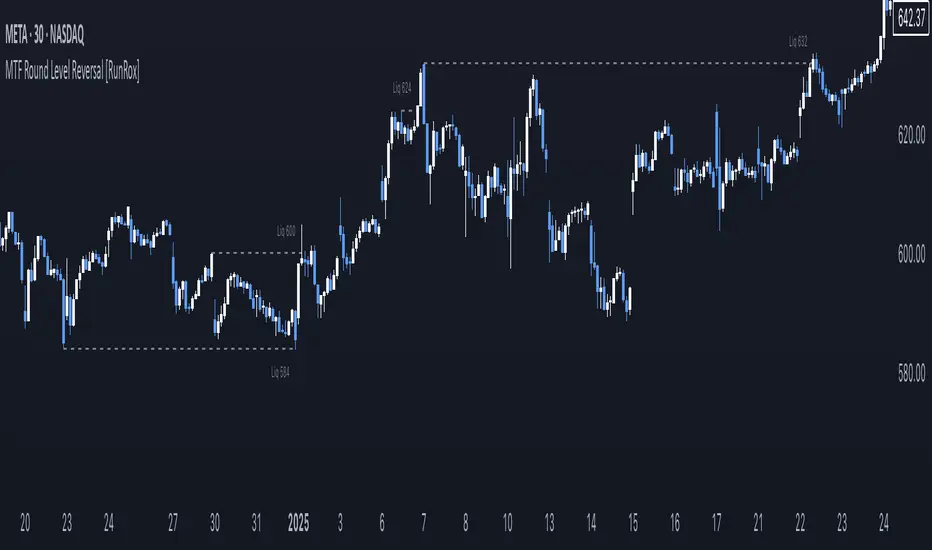
Reversal

Liquidity Trap Reversal Pro (Radar v2)Liquidity Trap Reversal Pro (Radar v2) is a non-repainting indicator designed to detect hidden liquidity traps at key swing highs and lows. It combines wick analysis, volume spike detection, and optional trend and exhaustion filters to identify high-probability reversal setups.
🔷 Features:
Non-Repainting: Pivots confirmed after lookback period, no future leaking.
Volume Spike Detection: Filters traps that occur during major liquidity events.
EMA Trend Filter (Optional): Focus on traps aligned with the prevailing trend.
Higher Timeframe Trend Filter (Optional): Confirm traps using a higher timeframe EMA bias.
Exhaustion Guard (Optional): Prevents traps after overextended moves based on ATR stretch.
Clean Visuals: Distinct plots for raw trap points vs confirmed traps.
Alerts Included: Set alerts for confirmed high/low liquidity traps.
📚 How to Use:
Watch for Trap Signals:
A Trap High signal suggests a potential bearish reversal.
A Trap Low signal suggests a potential bullish reversal.
Use Confirmed Signals for Best Entries:
Confirmed traps fire only after price moves opposite to the trap direction, adding reliability.
Use Trend Filters to Improve Accuracy:
In an uptrend (price above EMA), prefer Trap Lows (buy setups).
In a downtrend (price below EMA), prefer Trap Highs (sell setups).
Use the Exhaustion Guard to Avoid Bad Trades:
This filter blocks signals when price has moved too far from trend, helping avoid late entries.
Recommended Settings:
Best used on 15-minute, 1-hour, or 4-hour charts.
Trend filter ON for trending markets.
Exhaustion guard ON for volatile or stretched markets.
📈 Important Notes:
This script does not repaint once a pivot is confirmed.
Alerts trigger only on confirmed trap signals.
Always combine signals with sound risk management and trading strategy.
Disclaimer:
This script is for educational purposes only. It is not investment advice or a guarantee of results. Always do your own research before trading.

[Stop!Loss] ADR Signal ADR Signal - a technical indicator located in a separate window, which displays by default the 80%-level , as well as the 100%-level of the average daily range (ADR) for the last 10 days and compares it with the current intraday range. The indicator helps not only with the use of a mathematical-statistical method to identify a potential reversal at the moment during intraday trading, but can also serves as an effective assistant in risk management.
👉 Basic mechanics of the indicator
Firstly, this indicator tracks the performance of the standard ATR indicator on the daily chart, in other words, ADR (Average Daily Range).
Important ❗️The ATR (Average True Range) indicator was created by J. Welles Wilder Jr. He first introduced ATR in his book "New Concepts in Technical Trading Systems", published in 1978. Wilder developed this indicator to measure market volatility to help traders estimate the range of price movements. This indicator is built into TradingView, more details can be found by link: www.tradingview.com
Like ATR , ADR calculates the average true range for a specified period. In this case, the distance in points from the maximum of each day to its minimum is calculated, after which the arithmetic mean is calculated - this is ADR .
👉 Visualization
ADR Signal is located in a separate window on the chart and has 3 levels:
1) "ADR level" (green line) - the same parameter, the calculations of which are briefly described above. There is 100%-level of ATR on the daily chart (ADR).
2) "Current level" (red line) - this is the current price passage within the day, calculated in points. At the start of a new day, this parameter is reset. Therefore, in the indicator window, this line has sharp drops at the start of a new trading day: "A new trading day - the instrument's power reserve is renewed again".
3) "Signal level" (blue line) - this is an individually customized value that demonstrates a certain part of the ADR parameter.
👉 Inputs
1) - is responsible for the ATR indicator period, the value of which will always be calculated on the daily chart. The default value is "10", that is, ATR is calculated for the last 10 days (not including the current one).
2) - signal level (in %). The default value is "0.8", that is, 80%-level of the ADR parameter (set earlier) is calculated.
👉 Style
1) - by default, this level is colored "blue".
2) - by default, this level is colored "red".
3) - by default, this level is colored "green".
👉 How to use this indicator
Important❗️ The two methods of the use of the ADR Signal indicator described below will be most effective when trading intraday (which is highlighted quite well below), so it is more logical to use the indicator information on time periods H1 and below.
1) Identifying potential reversals during intraday trading:
The ADR Signal indicator can be used as a potential individual reversal strategy.
Important ❗️It should be noted that using it in it without additional confirming analysis tools will be a rather aggressive trading approach. Therefore, it is best to support the entry point in particular with other methods.
In this case, the crossing of the red line (the number of points passed within the current day, that is, from the minimum of the current day to its maximum) and the blue line (color of the Signal level based on the default settings), indicates that the trading instrument has passed 80% (based on the default settings for the "Signal level") of its average distance from the maximum to the minimum over the past 10 days (based on the default settings for the "ADR Length"). Such a situation in the context of the mathematical-statistical approach indicates a probable reversal, since the "power reserve" of this instrument is mostly exhausted, so one can expect with a higher probability, at least, a price stop and possibly a reversal. In case of crossing of the red line and the green one (ADR level), it says again that based on the mathematical-statistical approach, this trading instrument has completely exhausted its intraday "power reserve". In this situation, a stop or reversal of the price will be even more likely.
Of course, using the "Signal level" parameter, one can filter out even more reliable situations for potential price reversals within a day, namely, by specifying, for example, 1.5 in the field of this parameter. Under such conditions, in the case of crossing the red and blue lines (based on the default style settings), to say that the trading instrument has passed 150% of its average distance over the last 10 days (based on the default style settings "ADR length"). In this case, the probability of a stop or reversal of the price increases even more.
2) Use in risk management:
In terms of risk management, this indicator is more applicable to open trades. For example, if one had an open Buy-position (especially if it is an intraday trade) and the price has raised significantly during the day, then the crossing of the red line with the blue line , and especially the red line with the green line , may indicate that the price will most likely stop growing, since the "power reserve" is almost or completely exhausted for this instrument within the current day. In this case, one can, at a minimum, move the trade to breakeven or even partially fix the profit.
We will continue to discuss the methods of using this indicator and strategies based on it here. And we are always waiting for your reactions and feedback on this topic 💬.
Thank you for your support 🚀

Zen MIG Reversal V1**Zen MIG Reversal V1**
Zen MIG Reversal is a pattern-based indicator that highlights rare reversal setups.
It’s designed to support traders in visually identifying potential turning points, especially following strong momentum or gap-style moves.
**How it works:**
- **Bullish Reversal:**
Detects 3 consecutive bullish candles. The third bar must have a low above the high of the first bar and below the 20 EMA. When this occurs, a light blue box is drawn across the 3-bar range, from high to the current bar’s low. A blue arrow appears below the prior bar.
- **Bearish Reversal:**
Detects 3 consecutive bearish candles. The third bar must have a high below the low of the first bar and above the 20 EMA. A light red box is drawn from low to the current bar’s high. A red arrow appears above the prior bar.
- Optional settings allow you to:
- Show or hide the EMA line
- Toggle the arrows
- Adjust smoothing settings for context
**Purpose:**
It’s best used for discretionary analysis, journaling, or studying price behavior in momentum-driven environments.
**Disclaimer:**
This script is for educational and informational purposes only. It does not provide financial advice or trade recommendations. Always backtest and use proper risk management before applying any indicator to live trading.

VPSRVP Sovereign Reign (VPSR) - Advanced Volume Profile Analysis
A sophisticated volume analysis tool that provides deep insights into market participation and momentum through an intuitive visual interface. This indicator helps traders identify significant market moves, potential reversals, and institutional activity.
Key Features:
1. Smart Volume Analysis
• Dynamic volume profiling
• Institutional participation detection
• Abnormal volume identification
• Real-time momentum tracking
2. Advanced Visual System
• Color-coded volume bars
• Adaptive cloud formation
• Reversal pattern detection
• Fake-out warning system
Visual Components:
1. Volume Bars
• Green: Bullish pressure with normal volume
• Purple: Bearish pressure with normal volume
• White: Significant bullish participation
• Pink: Significant bearish participation
• Orange: High-probability reversal zones
2. Dynamic Cloud
• White Cloud: Bullish control zone
• Purple Cloud: Bearish control zone
• Cloud density indicates participation strength
• Adaptive to market conditions
Signal Interpretation:
1. Normal Market Conditions
• Green/Purple bars show directional pressure
• Cloud color indicates dominant force
• Cloud height shows average participation
2. Significant Events
• White/Pink bars signal major moves
• Orange bars highlight potential reversals
• Cloud expansion shows increasing activity
• Cloud contraction indicates consolidation
Customization Options:
• Volume MA Length: Smoothing factor
• Abnormal Volume Threshold: Sensitivity
• Cloud Display: Toggle visualization
• Color scheme optimization
Best Practices:
1. Multiple Timeframe Analysis
• Start with higher timeframes
• Confirm on lower timeframes
• Watch for confluence
2. Volume Analysis
• Compare to historical levels
• Monitor abnormal spikes
• Track participation trends
3. Trade Management
• Use as confirmation tool
• Wait for clear signals
• Monitor fake-out warnings
• Combine with price action
Trading Applications:
1. Trend Analysis
• Identify strong moves
• Spot weakening trends
• Detect consolidation
2. Reversal Detection
• Spot potential turning points
• Identify fake-outs
• Monitor institutional activity
3. Risk Management
• Volume-based position sizing
• Stop loss placement
• Profit target selection
The VP Sovereign Reign indicator excels at:
• Identifying significant market moves
• Detecting institutional participation
• Warning of potential reversals
• Highlighting fake-outs
• Providing clear market context
Risk Warning:
This indicator is designed as a technical analysis tool and should be used as part of a complete trading strategy. Past performance does not guarantee future results. Always employ proper risk management techniques.
Note: For optimal results, use in conjunction with price action analysis and other complementary indicators.

Aurora Flow Oscillator [QuantAlgo]The Aurora Flow Oscillator is an advanced momentum-based technical indicator designed to identify market direction, momentum shifts, and potential reversal zones using adaptive filtering techniques. It visualizes price momentum through a dynamic oscillator that quantifies trend strength and direction, helping traders and investors recognize momentum shifts and trading opportunities across various timeframes and asset class.
🟢 Technical Foundation
The Aurora Flow Oscillator employs a sophisticated mathematical approach with adaptive momentum filtering to analyze market conditions, including:
Price-Based Momentum Calculation: Calculates logarithmic price changes to measure the rate and magnitude of market movement
Adaptive Momentum Filtering: Applies an advanced filtering algorithm to smooth momentum calculations while preserving important signals
Acceleration Analysis: Incorporates momentum acceleration to identify shifts in market direction before they become obvious
Signal Normalization: Automatically scales the oscillator output to a range between -100 and 100 for consistent interpretation across different market conditions
The indicator processes price data through multiple filtering stages, applying mathematical principles including exponential smoothing with adaptive coefficients. This creates an oscillator that dynamically adjusts to market volatility while maintaining responsiveness to genuine trend changes.
🟢 Key Features & Signals
1. Momentum Flow and Extreme Zone Identification
The oscillator presents market momentum through an intuitive visual display that clearly indicates both direction and strength:
Above Zero: Indicates positive momentum and potential bullish conditions
Below Zero: Indicates negative momentum and potential bearish conditions
Slope Direction: The angle and direction of the oscillator provide immediate insight into momentum strength
Zero Line Crossings: Signal potential trend changes and new directional momentum
The indicator also identifies potential overbought and oversold market conditions through extreme zone markings:
Upper Zone (>50): Indicates strong bullish momentum that may be approaching exhaustion
Lower Zone (<-50): Indicates strong bearish momentum that may be approaching exhaustion
Extreme Boundaries (±95): Mark potentially unsustainable momentum levels where reversals become increasingly likely
These zones are displayed with gradient intensity that increases as the oscillator moves toward extremes, helping traders and investors:
→ Identify potential reversal zones
→ Determine appropriate entry and exit points
→ Gauge overall market sentiment strength
2. Customizable Trading Style Presets
The Aurora Flow Oscillator offers pre-configured settings for different trading approaches:
Default (80,150): Balanced configuration suitable for most trading and investing situations.
Scalping (5,80): Highly responsive settings for ultra-short-term trades. Generates frequent signals and catches quick price movements. Best for 1-15min charts when making many trades per day.
Day Trading (8,120): Optimized for intraday movements with faster response than default settings while maintaining reasonable signal quality. Ideal for 5-60min or 4h-12h timeframes.
Swing Trading (10,200): Designed for multi-day positions with stronger noise filtering. Focuses on capturing larger price swings while avoiding minor fluctuations. Works best on 1-4h and daily charts.
Position Trading (14,250): For longer-term position traders/investors seeking significant market trends. Reduces false signals by heavily filtering market noise. Ideal for daily or even weekly charts.
Trend Following (16,300): Maximum smoothing that prioritizes established directional movements over short-term fluctuations. Best used on daily and weekly charts, but can also be used for lower timeframe trading.
Countertrend (7,100): Tuned to detect potential reversals and exhaustion points in trends. More sensitive to momentum shifts than other presets. Effective on 15min-4h charts, as well as daily and weekly charts.
Each preset automatically adjusts internal parameters for optimal performance in the selected trading context, providing flexibility across different market approaches without requiring complex manual configuration.
🟢 Practical Usage Tips
1/ Trend Analysis and Interpretation
→ Direction Assessment: Evaluate the oscillator's position relative to zero to determine underlying momentum bias
→ Momentum Strength: Measure the oscillator's distance from zero within the -100 to +100 range to quantify momentum magnitude
→ Trend Consistency: Monitor the oscillator's path for sustained directional movement without frequent zero-line crossings
→ Reversal Detection: Watch for oscillator divergence from price and deceleration of movement when approaching extreme zones
2/ Signal Generation Strategies
Depending on your trading approach, multiple signal strategies can be employed:
Trend Following Signals:
Enter long positions when the oscillator crosses above zero
Enter short positions when the oscillator crosses below zero
Add to positions on pullbacks while maintaining the overall trend direction
Countertrend Signals:
Look for potential reversals when the oscillator reaches extreme zones (±95)
Enter contrary positions when momentum shows signs of exhaustion
Use oscillator divergence with price as additional confirmation
Momentum Shift Signals:
Enter positions when oscillator changes direction after establishing a trend
Exit positions when oscillator direction reverses against your position
Scale position size based on oscillator strength percentage
3/ Timeframe Optimization
The indicator can be effectively applied across different timeframes with these considerations:
Lower Timeframes (1-15min):
Use Scalping or Day Trading presets
Focus on quick momentum shifts and zero-line crossings
Be cautious of noise in extreme market conditions
Medium Timeframes (30min-4h):
Use Default or Swing Trading presets
Look for established trends and potential reversal zones
Combine with support/resistance analysis for entry/exit precision
Higher Timeframes (Daily+):
Use Position Trading or Trend Following presets
Focus on major trend identification and long-term positioning
Use extreme zones for position management rather than immediate reversals
🟢 Pro Tips
Price Momentum Period:
→ Lower values (5-7) increase sensitivity to minor price fluctuations but capture more market noise
→ Higher values (10-16) emphasize sustained momentum shifts at the cost of delayed response
→ Adjust based on your timeframe (lower for shorter timeframes, higher for longer timeframes)
Oscillator Filter Period:
→ Lower values (80-120) produce more frequent directional changes and earlier response to momentum shifts
→ Higher values (200-300) filter out shorter-term fluctuations to highlight dominant market cycles
→ Match to your typical holding period (shorter holding time = lower filter values)
Multi-Timeframe Analysis:
→ Compare oscillator readings across different timeframes for confluence
→ Look for alignment between higher and lower timeframe signals
→ Use higher timeframe for trend direction, lower for earlier entries
Volatility-Adaptive Trading:
→ Use oscillator strength to adjust position sizing (stronger = larger)
→ Consider reducing exposure when oscillator reaches extreme zones
→ Implement tighter stops during periods of oscillator acceleration
Combination Strategies:
→ Pair with volume indicators for confirmation of momentum shifts
→ Use with support/resistance levels for strategic entry and exit points
→ Combine with volatility indicators for comprehensive market context

Reversal Strength Meter – Adib NooraniThe Reversal Strength Meter is an oscillator designed to identify potential reversal zones based on supply and demand dynamics. It uses smoothed stochastic logic to reduce noise and highlight areas where momentum may be weakening, signaling possible market turning points.
🔹 Smooth, noise-reduced stochastic oscillator
🔹 Custom zones to highlight potential supply and demand imbalances
🔹 Non-repainting, compatible across all timeframes and assets
🔹 Visual-only tool — intended to support discretionary trading decisions
This oscillator assists scalpers and intraday traders in tracking subtle shifts in momentum, helping them identify when a market may be preparing to reverse — always keeping in mind that trading is based on probabilities, not certainties.
📘 How to Use the Indicator Efficiently
For Reversal Trading:
Buy Setup
– When the blue line dips below the 20 level, wait for it to re-enter above 20.
– Look for reversal candlestick patterns (e.g., bullish engulfing, hammer, or morning star).
– Enter above the pattern’s high, with a stop loss below its low.
Sell Setup
– When the blue line rises above the 80 level, wait for it to re-enter below 80.
– Look for bearish candlestick patterns (e.g., bearish engulfing, inverted hammer, or evening star).
– Enter below the pattern’s low, with a stop loss above its high.
🛡 Risk Management Guidelines
Risk only 0.5% of your capital per trade
Book 50% profits at a 1:1 risk-reward ratio
Trail the remaining 50% using price action or other supporting indicators

Reversal Scalping Ribbon - Adib NooraniThe Reversal Scalping Ribbon is a trend-following overlay tool designed to visually identify potential reversal zones based on price extremes and dynamic volatility bands. It calculates adaptive upper and lower bands using price action and custom ATR logic, helping traders quickly assess market direction and possible turning points
🔹 Volatility-adjusted bands based on price highs/lows
🔹 Color-coded ribbons to indicate trend bias and potential reversal shifts
🔹 No repainting, works on all timeframes and assets
🔹 Visual-only display, no trade signals — supports discretion-based entries
This ribbon is designed for scalpers and intraday traders to spot reversal setups with clarity. It enhances your trading by showing real-time market bias without unnecessary distractions. By focusing on probabilities, it helps to improve decision-making in fast-paced environments
How to use the indicator efficiently
For Reversal Trading:
Buy: When price closes below the green ribbon with a red candle, then re-enters with a green candle. Enter above the high of the green candle with a stop loss below the lowest low of the recent green/red candles
Sell: When price closes above the red ribbon with a green candle, then re-enters with a red candle. Enter below the low of the red candle with a stop loss above the highest high of the recent red/green candles
Risk Management:
Limit risk to 0.5% of your capital per trade
Take 50% profit at a 1:1 risk-reward ratio
For the remaining 50%, trail using the lower edge of the green band for buys and the upper edge of the red band for sells

Trend Targets [AlgoAlpha]OVERVIEW
This script combines a smoothed trend-following model with dynamic price rejection logic and ATR-based target projection to give traders a complete visual framework for trading trend continuations. It overlays on price and automatically detects potential trend shifts, confirms rejections near dynamic support/resistance, and displays calculated stop-loss and take-profit levels to support structured risk-reward management. Unlike traditional indicators that only show trend direction or signal entries, this tool brings together a unique mix of signal validation, volatility-aware positioning, and layered profit-taking to guide decision-making with more context.
CONCEPTS
The core trend logic is built on a custom Supertrend that uses an ATR-based band structure with long smoothing chains—first through a WMA, then an EMA—allowing the trend line to respond to major shifts while ignoring noise. A key addition is the use of rejection logic: the script looks for consolidation candles that "hug" the smoothed trend line and counts how many consecutive bars reject from it. This behavior often precedes significant moves. A user-defined threshold filters out weak tests and highlights only meaningful rejections.
FEATURES
Trend Detection : Automatically identifies trend direction using a smoothed Supertrend (WMA + EMA), with shape markers on trend shifts and color-coded bars for clarity.
Rejection Signals : Detects price rejections at the trend line after a user-defined number of consolidation bars; plots ▲/▼ icons to highlight strong continuation setups.
Target Projection : On trend confirmation, plots entry, stop-loss (ATR-based), and three dynamic take-profit levels based on customizable multiples.
Dynamic Updates : All levels (entry, SL, TP1–TP3) auto-adjust based on volatility and are labeled in real time on the chart.
Customization : Users can tweak trend parameters, rejection confirmation count, SL/TP ratios, smoothing lengths, and appearance settings.
Alerts : Built-in alerts for trend changes, rejection events, and when TP1, TP2, or TP3 are reached.
Chart Overlay : Plots directly on price chart with minimal clutter and clearly labeled levels for easy trading.
USAGE
Start by tuning the Supertrend factor and ATR period to fit your asset and timeframe—higher values will catch bigger swings, lower values catch faster moves. The confirmation count should match how tightly you want to filter rejection behavior—higher values make signals rarer but stronger. When the trend shifts, the indicator colors the bars and line accordingly, and if enabled, plots the full entry-TP-SL structure. Rejection markers appear only after enough qualifying bars confirm price pressure at the trend line. This is especially useful for continuation plays where price retests the trend but fails to break it. All calculations are based on volatility (ATR), so targets naturally adjust with market conditions. Add alerts to get notified of important signals even when away from the chart.

Smarter Money Concepts - OBs [PhenLabs]📊 Smarter Money Concepts - OBs
Version: PineScript™ v6
📌 Description
Smarter Money Concepts - OBs (Order Blocks) is an advanced technical analysis tool designed to identify and visualize institutional order zones on your charts. Order blocks represent significant areas of liquidity where smart money has entered positions before major moves. By tracking these zones, traders can anticipate potential reversals, continuations, and key reaction points in price action.
This indicator incorporates volume filtering technology to identify only the most significant order blocks, eliminating low-quality signals and focusing on areas where institutional participation is likely present. The combination of price structure analysis and volume confirmation provides traders with high-probability zones that may attract future price action for tests, rejections, or breakouts.
🚀 Points of Innovation
Volume-Filtered Block Detection : Identifies only order blocks formed with significant volume, focusing on areas with institutional participation
Advanced Break of Structure Logic : Uses sophisticated price action analysis to detect legitimate market structure breaks preceding order blocks
Dynamic Block Management : Intelligently tracks, extends, and removes order blocks based on price interaction and time-based expiration
Structure Recognition System : Employs technical analysis algorithms to find significant swing points for accurate order block identification
Dual Directional Tracking : Simultaneously monitors both bullish and bearish order blocks for comprehensive market structure analysis
🔧 Core Components
Order Block Detection : Identifies institutional entry zones by analyzing price action before significant breaks of structure, capturing where smart money has likely positioned before moves.
Volume Filtering Algorithm : Calculates relative volume compared to a moving average to qualify only order blocks formed with significant market participation, eliminating noise.
Structure Break Recognition : Uses price action analysis to detect legitimate breaks of market structure, ensuring order blocks are identified only at significant market turning points.
Dynamic Block Management : Continuously monitors price interaction with existing blocks, extending, maintaining, or removing them based on current market behavior.
🔥 Key Features
Volume-Based Filtering : Filter out insignificant blocks by requiring a minimum volume threshold, focusing only on zones with likely institutional activity
Visual Block Highlighting : Color-coded boxes clearly mark bullish and bearish order blocks with customizable appearance
Flexible Mitigation Options : Choose between “Wick” or “Close” methods for determining when a block has been tested or mitigated
Scan Range Adjustment : Customize how far back the indicator looks for structure points to adapt to different market conditions and timeframes
Break Source Selection : Configure which price component (close, open, high, low) is used to determine structure breaks for precise block identification
🎨 Visualization
Bullish Order Blocks : Blue-colored rectangles highlighting zones where bullish institutional orders were likely placed before upward moves, representing potential support areas.
Bearish Order Blocks : Red-colored rectangles highlighting zones where bearish institutional orders were likely placed before downward moves, representing potential resistance areas.
Block Extension : Order blocks extend to the right of the chart, providing clear visualization of these significant zones as price continues to develop.
📖 Usage Guidelines
Order Block Settings
Scan Range : Default: 25. Defines how many bars the indicator scans to determine significant structure points for order block identification.
Bull Break Price Source : Default: Close. Determines which price component is used to detect bullish breaks of structure.
Bear Break Price Source : Default: Close. Determines which price component is used to detect bearish breaks of structure.
Visual Settings
Bullish Blocks Color : Default: Blue with 85% transparency. Controls the appearance of bullish order blocks.
Bearish Blocks Color : Default: Red with 85% transparency. Controls the appearance of bearish order blocks.
General Options
Block Mitigation Method : Default: Wick, Options: Wick, Close. Determines how block mitigation is calculated - “Wick” uses high/low values while “Close” uses close values for more conservative mitigation criteria.
Remove Filled Blocks : Default: Disabled. When enabled, order blocks are removed once they’ve been mitigated by price action.
Volume Filter
Volume Filter Enabled : Default: Enabled. When activated, only shows order blocks formed with significant volume relative to recent average.
Volume SMA Period : Default: 15, Range: 1-50. Number of periods used to calculate the average volume baseline.
Min. Volume Ratio : Default: 1.5, Range: 0.5-10.0. Minimum volume ratio compared to average required to display an order block; higher values filter out more blocks.
✅ Best Use Cases
Identifying high-probability support and resistance zones for trade entries and exits
Finding optimal stop-loss placement behind significant order blocks
Detecting potential reversal areas where price may react after extended moves
Confirming breakout trades when price clears major order blocks
Building a comprehensive market structure map for medium to long-term trading decisions
Pinpointing areas where smart money may have positioned before major market moves
⚠️ Limitations
Most effective on higher timeframes (1H and above) where institutional activity is more clearly defined
Can generate multiple signals in choppy market conditions, requiring additional filtering
Volume filtering relies on accurate volume data, which may be less reliable for some securities
Recent market structure changes may invalidate older order blocks not yet automatically removed
Block identification is based on historical price action and may not predict future behavior with certainty
💡 What Makes This Unique
Volume Intelligence : Unlike basic order block indicators, this script incorporates volume analysis to identify only the most significant institutional zones, focusing on quality over quantity.
Structural Precision : Uses sophisticated break of structure algorithms to identify true market turning points, going beyond simple price pattern recognition.
Dynamic Block Management : Implements automatic block tracking, extension, and cleanup to maintain a clean and relevant chart display without manual intervention.
Institutional Focus : Designed specifically to highlight areas where smart money has likely positioned, helping retail traders align with institutional perspectives rather than retail noise.
🔬 How It Works
1. Structure Identification Process :
The indicator continuously scans price action to identify significant swing points and structure levels within the specified range, establishing a foundation for order block recognition.
2. Break Detection :
When price breaks an established structure level (crossing below a significant low for bearish breaks or above a significant high for bullish breaks), the indicator marks this as a potential zone for order block formation.
3. Volume Qualification :
For each potential order block, the algorithm calculates the relative volume compared to the configured period average. Only blocks formed with volume exceeding the minimum ratio threshold are displayed.
4. Block Creation and Management :
Valid order blocks are created, tracked, and managed as price continues to develop. Blocks extend to the right of the chart until they are either mitigated by price action or expire after the designated timeframe.
5. Continuous Monitoring :
The indicator constantly evaluates price interaction with existing blocks, determining when blocks have been tested, mitigated, or invalidated, and updates the visual representation accordingly.
💡 Note:
Order Blocks represent areas where institutional traders have likely established positions and may defend these zones during future price visits. For optimal results, use this indicator in conjunction with other confluent factors such as key support/resistance levels, trendlines, or additional confirmation indicators. The most reliable signals typically occur on higher timeframes where institutional activity is most prominent. Start with the default settings and adjust parameters gradually to match your specific trading instrument and style.

MACD Volume Strategy (BBO + MACD State, Reversal Type)Overview
MACD Volume Strategy (BBO + MACD State, Reversal Type) is a momentum-based reversal system that combines MACD crossover logic with volume filtering to enhance signal accuracy and minimize noise. It aims to identify structural trend shifts and manage risk using predefined parameters.
※This strategy is for educational and research purposes only. All results are based on historical simulations and do not guarantee future performance.
Strategy Objectives
Identify early trend transitions with high probability
Filter entries using volume dynamics to validate momentum
Maintain continuous exposure using a reversal-style model
Apply a consistent 1:1.5 risk-to-reward ratio per trade
Key Features
Integrated MACD and volume oscillator filtering
Zero repainting (all signals confirmed on closed candles)
Automatic position flipping for seamless direction shifts
Stop-loss and take-profit based on recent structural highs/lows
Trading Rules
Long Entry Conditions
MACD crosses above the zero line (BBO Buy arrow)
Volume oscillator is positive (short EMA > long EMA)
MACD is above the signal line
Close any existing short and enter a new long
Short Entry Conditions
MACD crosses below the zero line (BBO Sell arrow)
Volume oscillator is positive
MACD is below the signal line
Close any existing long and enter a new short
Exit Rules
Take Profit (TP) = Entry ± (risk distance × 1.5)
Stop Loss (SL) = Recent swing low (for long) or high (for short)
Early Exit = Triggered when a reversal signal appears (flip logic)
Risk Management Parameters
Pair: ETH/USD
Timeframe: 10-minute
Starting Capital: $3,000
Commission: 0.02%
Slippage: 2 pip
Risk per Trade: 5% of account equity (adjusted for sustainable practice)
Total Trades: 312 (backtest on selected dataset)
※Risk parameters are fully configurable and should be adjusted to suit each trader's personal setup and broker conditions.
Parameters & Configurations
Volume Short Length: 6
Volume Long Length: 12
MACD Fast Length: 11
MACD Slow Length: 21
Signal Smoothing: 10
Oscillator MA Type: SMA
Signal Line MA Type: SMA
Visual Support
Green arrow = Long entry
Red arrow = Short entry
MACD lines, signal line, and histogram
SL/TP markers plotted directly on the chart
Strategic Advantages & Uniqueness
Volume filtering eliminates low-participation, weak signals
Structurally aligned SL/TP based on recent market pivots
No repainting — decisions are made only on closed candles
Always in the market due to the reversal-style framework
Inspirations & Attribution
This strategy is inspired by the excellent work of:
Bitcoinblockchainonline – “BBO_Roxana_Signals MACD + vol”
Leveraging MACD zero-line cross and volume oscillator for intuitive signal generation.
HasanRifat – “MACD Fake Filter ”
Introduced a signal filter using MACD wave height averaging to reduce false positives.
This strategy builds upon those ideas to create a more automated, risk-aware, and technically adaptive system.
Summary
MACD Volume Strategy is a clean, logic-first automated trading system built for precision-seeking traders. It avoids discretionary bias and provides consistent signal logic under backtested historical conditions.
100% mechanical — no discretionary input required
Designed for high-confidence entries
Can be extended with filters, alerts, or trailing stops
※Strategy performance depends on market context. Past performance is not indicative of future results. Use with proper risk management and careful configuration.

Larry Williams POIV A/D [tradeviZion]Larry Williams' POIV A/D - Release Notes v1.0
=================================================
Release Date: 01 April 2025
OVERVIEW
--------
The Larry Williams POIV A/D (Price, Open Interest, Volume Accumulation/Distribution) indicator implements Williams' original formula while adding advanced divergence detection capabilities. This powerful tool combines price movement, open interest, and volume data to identify potential trend reversals and continuations.
FEATURES
--------
- Implements Larry Williams' original POIV A/D formula
- Divergence detection system:
* Regular divergences for trend reversal signals
* Hidden divergences for trend continuation signals
- Fast Mode option for earlier pivot detection
- Customizable sensitivity for divergence filtering
- Dynamic color visualization based on indicator direction
- Adjustable smoothing to reduce noise
- Automatic fallback to OBV when Open Interest is unavailable
FORMULA
-------
POIV A/D = CumulativeSum(Open Interest * (Close - Close ) / (True High - True Low)) + OBV
Where:
- Open Interest: Current period's open interest
- Close - Close : Price change from previous period
- True High - True Low: True Range
- OBV: On Balance Volume
DIVERGENCE TYPES
---------------
1. Regular Divergences (Reversal Signals):
- Bullish: Price makes lower lows while indicator makes higher lows
- Bearish: Price makes higher highs while indicator makes lower highs
2. Hidden Divergences (Continuation Signals):
- Bullish: Price makes higher lows while indicator makes lower lows
- Bearish: Price makes lower highs while indicator makes higher highs
REQUIREMENTS
-----------
- Works best with futures and other instruments that provide Open Interest data
- Automatically adapts to work with any instrument by using OBV when OI is unavailable
USAGE GUIDE
-----------
1. Apply the indicator to any chart
2. Configure settings:
- Adjust sensitivity for divergence detection
- Enable/disable Fast Mode for earlier signals
- Customize visual settings as needed
3. Look for divergence signals:
- Regular divergences for potential trend reversals
- Hidden divergences for trend continuation opportunities
4. Use the alerts system for automated divergence detection
KNOWN LIMITATIONS
----------------
- Requires Open Interest data for full functionality
- Fast Mode may generate more signals but with lower reliability
ACKNOWLEDGEMENTS
---------------
This indicator is based on Larry Williams' work on Open Interest analysis. The implementation includes additional features for divergence detection while maintaining the integrity of the original formula.

DAMA OSC - Directional Adaptive MA OscillatorOverview:
The DAMA OSC (Directional Adaptive MA Oscillator) is a highly customizable and versatile oscillator that analyzes the delta between two moving averages of your choice. It detects trend progression, regressions, rebound signals, MA cross and critical zone crossovers to provide highly contextual trading information.
Designed for trend-following, reversal timing, and volatility filtering, DAMA OSC adapts to market conditions and highlights actionable signals in real-time.
Features:
Support for 11 custom moving average types (EMA, DEMA, TEMA, ALMA, KAMA, etc.)
Customizable fast & slow MA periods and types
Histogram based on percentage delta between fast and slow MA
Trend direction coloring with “Green”, “Blue”, and “Red” zones
Rebound detection using close or shadow logic
Configurable thresholds: Overbought, Oversold, Underbought, Undersold
Optional filters: rebound validation by candle color or flat-zone filter
Full visual overlay: MA lines, crossover markers, rebound icons
Complete alert system with 16 preconfigured conditions
How It Works:
Histogram Logic:
The histogram measures the percentage difference between the fast and slow MA:
hist_value = ((FastMA - SlowMA) / SlowMA) * 100
Trend State Logic (Green / Blue / Red):
Green_Up = Bullish acceleration
Blue_Up (or Red_Up, depending the display settings) = Bullish deceleration
Blue_Down (or Green_Down, depending the display settings) = Bearish deceleration
Red_Down = Bearish acceleration
Rebound Logic:
A rebound is detected when price:
Crosses back over a selected MA (fast or slow)
After being away for X candles (rebound_backstep)
Optional: filtered by histogram zones or candle color
Inputs:
Display Options:
Show/hide MA lines
Show/hide MA crosses
Show/hide price rebounds
Enable/disable blue deceleration zones
DAMA Settings:
Fast/Slow MA type and length
Source input (close by default)
Overbought/Oversold levels
Underbought/Undersold levels
Rebound Settings:
Use Close and/or Shadow
Rebound MA (Fast/Slow)
Candle color validation
Flat zone filter rebounds (between UnderSold and UnderBought)
Available MA type:
SMA (Simple MA)
EMA (Exponential MA)
DEMA (Double EMA)
TEMA (Triple EMA)
WMA (Weighted MA)
HMA (Hull MA)
VWMA (Volume Weighted MA)
Kijun (Ichimoku Baseline)
ALMA (Arnaud Legoux MA)
KAMA (Kaufman Adaptive MA)
HULLMOD (Modified Hull MA, Same as HMA, tweaked for Pine v6 constraints)
Notes:
**DEMA/TEMA** reduce lag compared to EMA, useful for faster reaction in trending markets.
**KAMA/ALMA** are better suited to noisy or volatile environments (e.g., BTC).
**VWMA** reacts strongly to volume spikes.
**HMA/HULLMOD** are great for visual clarity in fast moves.
Alerts Included (Fully Configurable):
Golden Cross:
Fast MA crosses above Slow MA
Death Cross:
Fast MA crosses below Slow MA
Bullish Rebound:
Rebound from below MA in uptrend
Bearish Rebound:
Rebound from above MA in downtrend
Bull Progression:
Transition into Green_Up with positive delta
Bear Progression:
Transition into Red_Down with negative delta
Bull Regression:
Exit from Red_Down into Blue/Green with negative delta
Bear Regression:
Exit from Green_Up into Blue/Red with positive delta
Crossover Overbought:
Histogram crosses above Overbought
Crossunder Overbought:
Histogram crosses below Overbought
Crossover Oversold:
Histogram crosses above Oversold
Crossunder Oversold:
Histogram crosses below Oversold
Crossover Underbought:
Histogram crosses above Underbought
Crossunder Underbought:
Histogram crosses below Underbought
Crossover Undersold:
Histogram crosses above Undersold
Crossunder Undersold:
Histogram crosses below Undersold
Credits:
Created by Eff_Hash. This code is shared with the TradingView community and full free. do not hesitate to share your best settings and usage.

Auto TrendLines [TradingFinder] Support Resistance Signal Alerts🔵 Introduction
The trendline is one of the most essential tools in technical analysis, widely used in financial markets such as Forex, cryptocurrency, and stocks. A trendline is a straight line that connects swing highs or swing lows and visually indicates the market’s trend direction.
Traders use trendlines to identify price structure, the strength of buyers and sellers, dynamic support and resistance zones, and optimal entry and exit points.
In technical analysis, trendlines are typically classified into three categories: uptrend lines (drawn by connecting higher lows), downtrend lines (formed by connecting lower highs), and sideways trends (moving horizontally). A valid trendline usually requires at least three confirmed touchpoints to be considered reliable for trading decisions.
Trendlines can serve as the foundation for a variety of trading strategies, such as the trendline bounce strategy, valid breakout setups, and confluence-based analysis with other tools like candlestick patterns, divergences, moving averages, and Fibonacci levels.
Additionally, trendlines are categorized into internal and external, and further into major and minor levels, each serving unique roles in market structure analysis.
🔵 How to Use
Trendlines are a key component in technical analysis, used to identify market direction, define dynamic support and resistance zones, highlight strategic entry and exit points, and manage risk. For a trendline to be reliable, it must be drawn based on structural principles—not by simply connecting two arbitrary points.
🟣 Selecting Pivot Types Based on Trend Direction
The first step is to determine the market trend: uptrend, downtrend, or sideways.
Then, choose pivot points that match the trend type :
In an uptrend, trendlines are drawn by connecting low pivots, especially higher lows.
In a downtrend, trendlines are formed by connecting high pivots, specifically lower highs.
It is crucial to connect pivots of the same type and structure to ensure the trendline is valid and analytically sound.
🟣 Pivot Classification
This indicator automatically classifies pivot points into two categories :
Major Pivots :
MLL : Major Lower Low
MHL : Major Higher Low
MHH : Major Higher High
MLH : Major Lower High
These define the primary structure of the market and are typically used in broader structural analysis.
Minor Pivots :
mLL: minor Lower Low
mHL: minor Higher Low
mHH: minor Higher High
mLH: minor Lower High
These are used for drawing more precise trendlines within corrective waves or internal price movements.
Example : In a downtrend, drawing a trendline from an MHH to an mHH creates structural inconsistency and introduces noise. Instead, connect points like MHL to MHL or mLH to mLH for a valid trendline.
🟣 Drawing High-Precision Trendlines
To ensure a reliable trendline :
Use pivots of the same classification (Major with Major or Minor with Minor).
Ensure at least three valid contact points (three touches = structural confirmation).
Draw through candles with the least deviation (choose wicks or bodies based on confluence).
Preferably draw from right to left for better alignment with current market behavior.
Use parallel lines to turn a single trendline into a trendline zone, if needed.
🟣 Using Trendlines for Trade Entries
Bounce Entry: When price approaches the trendline and shows signs of reversal (e.g., a reversal candle, divergence, or support/resistance), enter in the direction of the trend with a logical stop-loss.
Breakout Entry: When price breaks through the trendline with strong momentum and a confirmation (such as a retest or break of structure), consider trading in the direction of the breakout.
🟣 Trendline-Based Risk Management
For bounce entries, the stop-loss is placed below the trendline or the last pivot low (in an uptrend).
For breakout entries, the stop-loss is set behind the breakout candle or the last structural level.
A broken trendline can also act as an exit signal from a trade.
🟣 Combining Trendlines with Other Tools (Confluence)
Trendlines gain much more strength when used alongside other analytical tools :
Horizontal support and resistance levels
Moving averages (such as EMA 50 or EMA 200)
Fibonacci retracement zones
Candlestick patterns (e.g., Engulfing, Pin Bar)
RSI or MACD divergences
Market structure breaks (BoS / ChoCH)
🔵 Settings
Pivot Period : This defines how sensitive the pivot detection is. A higher number means the algorithm will identify more significant pivot points, resulting in longer-term trendlines.
Alerts
Alert :
Enable or disable the entire alert system
Set a custom alert name
Choose how often alerts trigger (every time, once per bar, or on bar close)
Select the time zone for alert timestamps (e.g., UTC)
Each trendline type supports two alert types :
Break Alert : Triggered when price breaks the trendline
React Alert : Triggered when price reacts or bounces off the trendline
These alerts can be independently enabled or disabled for all trendline categories (Major/Minor, Internal/External, Up/Down).
Display :
For each of the eight trendline types, you can control :
Whether to show or hide the line
Whether to delete the previous line when a new one is drawn
Color, line style (solid, dashed, dotted), extension direction (e.g., right only), and width
Major lines are typically thicker and more opaque, while minor lines appear thinner and more transparent.
All settings are designed to give the user full control over the appearance, behavior, and alert system of the indicator, without requiring manual drawing or adjustments.
🔵 Conclusion
A trendline is more than just a line on the chart—it is a structural, strategic, and flexible tool in technical analysis that can serve as the foundation for understanding price behavior and making trading decisions. Whether in trending markets or during corrections, trendlines help traders identify market direction, key zones, and high-potential entry and exit points with precision.
The accuracy and effectiveness of a trendline depend on using structurally valid pivot points and adhering to proper market logic, rather than relying on guesswork or personal bias.
This indicator is built to solve that exact problem. It automatically detects and draws multiple types of trendlines based on actual price structure, separating them into Major/Minor and Internal/External categories, and respecting professional analytical principles such as pivot type, trend direction, and structural location.

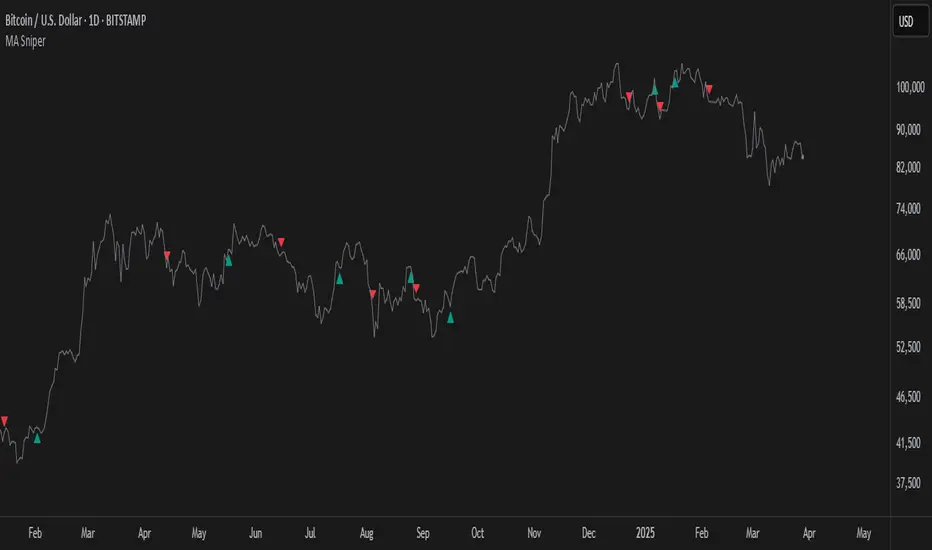
MA SniperThis indicator automatically finds the most effective moving average to use in a price crossover strategy—so you can focus on trading, not testing. It continuously evaluates a wide range of moving average periods, ranks them based on real-time market performance, and selects the one delivering the highest quality signals. The result? A smarter, adaptive tool that shows you exactly when price crosses its optimal moving average—bullish signals in green, bearish in red.
What makes it unique is the way it thinks.
Under the hood, the script doesn’t just pick a random MA or let you choose one manually. Instead, it backtests a large panel of moving average lengths for the current asset and timeframe. It evaluates each one by calculating its **Profit Factor**—a key performance metric used by pros to measure the quality of a strategy. Then, it assigns each MA a score and ranks them in a clean, built-in table so you can see, at a glance, which ones are currently most effective.
From that list, it picks the top-performing MA and uses it to generate live crossover signals on your chart. That MA is plotted automatically, and the signals adapt in real-time. This isn’t a static setup—it’s a dynamic system that evolves as the market evolves.
Even better: the indicator detects the type of instrument you’re trading (forex, stocks, etc.) and adjusts its internal calculations accordingly, including how many bars per day to consider. That means it remains highly accurate whether you’re trading EURUSD, SPX500, or TSLA.
You also get a real-time dashboard (via the table) that acts as a transparent scorecard. Want to see how other MAs are doing? You can. Want to understand why a certain MA was selected? The data is right there.
This tool is for traders who love crossover strategies but want something smarter, faster, and more precise—without spending hours manually testing. Whether you're scalping or swing trading, it offers a data-driven edge that’s hard to ignore.
Give it a try—you’ll quickly see how powerful it can be when your MA does the thinking for you.
This tool is for informational and educational purposes only. Trading involves risk, and past performance does not guarantee future results. Use responsibly.
HEMA Trend Levels [AlgoAlpha]OVERVIEW
This script plots two Hull-EMA (HEMA) curves to define a color-coded dynamic trend zone and generate context-aware breakout levels, allowing traders to easily visualize prevailing momentum and identify high-probability breakout retests. The script blends smoothed price tracking with conditional box plotting, delivering both trend-following and mean-reversion signals within one system. It is designed to be simple to read visually while offering nuanced trend shifts and test confirmations.
█ CONCEPTS
The Hull-EMA (HEMA) is a hybrid moving average combining the responsiveness of short EMAs with the smoothness of longer ones. It applies layered smoothing: first by subtracting a full EMA from a half-length EMA (doubling the short EMA's weight), and then by smoothing the result again with the square root of the original length. This process reduces lag while maintaining clarity in direction changes. In this script, two HEMAs—fast and slow—are used to define the trend structure and trigger events when they cross. These crossovers generate "trend shift boxes"—temporary support or resistance zones drawn immediately after trend transitions—to detect price retests in the new direction. When price cleanly retests these levels, the script marks them as confirmations with triangle symbols, helping traders isolate better continuation setups. Color-coded bars further enhance visual interpretation: bullish bars when price is above both HEMAs, bearish when below, and neutral (gray) when indecisive.
█ FEATURES
Bullish and bearish bar coloring based on price and HEMA alignment.
Box plotting at each crossover (bullish or bearish) to create short-term decision zones.
Real-time test detection: price must cleanly test and bounce from box levels to be considered valid.
Multiple alert conditions: crossover alerts, test alerts, and trend continuation alerts.
█ USAGE
Use this indicator on any time frame and asset. Adjust HEMA lengths to match your trading style—shorter lengths for scalping or intraday, longer for swing trading. The shaded area between HEMAs helps visually define the current trend. Watch for crossovers: a bullish crossover plots a green support box just below price, and a bearish one plots a red resistance box just above. These zones act as short-term decision points. When price returns to test a box and confirms with strong rejection (e.g., closes above for bullish or below for bearish), a triangle symbol is plotted. These tests can signal strong trend continuation. For traders looking for clean entries, combining the crossover with a successful retest improves reliability. Alerts can be enabled for all key signals: trend shift, test confirmations, and continuation conditions, making it suitable for automated setups or discretionary traders tracking multiple charts.

Lowess Channel + (RSI) [ChartPrime]The Lowess Channel + (RSI) indicator applies the LOWESS (Locally Weighted Scatterplot Smoothing) algorithm to filter price fluctuations and construct a dynamic channel. LOWESS is a non-parametric regression method that smooths noisy data by fitting weighted linear regressions at localized segments. This technique is widely used in statistical analysis to reveal trends while preserving data structure.
In this indicator, the LOWESS algorithm is used to create a central trend line and deviation-based bands. The midline changes color based on trend direction, and diamonds are plotted when a trend shift occurs. Additionally, an RSI gauge is positioned at the end of the channel to display the current RSI level in relation to the price bands.
lowess_smooth(src, length, bandwidth) =>
sum_weights = 0.0
sum_weighted_y = 0.0
sum_weighted_xy = 0.0
sum_weighted_x2 = 0.0
sum_weighted_x = 0.0
for i = 0 to length - 1
x = float(i)
weight = math.exp(-0.5 * (x / bandwidth) * (x / bandwidth))
y = nz(src , 0)
sum_weights := sum_weights + weight
sum_weighted_x := sum_weighted_x + weight * x
sum_weighted_y := sum_weighted_y + weight * y
sum_weighted_xy := sum_weighted_xy + weight * x * y
sum_weighted_x2 := sum_weighted_x2 + weight * x * x
mean_x = sum_weighted_x / sum_weights
mean_y = sum_weighted_y / sum_weights
beta = (sum_weighted_xy - mean_x * mean_y * sum_weights) / (sum_weighted_x2 - mean_x * mean_x * sum_weights)
alpha = mean_y - beta * mean_x
alpha + beta * float(length / 2) // Centered smoothing
⯁ KEY FEATURES
LOWESS Price Filtering – Smooths price fluctuations to reveal the underlying trend with minimal lag.
Dynamic Trend Coloring – The midline changes color based on trend direction (e.g., bullish or bearish).
Trend Shift Diamonds – Marks points where the midline color changes, indicating a possible trend shift.
Deviation-Based Bands – Expands above and below the midline using ATR-based multipliers for volatility tracking.
RSI Gauge Display – A vertical gauge at the right side of the chart shows the current RSI level relative to the price channel.
Fully Customizable – Users can adjust LOWESS length, band width, colors, and enable or disable the RSI gauge and adjust RSIlength.
⯁ HOW TO USE
Use the LOWESS midline as a trend filter —bullish when green, bearish when purple.
Watch for trend shift diamonds as potential entry or exit signals.
Utilize the price bands to gauge overbought and oversold zones based on volatility.
Monitor the RSI gauge to confirm trend strength—high RSI near upper bands suggests overbought conditions, while low RSI near lower bands indicates oversold conditions.
⯁ CONCLUSION
The Lowess Channel + (RSI) indicator offers a powerful way to analyze market trends by applying a statistically robust smoothing algorithm. Unlike traditional moving averages, LOWESS filtering provides a flexible, responsive trendline that adapts to price movements. The integrated RSI gauge enhances decision-making by displaying momentum conditions alongside trend dynamics. Whether used for trend-following or mean reversion strategies, this indicator provides traders with a well-rounded perspective on market behavior.

Williams Fractals Ultimate (Donchian Adjusted)Williams Fractals Ultimate (Donchian Adjusted)
Understanding Williams Fractals
Williams Fractals are a simple yet powerful tool used to identify potential turning points in the market. They highlight local highs (up fractals) and local lows (down fractals) based on a set period.
An up fractal appears when a price peak is higher than the surrounding prices.
A down fractal appears when a price low is lower than the surrounding prices.
Fractals help traders spot support and resistance levels, potential trend reversals, and price breakout zones.
Why Adjust Fractals with the Donchian Channel?
The standard Williams Fractals method identifies local highs and lows without considering broader market context. This script enhances fractal accuracy by integrating the Donchian Channel, which tracks the highest highs and lowest lows over a set period.
- The Donchian Baseline is calculated as the average of the highest high and lowest low over a selected period.
- Fractals are filtered based on this baseline:
Up Fractals are only shown if they are above the Donchian baseline.
Down Fractals are only shown if they are below the Donchian baseline.
This filtering method removes weak signals and ensures that only relevant fractals aligned with market structure are displayed.
Key Features of the Script
Customizable Fractal & Donchian Periods – Allows traders to fine-tune fractal sensitivity.
Donchian-Based Filtering – Reduces noise and highlights meaningful fractals.
Fractal ZigZag Line (Optional) – Helps visualize price swings more clearly.
Why Is This So Effective?
Stronger trend signals – Filtering with the Donchian baseline eliminates unreliable fractals.
Clearer price action – The optional ZigZag line visually connects significant highs and lows.
Easy trend identification – Helps traders confirm breakout zones and key price levels.
This script is a technical analysis tool and does not guarantee profitable trades. Always combine it with other indicators and risk management strategies before making trading decisions.

Quarterly Theory ICT 03 [TradingFinder] Precision Swing Points🔵 Introduction
Precision Swing Point (PSP) is a divergence pattern in the closing of candles between two correlated assets, which can indicate a potential trend reversal. This structure appears at market turning points and highlights discrepancies between the price behavior of two related assets.
PSP typically forms in key timeframes such as 5-minute, 15-minute, and 90-minute charts, and is often used in combination with Smart Money Concepts (SMT) to confirm trade entries.
PSP is categorized into Bearish PSP and Bullish PSP :
Bearish PSP : Occurs when an asset breaks its previous high, and its middle candle closes bullish, while the correlated asset closes bearish at the same level. This divergence signals weakness in the uptrend and a potential price reversal downward.
Bullish PSP : Occurs when an asset breaks its previous low, and its middle candle closes bearish, while the correlated asset closes bullish at the same level. This suggests weakness in the downtrend and a potential price increase.
🟣 Trading Strategies Using Precision Swing Point (PSP)
PSP can be integrated into various trading strategies to improve entry accuracy and filter out false signals. One common method is combining PSP with SMT (divergence between correlated assets), where traders identify divergence and enter a trade only after PSP confirms the move.
Additionally, PSP can act as a liquidity gap, meaning that price tends to react to the wick of the PSP candle, making it a favorable entry point with a tight stop-loss and high risk-to-reward ratio. Furthermore, PSP combined with Order Blocks and Fair Value Gaps in higher timeframes allows traders to identify stronger reversal zones.
In lower timeframes, such as 5-minute or 15-minute charts, PSP can serve as a confirmation for more precise entries in the direction of the higher timeframe trend. This is particularly useful in scalping and intraday trading, helping traders execute smarter entries while minimizing unnecessary stop-outs.
🔵 How to Use
PSP is a trading pattern based on divergence in candle closures between two correlated assets. This divergence signals a difference in trend strength and can be used to identify precise market turning points. PSP is divided into Bullish PSP and Bearish PSP, each applicable for long and short trades.
🟣 Bullish PSP
A Bullish PSP forms when, at a market turning point, the middle candle of one asset closes bearish while the correlated asset closes bullish. This discrepancy indicates weakness in the downtrend and a potential price reversal upward.
Traders can use this as a signal for long (buy) trades. The best approach is to wait for price to return to the wick of the PSP candle, as this area typically acts as a liquidity level.
f PSP forms within an Order Block or Fair Value Gap in a higher timeframe, its reliability increases, allowing for entries with tight stop-loss and optimal risk-to-reward ratios.
🟣 Bearish PSP
A Bearish PSP forms when, at a market turning point, the middle candle of one asset closes bullish while the correlated asset closes bearish. This indicates weakness in the uptrend and a potential price decline.
Traders use this pattern to enter short (sell) trades. The best entry occurs when price retests the wick of the PSP candle, as this level often acts as a resistance zone, pushing price lower.
If PSP aligns with a significant liquidity area or Order Block in a higher timeframe, traders can enter with greater confidence and place their stop-loss just above the PSP wick.
Overall, PSP is a highly effective tool for filtering false signals and improving trade entry precision. Combining PSP with SMT, Order Blocks, and Fair Value Gaps across multiple timeframes allows traders to execute higher-accuracy trades with lower risk.
🔵 Settings
Mode :
2 Symbol : Identifies PSP and PCP between two correlated assets.
3 Symbol : Compares three assets to detect more complex divergences and stronger confirmation signals.
Second Symbol : The second asset used in PSP and correlation calculations.
Third Symbol : Used in three-symbol mode for deeper PSP and PCP analysis.
Filter Precision X Point : Enables or disables filtering for more precise PSP and PCP detection. This filter only identifies PSP and PCP when the base asset's candle qualifies as a Pin Bar.
Trend Effect : By changing the Trend Effect status to "Off," all Pin bars, whether bullish or bearish, are displayed regardless of the current market trend. If the status remains "On," only Pin bars in the direction of the main market trend are shown.
Bullish Pin Bar Setting : Using the "Ratio Lower Shadow to Body" and "Ratio Lower Shadow to Higher Shadow" settings, you can customize your bullish Pin bar candles. Larger numbers impose stricter conditions for identifying bullish Pin bars.
Bearish Pin Bar Setting : Using the "Ratio Higher Shadow to Body" and "Ratio Higher Shadow to Lower Shadow" settings, you can customize your bearish Pin bar candles. Larger numbers impose stricter conditions for identifying bearish Pin bars.
🔵 Conclusion
Precision Swing Point (PSP) is a powerful analytical tool in Smart Money trading strategies, helping traders identify precise market turning points by detecting divergences in candle closures between correlated assets. PSP is classified into Bullish PSP and Bearish PSP, each playing a crucial role in detecting trend weaknesses and determining optimal entry points for long and short trades.
Using the PSP wick as a key liquidity level, integrating it with SMT, Order Blocks, and Fair Value Gaps, and analyzing higher timeframes are effective techniques to enhance trade entries. Ultimately, PSP serves as a complementary tool for improving entry accuracy and reducing unnecessary stop-outs, making it a valuable addition to Smart Money trading methodologies.

Rally Base Drop SND Pivots Strategy [LuxAlgo X PineIndicators]This strategy is based on the Rally Base Drop (RBD) SND Pivots indicator developed by LuxAlgo. Full credit for the concept and original indicator goes to LuxAlgo.
The Rally Base Drop SND Pivots Strategy is a non-repainting supply and demand trading system that detects pivot points based on Rally, Base, and Drop (RBD) candles. This strategy automatically identifies key market structure levels, allowing traders to:
Identify pivot-based supply and demand (SND) zones.
Use fixed criteria for trend continuation or reversals.
Filter out market noise by requiring structured price formations.
Enter trades based on breakouts of key SND pivot levels.
How the Rally Base Drop SND Pivots Strategy Works
1. Pivot Point Detection Using RBD Candles
The strategy follows a rigid market structure methodology, where pivots are detected only when:
A Rally (R) consists of multiple consecutive bullish candles.
A Drop (D) consists of multiple consecutive bearish candles.
A Base (B) is identified as a transition between Rallies and Drops, acting as a pivot point.
The pivot level is confirmed when the formation is complete.
Unlike traditional fractal-based pivots, RBD Pivots enforce stricter structural rules, ensuring that each pivot:
Has a well-defined bullish or bearish price movement.
Reduces false signals caused by single-bar fluctuations.
Provides clear supply and demand levels based on structured price movements.
These pivot levels are drawn on the chart using color-coded boxes:
Green zones represent bullish pivot levels (Rally Base formations).
Red zones represent bearish pivot levels (Drop Base formations).
Once a pivot is confirmed, the high or low of the base candle is used as the reference level for future trades.
2. Trade Entry Conditions
The strategy allows traders to select from three trading modes:
Long Only – Only takes long trades when bullish pivot breakouts occur.
Short Only – Only takes short trades when bearish pivot breakouts occur.
Long & Short – Trades in both directions based on pivot breakouts.
Trade entry signals are triggered when price breaks through a confirmed pivot level:
Long Entry:
A bullish pivot level is formed.
Price breaks above the bullish pivot level.
The strategy enters a long position.
Short Entry:
A bearish pivot level is formed.
Price breaks below the bearish pivot level.
The strategy enters a short position.
The strategy includes an optional mode to reverse long and short conditions, allowing traders to experiment with contrarian entries.
3. Exit Conditions Using ATR-Based Risk Management
This strategy uses the Average True Range (ATR) to calculate dynamic stop-loss and take-profit levels:
Stop-Loss (SL): Placed 1 ATR below entry for long trades and 1 ATR above entry for short trades.
Take-Profit (TP): Set using a Risk-Reward Ratio (RR) multiplier (default = 6x ATR).
When a trade is opened:
The entry price is recorded.
ATR is calculated at the time of entry to determine stop-loss and take-profit levels.
Trades exit automatically when either SL or TP is reached.
If reverse conditions mode is enabled, stop-loss and take-profit placements are flipped.
Visualization & Dynamic Support/Resistance Levels
1. Pivot Boxes for Market Structure
Each pivot is marked with a colored box:
Green boxes indicate bullish demand zones.
Red boxes indicate bearish supply zones.
These boxes remain on the chart to act as dynamic support and resistance levels, helping traders identify key price reaction zones.
2. Horizontal Entry, Stop-Loss, and Take-Profit Lines
When a trade is active, the strategy plots:
White line → Entry price.
Red line → Stop-loss level.
Green line → Take-profit level.
Labels display the exact entry, SL, and TP values, updating dynamically as price moves.
Customization Options
This strategy offers multiple adjustable settings to optimize performance for different market conditions:
Trade Mode Selection → Choose between Long Only, Short Only, or Long & Short.
Pivot Length → Defines the number of required Rally & Drop candles for a pivot.
ATR Exit Multiplier → Adjusts stop-loss distance based on ATR.
Risk-Reward Ratio (RR) → Modifies take-profit level relative to risk.
Historical Lookback → Limits how far back pivot zones are displayed.
Color Settings → Customize pivot box colors for bullish and bearish setups.
Considerations & Limitations
Pivot Breakouts Do Not Guarantee Reversals. Some pivot breaks may lead to continuation moves instead of trend reversals.
Not Optimized for Low Volatility Conditions. This strategy works best in trending markets with strong momentum.
ATR-Based Stop-Loss & Take-Profit May Require Optimization. Different assets may require different ATR multipliers and RR settings.
Market Noise May Still Influence Pivots. While this method filters some noise, fake breakouts can still occur.
Conclusion
The Rally Base Drop SND Pivots Strategy is a non-repainting supply and demand system that combines:
Pivot-based market structure analysis (using Rally, Base, and Drop candles).
Breakout-based trade entries at confirmed SND levels.
ATR-based dynamic risk management for stop-loss and take-profit calculation.
This strategy helps traders:
Identify high-probability supply and demand levels.
Trade based on structured market pivots.
Use a systematic approach to price action analysis.
Automatically manage risk with ATR-based exits.
The strict pivot detection rules and built-in breakout validation make this strategy ideal for traders looking to:
Trade based on market structure.
Use defined support & resistance levels.
Reduce noise compared to traditional fractals.
Implement a structured supply & demand trading model.
This strategy is fully customizable, allowing traders to adjust parameters to fit their market and trading style.
Full credit for the original concept and indicator goes to LuxAlgo.

Uptrick: Time Based ReversionIntroduction
The Uptrick: Time Based Reversion indicator is designed to provide a comprehensive view of market momentum and potential trend shifts by combining multiple moving averages, a streak-based trend analysis system, and adaptive color visualization. It helps traders identify strong trends, spot potential reversals, and make more informed trading decisions.
Purpose
The primary goal of this indicator is to assist traders in distinguishing between sustained market movements and short-lived fluctuations. By evaluating how price behaves relative to its moving averages, and by measuring consecutive streaks above or below these averages, the indicator highlights areas where trends are likely to continue or lose momentum.
Overview
Uptrick: Time Based Reversion calculates one or more moving averages of price data and then tracks the number of consecutive bars (streaks) above or below these averages. This streak-based detection provides insight into whether a trend is gaining strength or nearing a potential reversal point. The indicator offers:
• Multiple moving average types (SMA, EMA, WMA)
• Optional second and third moving average layers for additional smoothing of first moving average
• A streak detection system to quantify trend intensity
• A dynamic color scheme that changes with streak strength
• Optional buy and sell signals for potential trade entries and exits
• A ribbon mode that applies moving averages to Open, High, Low, and Close prices for a more detailed visualization of overall trend alignment
Originality and Uniqueness
Unlike traditional moving average indicators, Uptrick: Time Based Reversion incorporates a streak measurement system to detect trend strength. This approach helps clarify whether a price movement is merely a quick fluctuation or part of a longer-lasting trend. Additionally, the optional ribbon mode extends this logic to Open, High, Low, and Close prices, creating a layered and intuitive visualization that shows complete trend alignment.
Inputs and Features
1. Enable Ribbon Mode
This input lets you activate or deactivate the ribbon display of multiple moving averages. When enabled, the script plots moving averages for the Open, High, Low, and Close prices and uses color fills to show whether these four data points are collectively above or below their respective moving averages.
2. Color Scheme Selection
Users can choose from several predefined color schemes, such as Default, Emerald, Crimson, Sapphire, Gold, Purple, Teal, Orange, Gray, Lime, or Aqua. Each scheme assigns distinct bullish, bearish and neutral colors..
3. Show Buy/Sell Signals
The indicator can display buy or sell signals based on its streak analysis logic. These signals appear as markers on the chart, indicating a “Safe Uptrend” (buy) or “Safe Downtrend” (sell).
4. Moving Average Types and Lengths
• First MA Type and Length: Choose SMA, EMA, or WMA along with a customizable period.
• Second and Third MA Types and Lengths: You can optionally stack additional moving averages for further smoothing, each with its own customizable type and period.
5. Streak Threshold Multiplier
This numeric input determines how strong a streak must be before the script considers it a “safe” trend. A higher multiplier requires a longer or more intense streak for a buy or sell signal.
6. Dynamic Transparency Calculation
The color intensity adapts to the streak’s strength. Longer streaks increase the transparency of the opposing color, making the current dominant color stand out. This feature ensures that a vigorous uptrend or downtrend is visually distinct from short-lived or weaker moves.
7. Ribbon Moving Averages
In ribbon mode, the script calculates moving averages for the Open, High, Low, and Close prices. Each of these is optionally smoothed again if the second and/or third moving average layers are active. The final result is a ribbon of moving averages that helps confirm whether the market is uniformly aligned above or below these key reference points.
Calculation Methodology
1. Initial Moving Average
The script calculates the first moving average (SMA, EMA, or WMA) of the closing price over a user-defined period.
2. Optional Secondary and Tertiary Averages
If selected, the script then applies a second and/or third smoothing step. Each of these steps can be a different type of moving average (SMA, EMA, or WMA) with its own period length.
3. Streak Detection
The indicator counts consecutive bars above or below the smoothed moving average. A running total (streakUp or streakDown) increments with every bar that remains above or below that average.
4. Reversion Intensity
The script compares the current streak value to its own average (calculated over the final chosen period). This ratio determines whether the streak is nearing a likely reversion or is strong enough to continue.
5. Color Assignment and Signals
The indicator calculates color transparency based on streak intensity. Buy and sell signals appear when the streak meets or exceeds the threshold multiplier, indicating a safe uptrend or downtrend.
Color Schemes and Visualization
This indicator offers multiple predefined color sets. Each scheme specifies a unique bullish color, bearish color and neutral color. The script automatically varies transparency to highlight strong trends and fade weaker ones, making it visually clear when a trend is intensifying or losing momentum.
Smoothing Techniques
By allowing up to three layers of moving average smoothing, the indicator accommodates different trading styles. A single layer provides faster reactions to market changes, while more layers reduce noise at the cost of slower responsiveness. Traders can choose the right balance between responsiveness and stability for their strategy, whether it is short-term scalping or long-term trend following.
Why It Combines Specific Smoothing Techniques
The Uptrick: Time Based Reversion indicator strategically combines specific smoothing techniques—SMA, EMA, and WMA—to leverage their complementary strengths. The SMA provides stable and consistent trend identification by equally weighting all data points, while the EMA emphasizes recent price movements, allowing quicker responses to market changes. WMA enhances sensitivity to recent price shifts, which helps in detecting subtle momentum changes early. By integrating these methods in layers, the indicator effectively balances responsiveness with stability, helping traders clearly identify genuine trend changes while filtering out short-term noise and false signals.
Ribbon Mode
If Open, High, Low, and Close prices remain above or below their respective moving averages consistently, the script colors the bars fully bullish or bearish. When the data points are mixed, a neutral color is applied. This mode provides a thorough perspective on whether the entire price range is aligned in one direction or showing conflicting signals.
Summary
Uptrick: Time Based Reversion combines multiple moving averages, streak detection, and dynamic color adjustments to help traders identify significant trends and potential reversal areas. Its flexibility allows it to be used either in a simpler form, with one moving average and streak analysis, or in a more advanced configuration with ribbon mode that charts multiple smoothed averages for a deeper understanding of price alignment. By adapting color intensities based on streak strength and providing optional buy/sell signals, this indicator delivers a clear and flexible tool suited to various trading strategies.
Disclaimer
This indicator is designed as an analysis aid and does not guarantee profitable trades. Past performance does not indicate future success, and market conditions can change unexpectedly. Users are advised to employ proper risk management and thoroughly evaluate trades before taking positions. Use this indicator as part of a broader strategy, not as a sole decision-making tool.

Heikin-Ashi Reversals with Region & DotsIf you want to use Heiken Ashi candles as a way to screen for bullish and bearish reversal.
Green background is stay long and strong. Red background = potential top or bearish continuation.
Yellow dots show strong red heiken ashi candles with small upside wicks. The next candle determines whether it should be green or red. If next heiken ashi candle closes above the current candle = green, bull trend still in line. If next heiken ashi candle closes below, then time to sell

MTF Round Level Reversal [RunRox]🧲 MTF Round Level Reversal is an indicator designed to highlight price levels on the chart where the market encountered significant resistance or support at round numbers, failing to break through large clusters of orders.
In many cases, price revisits these round-number levels to absorb the remaining liquidity, offering potential reversal or continuation trade opportunities.
✏️ EXAMPLE
Here’s an example demonstrating how this indicator works and how its logic is structured:
As shown in the screenshot above, price encountered resistance at round-number levels, clearly reacting off these areas.
Afterward, the market pulled back, presenting opportunities to enter trades targeting these previously established open levels.
This logic is based on the observation that price often seeks to revisit these open round-number levels due to the residual liquidity resting there.
While effective across various markets, this indicator performs particularly well with stocks or assets priced at higher values.
For a level to appear on the chart, price must first encounter a round-number value and clearly reverse from it, leaving a visible reaction on the chart. After this occurs, the indicator will mark this level as fully formed and display it as an active reversal area.
⚙️ SETTINGS
🔷 Timeframe – Choose any timeframe from which you’d like the indicator to source level data.
🔷 Period – Defines the number of candles required on both sides (left and right) to confirm and fully form a level.
🔷 Rounding Level – Adjusts price rounding precision when detecting levels (from 0.0001 up to 5000).
🔷 Color – Customize the color and transparency of displayed levels.
🔷 Line Style – Select the desired line style for level visualization.
🔷 Label Size – Set the font size for the level labels displayed on the chart.
🔷 Move Label to the Right – Move level labels to the right side of the screen for better visibility.
🔷 Label Offset – Specifies how many bars labels should be offset from the chart’s right edge.
🔷 Delete Filled Level – Automatically removes levels from the chart after they’ve been revisited or filled.
🔷 Calculation Bars – Determines the number of recent bars considered when calculating and identifying levels.
🔶 There are numerous ways to apply this indicator in your trading strategy. You can look for trades targeting these round-number levels or identify reversal setups forming at these high-liquidity zones. The key insight is understanding that these levels represent significant liquidity areas, which price frequently revisits and retests.
We greatly appreciate your feedback and suggestions to further improve and enhance this indicator!