Ratio Chart with GMMA■About this indicator
This indicator divides the selected stocks by any stocks you specify and plots the result in a new pane.
At the same time, it plots the GMMA against the result of the division.
This allows you to see the relative chart and trend of the selected stock and the arbitrary stock.
Quote Symbol: Specify the denominator of the division. The default is TOPIX. Feel free to change it.
EMA Days: 5 to 30 days are indicated in green, and 75 to 200 days in red. Change the number of days and color freely.
Explanation of Effective Usage
It is recommended to enter an index for stocks specified in the Quote Symbol.
By entering the index, you can check the superiority of the selected issue and the index at a glance.
Example: By dividing AAPL by SP500, you can see on the chart whether AAPL is stronger or weaker relative to SP500.
(Similar concept to the Relative Strength Comparison RSC.)
At the same time, by plotting GMMA, you can confirm the trend of strength or weakness of the selected issue divided by the index. This is useful for swing trading and mid- to long-term trading.
The greater the distance between the short-term and long-term EMAs of the GMMA, the more the selected stocks outperform the index, and when the short-term and long-term EMAs cross, the trend ends and the stock underperforms the index.
■About the Chart
The screen below shows a chart plotted using this indicator.
For comparison with the regular chart, the upper screen shows only the GMMA plotted for the selected stocks.
From the red circle in the lower screen, a trend begins where the selected stocks outperform the index, and the trend ends at the blue circle.
When the trend ends, the selected stocks will underperform the index and it can be determined that it is more efficient to invest in another stock.
■このインジケーターについて
このインジケーターは選択している銘柄を、指定した任意の銘柄で割り算し、その結果を新規ペインにプロットします。
同時に、割り算の結果に対してGMMAをプロットします。
これにより選択した銘柄と、任意の銘柄の相対チャートとトレンドを把握することが出来ます。
Quote Symbol:割り算の分母を指定します。デフォルトはTOPIXです。自由に変更して下さい。
EMA日数:5~30日が緑、75~200日を赤で表記しています。日数と色は自由に変更して下さい。
■有効な使い方の説明
Quote Symbolで指定する銘柄は、指数を入力することを推奨します。
指数を入力することによって、選択した銘柄と指数の優位性を一目で確認出来ます。
例)AAPLをSP500で割ることで、SP500に比べてAAPLが相対的に強いのか、弱いのかをチャートで把握できます。
(相対力比較RSCと似たような考え方です。)
同時にGMMAをプロットすることで、選択した銘柄÷指数の強弱のトレンドを確認できます。これはスイングトレードや中長期トレードに役立ちます。
GMMAの短期EMAと長期EMAの距離が開いていくほど、指数より選択した銘柄がアウトパフォームしていると考えられ、短期EMAと長期EMAが交わるとトレンドは終了し、指数をアンダーパフォームします。
■チャートについて
下の画面がこのインジケーターを使用してプロットしたチャートです。
通常のチャートとの比較のため、上画面には選択した銘柄にGMMAだけをプロットしたものを表示しています。
下の画面の赤い丸から、選択した銘柄が指数をアウトパフォームするトレンドが始まり、青い〇でトレンドは終了します。
トレンドが終了した場合、選択した銘柄は指数をアンダーパフォームするので、別の銘柄に投資する方が効率的と判断できます。
Ratio

[INVX] P/E band (panel)What is it?
The P/E Bollinger Band indicator is a hybrid tool combining fundamental analysis (P/E ratio) with technical analysis (Bollinger Bands).
It uses Bollinger Bands around a company's P/E ratio to identify potentially overvalued or undervalued zones.
The P/E ratio itself measures a stock's price relative to its earnings per share.
The Bollinger Bands, based on standard deviations, create a dynamic upper and lower band around the average P/E ratio.
Why P/E Bollinger Band?
Provides a visual representation of a company's relative valuation compared to its historical P/E range.
Can help identify areas where the P/E ratio might be deviating significantly from its historical norm.
Who should use it
Investors who combine technical and fundamental analysis for a more comprehensive stock evaluation.
Value investors seeking to identify potentially undervalued companies.
How to use
A P/E value that breaches the upper Bollinger Band suggests potential overvaluation, indicating the stock might be due for a price correction.
Conversely, a P/E value that falls below the lower Bollinger Band might signal undervaluation, presenting a potential buying opportunity (considering the company's fundamentals remain sound).

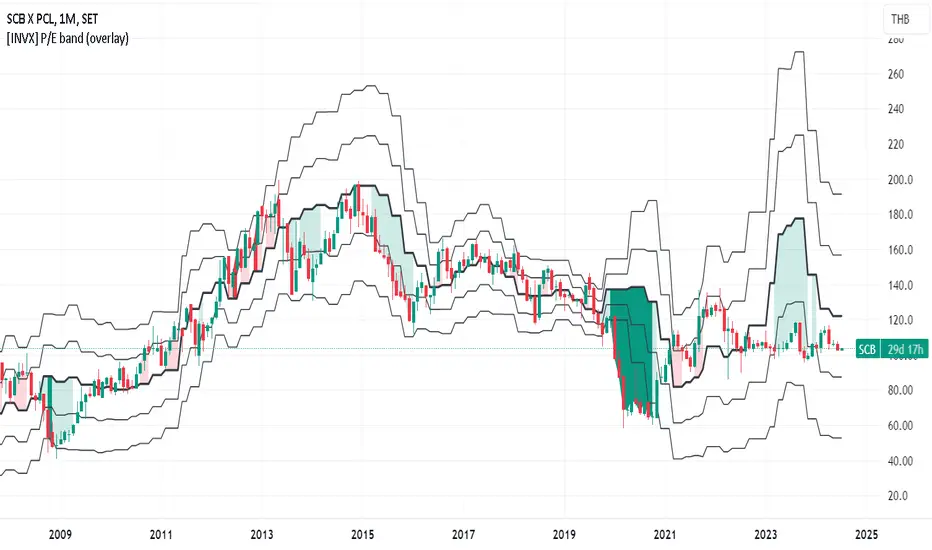
[INVX] P/E band (overlay)What is it?
The P/E Bollinger Band indicator is a hybrid tool combining fundamental analysis (P/E ratio) with technical analysis (Bollinger Bands).
It uses Bollinger Bands around a company's P/E ratio to identify potentially overvalued or undervalued zones.
The P/E ratio itself measures a stock's price relative to its earnings per share.
The Bollinger Bands, based on standard deviations, create a dynamic upper and lower band around the average P/E ratio.
Why P/E Bollinger Band?
Provides a visual representation of a company's relative valuation compared to its historical P/E range.
Can help identify areas where the P/E ratio might be deviating significantly from its historical norm.
Who should use it
Investors who combine technical and fundamental analysis for a more comprehensive stock evaluation.
Value investors seeking to identify potentially undervalued companies.
How to use
A P/E value that breaches the upper Bollinger Band suggests potential overvaluation, indicating the stock might be due for a price correction.
Conversely, a P/E value that falls below the lower Bollinger Band might signal undervaluation, presenting a potential buying opportunity (considering the company's fundamentals remain sound).
Global Financial IndexIntroducing the "Global Financial Index" indicator on TradingView, a meticulously crafted tool derived from extensive research aimed at providing the most comprehensive assessment of a company's financial health, profitability, and valuation. Developed with the discerning trader and investor in mind, this indicator amalgamates a diverse array of financial metrics, meticulously weighted and balanced to yield optimal results.
Financial Strength:
Financial strength is a cornerstone of a company's stability and resilience in the face of economic challenges. It encompasses various metrics that gauge the company's ability to meet its financial obligations, manage its debt, and generate sustainable profits. In our Global Financial Index indicator, the evaluation of financial strength is meticulously crafted to provide investors with a comprehensive understanding of a company's fiscal robustness. Let's delve into the key components and the rationale behind their inclusion:
1. Current Ratio:
The Current Ratio serves as a vital indicator of a company's liquidity position by comparing its current assets to its current liabilities.
A ratio greater than 1 indicates that the company possesses more short-term assets than liabilities, suggesting a healthy liquidity position and the ability to meet short-term obligations promptly.
By including the Current Ratio in our evaluation, we emphasize the importance of liquidity management in sustaining business operations and weathering financial storms.
2. Debt to Equity Ratio:
The Debt to Equity Ratio measures the proportion of a company's debt relative to its equity, reflecting its reliance on debt financing versus equity financing.
A higher ratio signifies higher financial risk due to increased debt burden, potentially leading to liquidity constraints and solvency issues.
Incorporating the Debt to Equity Ratio underscores the significance of balancing debt levels to maintain financial stability and mitigate risk exposure.
3. Interest Coverage Ratio:
The Interest Coverage Ratio assesses a company's ability to service its interest payments with its operating income.
A higher ratio indicates a healthier financial position, as it implies that the company generates sufficient earnings to cover its interest expenses comfortably.
By evaluating the Interest Coverage Ratio, we gauge the company's capacity to manage its debt obligations without compromising its profitability or sustainability.
4. Altman Z-Score:
The Altman Z-Score, developed by Edward Altman, is a composite metric that predicts the likelihood of a company facing financial distress or bankruptcy within a specific timeframe.
It considers multiple financial ratios, including liquidity, profitability, leverage, and solvency, to provide a comprehensive assessment of a company's financial health.
The Altman Z-Score categorizes companies into distinct risk groups, allowing investors to identify potential warning signs and make informed decisions regarding investment or credit exposure.
By integrating the Altman Z-Score, we offer a nuanced perspective on a company's financial viability and resilience in turbulent market conditions.
Profitability Rank:
Profitability rank is a crucial aspect of investment analysis that evaluates a company's ability to generate profits relative to its peers and industry benchmarks. It involves assessing various profitability metrics to gauge the efficiency and effectiveness of a company's operations and management. In our Global Financial Index indicator, the profitability rank segment is meticulously designed to provide investors with a comprehensive understanding of a company's profitability dynamics. Let's delve into the key components and rationale behind their inclusion:
1. Return on Equity (ROE):
Return on Equity measures a company's net income generated relative to its shareholders' equity.
A higher ROE indicates that a company is generating more profits with its shareholders' investment, reflecting efficient capital utilization and strong profitability.
By incorporating ROE, we assess management's ability to generate returns for shareholders and evaluate the overall profitability of the company's operations.
2. Gross Profit Margin:
Gross Profit Margin represents the percentage of revenue retained by a company after accounting for the cost of goods sold (COGS).
A higher gross profit margin indicates that a company is effectively managing its production costs and pricing strategies, leading to greater profitability.
By analyzing gross profit margin, we evaluate a company's pricing power, cost efficiency, and competitive positioning within its industry.
3. Operating Profit Margin:
Operating Profit Margin measures the percentage of revenue that remains after deducting operating expenses, such as salaries, rent, and utilities.
A higher operating profit margin signifies that a company is efficiently managing its operating costs and generating more profit from its core business activities.
By considering operating profit margin, we assess the underlying profitability of a company's operations and its ability to generate sustainable earnings.
4. Net Profit Margin:
Net Profit Margin measures the percentage of revenue that remains as net income after deducting all expenses, including taxes and interest.
A higher net profit margin indicates that a company is effectively managing its expenses and generating greater bottom-line profitability.
By analyzing net profit margin, we evaluate the overall profitability and financial health of a company, taking into account all expenses and income streams.
Valuation Rank:
Valuation rank is a fundamental aspect of investment analysis that assesses the attractiveness of a company's stock price relative to its intrinsic value. It involves evaluating various valuation metrics to determine whether a stock is undervalued, overvalued, or fairly valued compared to its peers and the broader market. In our Global Financial Index indicator, the valuation rank segment is meticulously designed to provide investors with a comprehensive perspective on a company's valuation dynamics. Let's explore the key components and rationale behind their inclusion:
1. Price-to-Earnings (P/E) Ratio:
The Price-to-Earnings ratio is a widely used valuation metric that compares a company's current stock price to its earnings per share (EPS).
A lower P/E ratio may indicate that the stock is undervalued relative to its earnings potential, while a higher ratio may suggest overvaluation.
By incorporating the P/E ratio, we offer insight into market sentiment and investor expectations regarding a company's future earnings growth prospects.
2. Price-to-Book (P/B) Ratio:
The Price-to-Book ratio evaluates a company's market value relative to its book value, which represents its net asset value per share.
A P/B ratio below 1 may indicate that the stock is trading at a discount to its book value, potentially signaling an undervalued opportunity.
Conversely, a P/B ratio above 1 may suggest overvaluation, as investors are paying a premium for the company's assets.
By considering the P/B ratio, we assess the market's perception of a company's tangible asset value and its implications for investment attractiveness.
3. Dividend Yield:
Dividend Yield measures the annual dividend income received from owning a stock relative to its current market price.
A higher dividend yield may indicate that the stock is undervalued or that the company is returning a significant portion of its profits to shareholders.
Conversely, a lower dividend yield may signal overvaluation or a company's focus on reinvesting profits for growth rather than distributing them as dividends.
By analyzing dividend yield, we offer insights into a company's capital allocation strategy and its implications for shareholder returns and valuation.
4. Discounted Cash Flow (DCF) Analysis:
Discounted Cash Flow analysis estimates the present value of a company's future cash flows, taking into account the time value of money.
By discounting projected cash flows back to their present value using an appropriate discount rate, DCF analysis provides a fair value estimate for the company's stock.
Comparing the calculated fair value to the current market price allows investors to assess whether the stock is undervalued, overvalued, or fairly valued.
By integrating DCF analysis, we offer a rigorous framework for valuing stocks based on their underlying cash flow generation potential.
Earnings Transparency:
Mitigating the risk of fraudulent financial reporting is crucial for investors. The indicator incorporates the Beneish M-Score, a robust model designed to detect earnings manipulation or financial irregularities. By evaluating various financial ratios and metrics, this component provides valuable insights into the integrity and transparency of a company's financial statements, aiding investors in mitigating potential risks.
Overall Score:
The pinnacle of the "Global Financial Index" is the Overall Score, a comprehensive amalgamation of financial strength, profitability, valuation, and manipulation risk, further enhanced by the inclusion of the Piotroski F-Score. This holistic score offers investors a succinct assessment of a company's overall health and investment potential, facilitating informed decision-making.
The weighting and balancing of each metric within the indicator have been meticulously calibrated to ensure accuracy and reliability. By amalgamating these diverse metrics, the "Global Financial Index" empowers traders and investors with a powerful tool for evaluating investment opportunities with confidence and precision.
This indicator is provided for informational purposes only and does not constitute financial advice, investment advice, or any other type of advice. The information provided by this indicator should not be relied upon for making investment decisions. Trading and investing in financial markets involves risk, and you should carefully consider your financial situation and consult with a qualified financial advisor before making any investment decisions. Past performance is not necessarily indicative of future results. The creator of this indicator makes no representations or warranties of any kind, express or implied, about the completeness, accuracy, reliability, suitability, or availability with respect to the indicator or the information contained herein. Any reliance you place on such information is therefore strictly at your own risk. By using this indicator, you agree to assume full responsibility for any and all gains and losses, financial, emotional, or otherwise, experienced, suffered, or incurred by you.

Buffett Quality Score [Industry]The Buffett Quality Score is a composite indicator developed to assess the financial health and quality of companies operating within the Industrial sector. It combines a carefully selected set of financial ratios, each weighted with specific thresholds, to provide a comprehensive evaluation of company performance.
Selected Financial Ratios and Criteria:
1. Return on Assets (ROA) > 5%
ROA measures a company's profitability by evaluating how effectively it utilizes its assets. An ROA exceeding 5% earns 1 point.
2. Debt to Equity Ratio < 1.0
The Debt to Equity Ratio reflects a company's leverage. A ratio below 1.0 earns 1 point, indicating lower reliance on debt financing.
3. Interest Coverage Ratio > 3.0
The Interest Coverage Ratio assesses a company's ability to meet interest payments. A ratio above 3.0 earns 1 point, indicating strong financial health.
4. Gross Margin % > 25%
Gross Margin represents the profitability of sales after deducting production costs. A margin exceeding 25% earns 1 point, indicating better pricing power.
5. Current Ratio > 1.5
The Current Ratio evaluates a company's liquidity by comparing current assets to current liabilities. A ratio above 1.5 earns 1 point, indicating sufficient short-term liquidity.
6. EBITDA Margin % > 15%
EBITDA Margin measures operating profitability, excluding non-operating expenses. A margin exceeding 15% earns 1 point, indicating efficient operations.
7. Altman Z-Score > 2.0
The Altman Z-Score predicts bankruptcy risk based on profitability, leverage, liquidity, solvency, and activity. A score above 2.0 earns 1 point, indicating financial stability.
8. EPS Basic One-Year Growth % > 5%
EPS One-Year Growth reflects the percentage increase in earnings per share over the past year. Growth exceeding 5% earns 1 point, indicating positive earnings momentum.
9. Revenue One-Year Growth % > 5%
Revenue One-Year Growth represents the percentage increase in revenue over the past year. Growth exceeding 5% earns 1 point, indicating healthy sales growth.
10. Piotroski F-Score > 6
The Piotroski F-Score evaluates fundamental strength based on profitability, leverage, liquidity, and operating efficiency. A score above 6 earns 1 point, indicating strong fundamental performance.
Score Calculation Process:
Each company is evaluated against these criteria.
For every criterion met or exceeded, 1 point is assigned.
The total points accumulated determine the Buffett Quality Score out of a maximum of 10.
Interpretation of Scores:
0-4 Points: Indicates potential weaknesses across multiple financial areas.
5 Points: Suggests average performance based on the selected criteria.
6-10 Points: Signifies strong overall financial health and quality, meeting or exceeding most of the performance thresholds.
Research and Development:
The selection and weighting of these specific financial ratios underwent extensive research to ensure relevance and applicability to the Industrial sector. This scoring methodology aims to provide valuable insights for investors and analysts seeking to evaluate company quality and financial robustness within the Industrial landscape.
The information provided about the Buffett Quality Score is for educational purposes only. This document serves as an illustrative example of financial evaluation methodology and should not be construed as financial advice, investment recommendation, or a guarantee of future performance. Actual results may vary based on individual circumstances and specific factors affecting each company. We recommend consulting qualified professionals for personalized financial advice tailored to your individual situation.

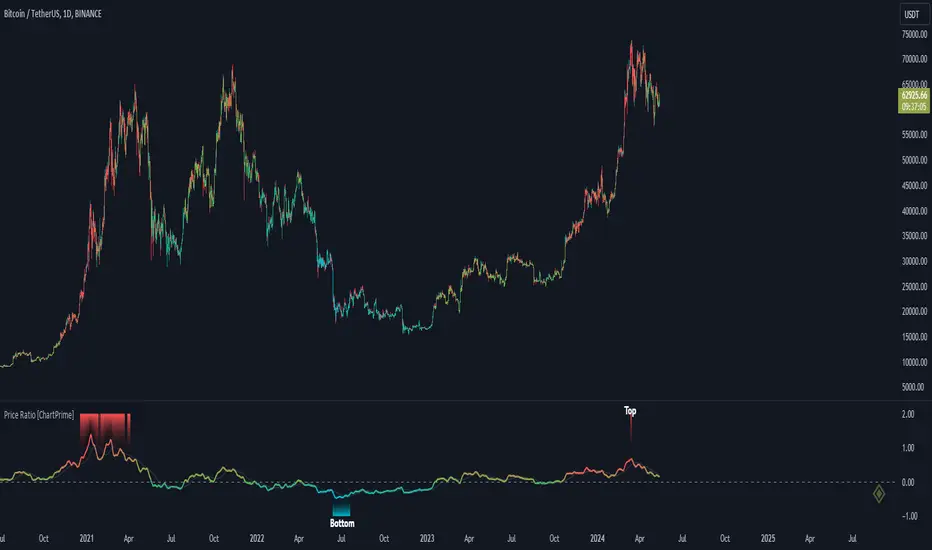
Price Ratio Indicator [ChartPrime]The Price Ratio Indicator is a versatile tool designed to analyze the relationship between the price of an asset and its moving average. It helps traders identify overbought and oversold conditions in the market, as well as potential trend reversals.
◈ User Inputs:
MA Length: Specifies the length of the moving average used in the calculation.
MA Type Fast: Allows users to choose from various types of moving averages such as Exponential Moving Average (EMA), Simple Moving Average (SMA), Weighted Moving Average (WMA), Volume Weighted Moving Average (VWMA), Relative Moving Average (RMA), Double Exponential Moving Average (DEMA), Triple Exponential Moving Average (TEMA), Zero-Lag Exponential Moving Average (ZLEMA), and Hull Moving Average (HMA).
Upper Level and Lower Level: Define the threshold levels for identifying overbought and oversold conditions.
Signal Line Length: Determines the length of the signal line used for smoothing the indicator's values.
◈ Indicator Calculation:
The indicator calculates the ratio between the price of the asset and the selected moving average, subtracts 1 from the ratio, and then smooths the result using the chosen signal line length.
// 𝙄𝙉𝘿𝙄𝘾𝘼𝙏𝙊𝙍 𝘾𝘼𝙇𝘾𝙐𝙇𝘼𝙏𝙄𝙊𝙉𝙎
//@ Moving Average's Function
ma(src, ma_period, ma_type) =>
ma =
ma_type == 'EMA' ? ta.ema(src, ma_period) :
ma_type == 'SMA' ? ta.sma(src, ma_period) :
ma_type == 'WMA' ? ta.wma(src, ma_period) :
ma_type == 'VWMA' ? ta.vwma(src, ma_period) :
ma_type == 'RMA' ? ta.rma(src, ma_period) :
ma_type == 'DEMA' ? ta.ema(ta.ema(src, ma_period), ma_period) :
ma_type == 'TEMA' ? ta.ema(ta.ema(ta.ema(src, ma_period), ma_period), ma_period) :
ma_type == 'ZLEMA' ? ta.ema(src + src - src , ma_period) :
ma_type == 'HMA' ? ta.hma(src, ma_period)
: na
ma
//@ Smooth of Source
src = math.sum(source, 5)/5
//@ Ratio Price / MA's
p_ratio = src / ma(src, ma_period, ma_type) - 1
◈ Visualization:
The main plot displays the price ratio, with color gradients indicating the strength and direction of the ratio.
The bar color changes dynamically based on the ratio, providing a visual representation of market conditions.
Invisible Horizontal lines indicate the upper and lower threshold levels for overbought and oversold conditions.
A signal line, smoothed using the specified length, helps identify trends and potential reversal points.
High and low value regions are filled with color gradients, enhancing visualization of extreme price movements.
MA type HMA gives faster changes of the indicator (Each MA has its own specifics):
MA type TEMA:
◈ Additional Features:
A symbol displayed at the bottom right corner of the chart provides a quick visual reference to the current state of the indicator, with color intensity indicating the strength of the ratio.
Overall, the Price Ratio Indicator offers traders valuable insights into price dynamics and helps them make informed trading decisions based on the relationship between price and moving averages. Adjusting the input parameters allows for customization according to individual trading preferences and market conditions.
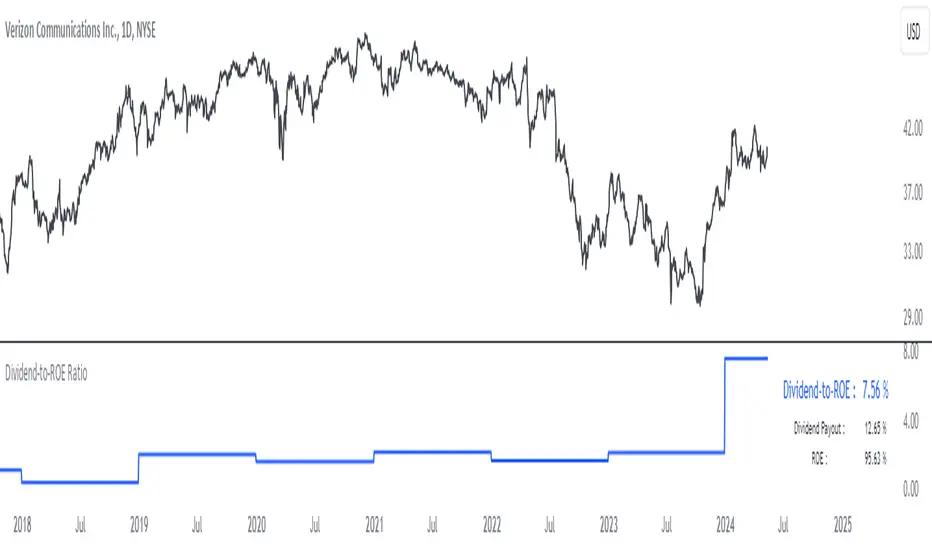
Dividend-to-ROE RatioDividend-to-ROE Ratio Indicator
The Dividend-to-ROE Ratio indicator offers valuable insights into a company's dividend distribution relative to its profitability, specifically comparing the Dividend Payout Ratio (proportion of earnings as dividends) to the Return on Equity (ROE), a measure of profitability from shareholder equity.
Interpretation:
1. Higher Ratio: A higher Dividend-to-ROE Ratio suggests a stable dividend policy, where a significant portion of earnings is returned to shareholders. This can indicate consistent dividend payments, often appealing to income-seeking investors.
2. Lower Ratio: Conversely, a lower ratio implies that the company retains more earnings for growth, potentially signaling a focus on reinvestment for future expansion rather than immediate dividend payouts.
3. Excessively High Ratio: An exceptionally high ratio may raise concerns. While it could reflect a generous dividend policy, excessively high ratios might indicate that a company is distributing more earnings than it can sustainably afford. This could potentially hinder the company's ability to reinvest in its operations, research, or navigate economic downturns effectively.
Utility and Applications:
The Dividend-to-ROE Ratio can be particularly useful in the following scenarios:
1. Income-Oriented Investors: For investors seeking consistent dividend income, a higher ratio signifies a company's commitment to distributing profits to shareholders, potentially aligning with income-oriented investment strategies.
2. Financial Health Assessment: Analysts and stakeholders can use this ratio to gauge a company's financial health and dividend sustainability. It provides insights into management's capital allocation decisions and strategic focus.
3. Comparative Analysis: When comparing companies within the same industry, this ratio helps in benchmarking dividend policies and identifying outliers with unusually high or low ratios.
Considerations:
1. Contextual Analysis: Interpretation should be contextualized within industry standards and the company's financial history. Comparing the ratio with peers in the same sector can provide meaningful insights.
2. Financial Health: It's crucial to evaluate this indicator alongside other financial metrics (like cash flow, debt levels, and profit margins) to grasp the company's overall financial health and sustainability of its dividend policy.
Disclaimer: This indicator is for informational purposes only and does not constitute financial advice. Investors should conduct thorough research and consult with financial professionals before making investment decisions based on this ratio.
CAPEX RatioUnderstanding the CAPEX Ratio: An Essential Financial Metric
Introduction
In the world of finance, understanding how companies allocate their resources and reinvest their earnings is crucial for investors and analysts. One fundamental metric used to assess a company's investment behavior is the CAPEX Ratio. This article delves into what the CAPEX Ratio signifies, its advantages, and how to interpret its implications.
What is the CAPEX Ratio?
The CAPEX Ratio, short for Capital Expenditure Ratio, is a financial indicator that measures the proportion of a company's capital expenditures (CAPEX) relative to various financial metrics such as revenue, free cash flow, net income, or total assets. CAPEX represents investments made by a company to acquire or maintain its physical assets.
Interpreting the Results
Each variant of the CAPEX Ratio provides unique insights into a company's financial strategy:
• CAPEX to Revenue Ratio: This ratio shows what portion of a company's revenue is being reinvested into capital investments. A higher ratio might indicate aggressive expansion plans or a need for infrastructure upgrades.
• CAPEX to Free Cash Flow Ratio: By comparing CAPEX with free cash flow, this ratio reveals how much of a company's available cash is dedicated to capital investments. It helps assess financial health and sustainability.
• CAPEX to Net Income Ratio: This ratio measures how much of a company's net income is being channeled back into capital expenditures. A high ratio relative to net income could signal a company's commitment to growth and development.
• CAPEX to Total Assets Ratio: This metric assesses the proportion of total assets being allocated towards capital expenditures. It provides a perspective on the company's investment intensity relative to its overall asset base.
Advantages of Using CAPEX Ratios
• Insight into Investment Strategy: Helps investors understand where a company is directing its resources.
• Evaluation of Financial Health: Indicates how efficiently a company is reinvesting profits or available cash.
• Comparative Analysis: Enables comparisons across companies or industries to gauge investment priorities.
How to Use the CAPEX Ratio
• Comparative Analysis: Compare the CAPEX Ratios over time or against industry peers to spot trends or outliers.
• Investment Decision-Making: Consider CAPEX Ratios alongside other financial metrics when making investment decisions.
Conclusion
In conclusion, the CAPEX Ratio is a valuable financial metric that offers deep insights into a company's investment behavior and financial health. By analyzing different variants of this ratio, investors and analysts can make informed decisions about a company's growth prospects and financial stability.

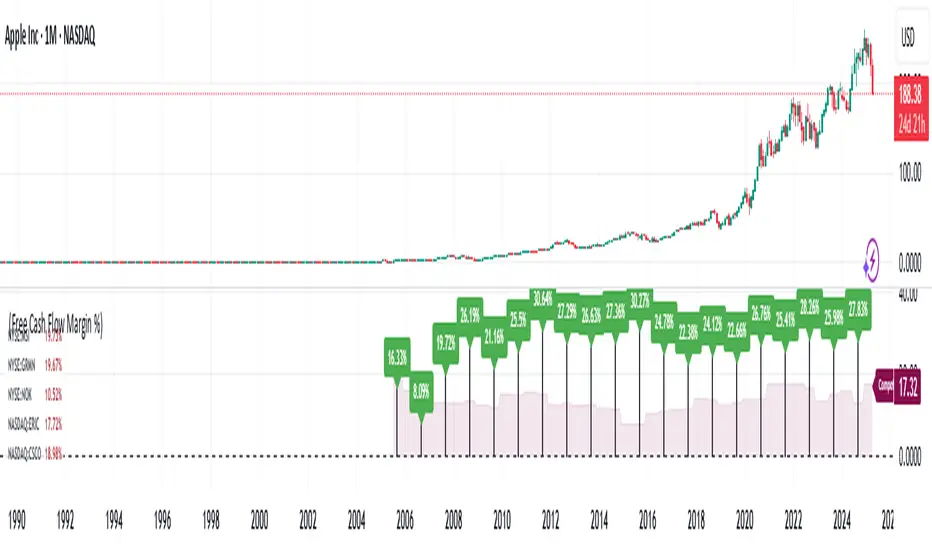
Financial Ratio Analysis (with / without Competitors)What Is Financial Ratio Analysis?
Financial Ratio Analysis is a quantitative technique used to assess a company's liquidity, operational efficiency, and profitability by examining its financial statements, including the balance sheet, income statement, and cash flow statement. It provides valuable insights into a company's performance over time and allows for comparisons with other companies within the same industry or sector.
What Are the Uses of Financial Ratio Analysis?
Analysis of financial ratios serves two main purposes:
1. Track company performance
Determining individual financial ratios per period and tracking the change in their values over time is done to spot trends that may be developing in a company.
Current Ratio for Adobe Inc. NASDAQ:ADBE
2. Make comparative judgments regarding company performance
Comparing financial ratios with those of major competitors enables the identification of whether a company is performing better or worse than the industry average. This comparative analysis aids in understanding the company's competitive position and potential areas for improvement.
For comparison, the script would automatically select a maximum of 5 competitors from the US markets based on the ticker's industry. This ensures a relevant comparison with industry peers to evaluate performance and assess competitive positioning.
To compare the Free Cash Flow Margin of Apple Inc. NASDAQ:AAPL with its competitors.
To compare the Free Cash Flow Margin of Apple Inc. NASDAQ:AAPL with its competitors’ average.
Customized competitors list
To customize your own competitors list, you can specify the companies or tickers you want to include in the comparison. This allows for a tailored analysis based on your specific preferences and industry knowledge.
Example:
To compare PayPal NASDAQ:PYPL with NASDAQ:MELI , NASDAQ:DLO , and NYSE:PAY , users can input the following text into the competitors list:
NASDAQ:MELI,NASDAQ:DLO,NASDAQ:PYPL,NYSE:PAY;
This will ensure that the comparison includes these specific companies alongside PayPal.
Financial ratios are grouped into the following categories:
Liquidity ratios
Leverage ratios
Efficiency ratios
Profitability ratios
Market value ratios
Liquidity Ratios
Liquidity ratios are financial ratios that measure a company’s ability to repay both short-term and long-term obligations.
Current Ratio measures a company’s ability to pay off short-term liabilities with current assets:
Current ratio = Total current assets / Total current liabilities
Cash To Debt Ratio measures a company’s ability to pay off short-term liabilities with cash and cash equivalents. A high ratio indicates a company can pay off its debt and remain solvent into the foreseeable future. In addition, it also means that if necessary, the company can take on a larger amount of debt because it has the cash to support that.
Cash to debt ratio = Cash and Short Term Investments / Total debt
Leverage Financial Ratios
Leverage ratios measure the amount of capital that comes from debt. In other words, leverage financial ratios are used to evaluate a company’s debt levels.
Debt To Assets Ratio measures the relative amount of a company’s assets that are provided from debt. This indicator is a measure of assets that are growing at the expense of debt. Because of this, you can see how a company acquired its assets over time. It can be used to assess a company's ability to meet its current debt obligations.
Debt to assets ratio = Total debt / Total assets
Debt To Equity Ratio calculates the weight of total debt and financial liabilities against shareholders’ equity:
Debt to equity ratio = Total liabilities / Shareholder’s equity
Interest Coverage Ratio shows how easily a company can pay its interest expenses:
Interest coverage ratio = Operating income / Interest expense
Efficiency Ratios
Efficiency ratios, also known as activity financial ratios, are used to measure how well a company is utilizing its assets and resources.
Research & Development (R&D) Expense to Revenue Ratio measures the percentage of sales that is allocated to R&D expenditures.
R&D to revenue ratio = Research and development expense / Total revenue * 100%
Asset Turnover Ratio measures a company’s ability to generate sales from assets. The higher it is, the more efficient the company is, since higher ratios mean that the company generates more income per dollar of assets. Conversely, if the company has a low Asset turnover, this indicates that it is inefficiently using its assets.
Asset turnover ratio = Revenue / Average total assets for two periods
Inventory Turnover shows how quickly a company sells its stock. A low turnover can mean weak sales, while a high one can mean good sales or insufficient stock. Inventory turnover is an important indicator of a company's performance.
Inventory turnover = Cost of goods sold / Total inventories
Days Sales Outstanding measures the average number of days it takes for a company to collect cash from credit purchases.
Days sales outstanding = Average Accounts Receivable / Revenue x 365 Days
Days Inventory shows the time in days that is spent turning a company's inventory into sales. This metric is an indicator of a company's inventory management. Low values are preferred for Days Inventory, which means items are selling faster and there is a quick turnaround. Large values indicate that a company has invested too much in stocks and does not have time to sell them.
Days inventory = Average inventories / Cost of goods sold * Days in period
Profitability Ratios
Profitability ratios measure a company’s ability to generate income relative to revenue, balance sheet assets, operating costs, and equity.
Gross Margin compares the gross profit of a company to its net sales to show how much profit a company makes after paying its cost of goods sold:
Gross margin % = Gross income / Total revenue * 100
Operating Margin , sometimes known as the return on sales ratio, compares the operating income of a company to its net sales to determine operating efficiency:
Operating margin = Operating income / Revenue * 100%
Free Cash Flow Margin is a profitability ratio that compares a company's free cash flow to its revenue to understand the proportion of revenue that becomes free cash flow. The higher the percentage, the more cash is available from sales. A company that shows an increasing cash flow margin from year to year is certainly getting stronger with time. This is a good indicator of its probability for long-term success.
Free cash flow margin = Free Cash Flow / Total Revenue
Return On Assets measures how efficiently a company is using its assets to generate profit. A high ROA indicates that a company successfully converts invested money into income.
Return on assets = Net income before discontinued operations / Total average assets
Return On Equity measures how efficiently a company is using its equity to generate profit:
Return on equity = Net income / Shareholder’s equity
Revenue Growth refers to the increase in a company’s total revenue or income over a specific period
Revenue growth = (Current period revenue - previous period revenue) / Previous period revenue * 100%
Earnings Per Share Growth illustrates the growth of earnings per share over time.
Earnings per share growth = ( Current period EPS - previous period EPS ) / Previous period EPS * 100%
Operating Cash Flow Growth is the long term rate of growth of operating cash, the money that is actually coming into the bank from business operations.
Operating cash flow growth = ( Current period operating cash flow - previous period operating cash flow) / Previous period operating cash flow* 100%
Market Value Ratios
Market value ratios are used to evaluate the share price of a company’s stock.
Book Value Per Share calculates the per-share value of a company based on the equity available to shareholders. In case of the company liquidation, the book value per share shows the monetary value remaining for common shareholders after all assets are sold and all debt is paid. If a company’s Book value per share is higher than a market price of its share, then the stock may be considered undervalued.
Book value per share = Total common equity / Total common shares outstanding
Dividend Yield measures the amount of dividends attributed to shareholders relative to the market value per share:
Dividend yield = Dividends TTM for the primary issue excluding special dividends / Price of the primary issue
Diluted Earnings per Share (Diluted EPS)
EPS stands for earnings per share. Investors use EPS to measure how much money a company makes for every outstanding share the company has. Diluted EPS is slightly different in that it measures the earnings per share for a company if all convertible securities (such as preferred stocks, convertible debt instruments, stock options and warrants) were used to calculate the metric.
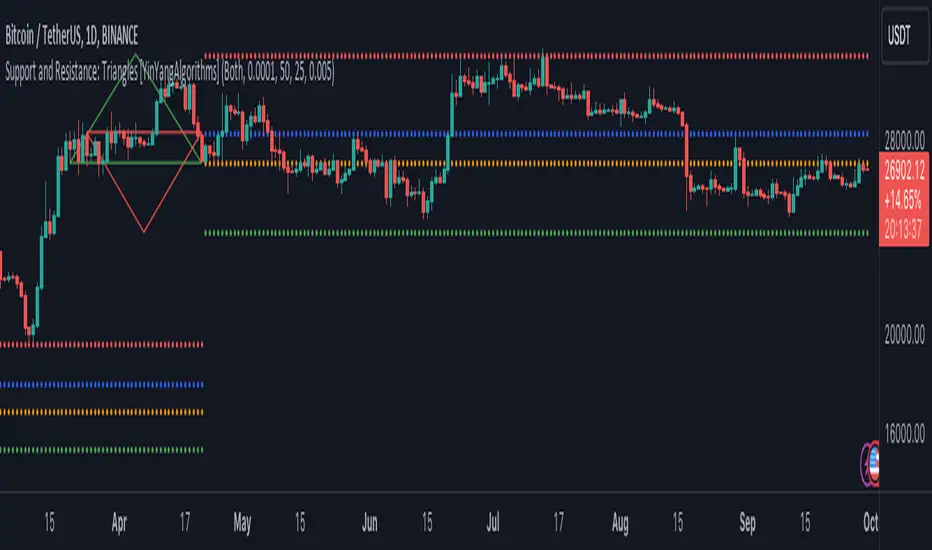
Support and Resistance: Triangles [YinYangAlgorithms]Overview:
Triangles have always been known to be the strongest shape. Well, why wouldn’t that likewise apply to trading? This Indicator will create Upwards and Downwards Triangles which in turn create Support and Resistance locations. For example, we find 2 highs that meet the criteria (within deviation %, Minimum Distance and Lookback Distance). We calculate the distance between these two and create an Equilateral Triangle Downwards (You can adjust the % if you want more of an Isosceles Triangle). The midpoint (tip) of this triangle is the Support and the bottom (base) of it is the Resistance. The exact opposite applies for an Upwards Triangle.
The reason why Triangles may make for good Support and Resistance locations is the % 's used, much like the fibonacci, use ratios relevant in nature and everywhere in the world around us, so why not for trading too?
Tutorial:
If you look at the locations we’ve circled above, all of them exhibit strong rejections are predictive Support and Resistance locations plotted by the triangles created. There can only ever be 1 Upward and 1 Downward Triangle at a time, so when a new one is created, the Support and Resistance locations are moved.
If you scroll back far enough you’ll notice the Triangles disappear but their Support and Resistance locations are still plotted. This has to do with the fact you are allowed only so many Lines plotted and when a new Triangle is created, an old one will be removed. The Support and Resistance locations however will stay.
If we look at the example above, you can see the Support and Resistance locations the Triangles made here may have helped predict where the price would struggle to surpass.
By default the Look Back Distance is set to 50 and the Min Distance is 10 (settings used in all previous examples). However, you can modify these to make Triangles more ‘Rare’ and therefore the Support and Resistance locations change less. In the example above for Instance we left Look Back Distance to 50 but changed Min Distance from 10 to 25. This results in Support and Resistance locations that may hold better in the long term.
If we scroll back a bit, we can see the settings ‘Look Back Distance’ 50 and ‘Minimum Distance’ 25 had done a decent job at predicting the ATH resistance and many Support and Resistance locations around it. Keep in mind, previous results don’t mean future results, but Triangles may create ratios which apply well to trading.
We will conclude our Tutorial here. Hopefully you can see the benefit to the ratio Triangles make when predicting Support and Resistance locations.
Settings:
Show Triangles: If all you want to know is the Support and Resistance locations, there’s no need to draw the Triangles.
Triangle Zones: What types of triangles should we create our zones for? Options are Upward, Downward, Both, None.
Max Deviation Allowed: Maximum Deviation up or down from the last bars High/Low for potential to create a Triangle.
Lookback Distance: How far back we look to see for potential of a High/Low within Deviation range.
Min Distance: This is so triangles are spaced properly and not from 2 bars beside each other. Min distance allocated between 2 points to create a Triangle.
Bar Percent Increase: How much % multiplier do we apply for each bar spacing of the triangle. 0.005 creates a close to Equilateral Triangle, but other values like 0.004 and 0.006 seem to work well too.
If you have any questions, comments, ideas or concerns please don't hesitate to contact us.
HAPPY TRADING!
Realized Profit & Loss [BigBeluga]The Realized Loss & Profit indicator aims to find potential dips and tops in price by utilizing the security function syminfo.basecurrency + "_LOSSESADDRESSES".
The primary objective of this indicator is to present an average, favorable buying/selling opportunity based on the number of people currently in profit or loss.
The script takes into consideration the syminfo.basecurrency, so it should automatically adapt to the current coin.
🔶 USAGE
Users have the option to enable the display of either Loss or Profit, depending on their preferred visualization.
Examples of displaying Losses:
Example of displaying Profits:
🔶 CONCEPTS
The concept aims to assign a score to the data in the ticker representing the realized losses. This score will provide users with an average of buying/selling points that are better to the typical investor.
🔶 SETTINGS
Users have complete control over the script settings.
🔹 Calculation
• Profit: Display people in profit on an average of the selected length.
• Loss: Display people in loss on an average of the selected length.
🔹 Candle coloring
• True: Color the candle when data is above the threshold.
• False: Do not color the candle.
🔹 Levels
- Set the level of a specific threshold.
• Low: Low losses (green).
• Normal: Low normal (yellow).
• Medium: Low medium (orange).
• High: Low high (red).
🔹 Z-score Length: Length of the z-score moving window.
🔹 Threshold: Filter out non-significant values.
🔹 Histogram width: Width of the histogram.
🔹 Colors: Modify the colors of the displayed data.
🔶 LIMITATIONS
• Since the ticker from which we obtain data works only on the daily timeframe, we are
restricted to displaying data solely from the 1D timeframe.
• If the coin does not have any realized loss data, we can't use this script.

The Strat with Continuity [starlord_xrp]This indicator shows entry and exit points for The Strat as well as potential setups. It also has full time frame continuity detection.

Ratio To Average - The Quant ScienceRatio To Average - The Quant Science is a quantitative indicator that calculates the percentage ratio of the market price in relation to a reference average. The indicator allows the calculation of the ratio using four different types of averages: SMA, EMA, WMA, and HMA. The ratio is represented by a series of histograms that highlight periods when the ratio is positive (in green) and periods when the ratio is negative (in red).
What is the Ratio to Average?
The Ratio to Average is a measure that tracks the price movements with one of its averages, calculating how much the price is above or below its own average, in percentage terms.
USER INTERFACE
Lenght: it adjusts the number of bars to include in the calculation of the average.
Moving Average: it allows you to choose the type of average to use.
Color Up/Color Down : it allows you to choose the color of the indicator for positive and negative ratios.

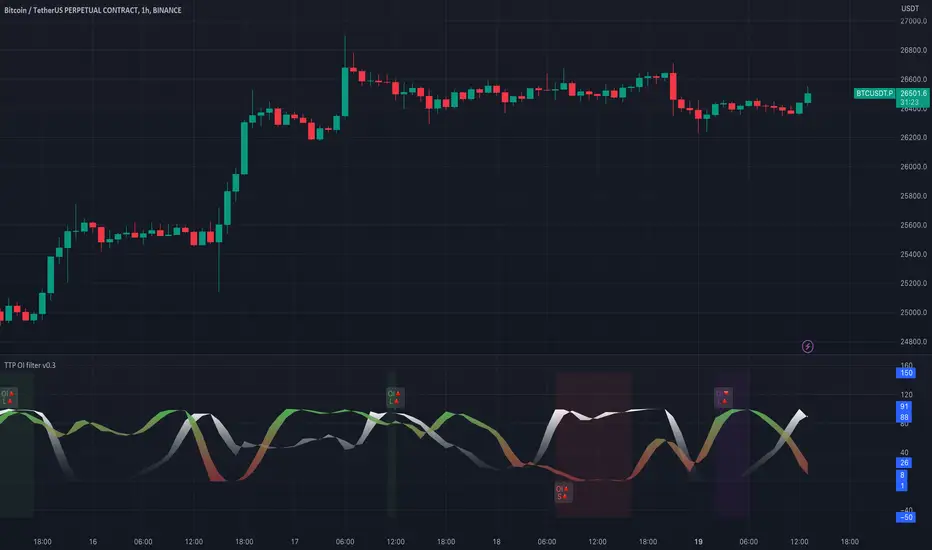
TTP OI + LS signal filterThis oscillator helps filtering specific conditions in the market based on open interest (OI) and the ratio of longs and shorts (LS) for crypto assets.
Currently it works with BINANCE:BTCUSDT.P but soon I'll be adding support for more assets.
It flags areas of interest like:
- Too many longs, too many shorts in the market
- Open interest too high or too low
It accepts an external signal as a source in which case filters can be applied to the original signal. For example the external signal might trigger and plot a 1 when RSI break below 70. By connecting such signal with this oscillator you'll be able to only pass-through the ones that occur when any of the areas of interest mentioned above are also valid.
If both filter are applied it acts as an OR. For example, if too many longs and too many shorts are active, it will pass through the signal in either condition.
The results of the original signal filtered is printed to be able to later use it in any external backtester strategy that accepts external sources too.
If external source signal is disabled it will trigger any time the combined filters are returning true.
Open interest and the ratio of longs/shorts is considered too high whenever the stochastic RSI calculation of the OI or ratio LS reaches a level above 80 and too low when below 20
The ratio of long/shorts is calculated by dividing the ratio of longs vs shorts from BITFINEX:BTCUSDLONGS and BITFINEX:BTCUSDSHORTS
Put to Call Ratio CorrelationHello!
Excited to share this with the community!
This is actually a very simple indicator but actually usurpingly helpful, especially for those who trade indices such as SPX, IWM, QQQ, etc.
Before I get into the indicator itself, let me explain to you its development.
I have been interested in the use of option data to detect sentiment and potential reversals in the market. However, I found option data on its own is full of noise. Its very difficult if not impossible for a trader to make their own subjective assessment about how option data is reflecting market sentiment.
Generally speaking, put to call ratios generally range between 0.8 to 1.1 on average. Unless there is a dramatic pump in calls or puts causing an aggressive spike up to over this range, or fall below this range, its really difficult to make the subjective assessment about what is happening.
So what I thought about trying to do was, instead of looking directly at put to call ratio, why not see what happens when you perform a correlation analysis of the PTC ratio to the underlying stock.
So I tried this in pinescript, pulling for Tradingview's ticker PCC (Total Equity Put to Call Ratio) and using the ta.correlation function against whichever ticker I was looking at.
I played around with this idea a bit, pulled the data into excel and from this I found something interesting. When there is a very significant negative or positive correlation between PTC ratio and price movement, we see a reversal impending. In fact, a significant negative or positive correlation (defined as a R value of 0.8 or higher or -0.8 or lower) corresponded to a stock reversal about 92% of the time when data was pulled on a 5 minute timeframe on SPY.
But wait, what is a correlation?
If you are not already familiar, a correlation is simply a statistical relationship. It is defined with a Pearson R correlation value which ranges from 0 (no correlation) to 1 (significant positive correlation) and 0 to -1 (significant negative correlation).
So what does positive vs negative mean?
A significant positive correlation means the correlation is moving the same as the underlying. In the case of this indicator, if there is a significant positive correlation could mean the stock price is climbing at the same time as the PTC ratio.
Inversely, it could mean the stock price is falling as well as the PTC ratio.
A significant negative correlation means the correlation is moving in the opposite direction. So in this case, if the stock price is climbing and the PTC ratio is falling proportionately, we would see a significant negative correlation.
So how does this work in real life?
To answer this, let's get into the actual indicator!
In the image above, you will see the arrow pointing to an area of significant POSITIVE correlation.
The indicator will paint the bars on the actual chart purple (customizable of course) to signify this is an area of significant correlation.
So, in the above example this means that the PTC ratio is increase proportionately to the increase in the stock price in the SAME direction (Puts are going up proportionately to the stock price). Thus, we can make the assumption that the underlying sentiment is overwhelmingly BEARISH. Why? Because option trading activity is significantly proportionate to stock movement, meaning that there is consensus among the options being traded and the movement of the market itself.
And in the above example we will see, the stock does indeed end up selling:
In this case, IWM fell roughly 1 point from where there was bearish consensus in the market.
Let's use this same trading day and same example to show the inverse:
You will see a little bit later, a significant NEGATIVE correlation developed.
In this case identified, the stock wise RISING and the PTC ratio was FALLING.
This means that Puts were not being bought up as much as calls and the sentiment had shifted to bullish .
And from that point, IWM ended up going up an additional 0.75 points from where there was a significant INVERSE correlation.
So you can see that it is helpful for identifying reversals. But what is also can be used for is identifying areas of LOW conviction. Meaning, areas where there really is no relationship between option activity and stock movement. Let's take spy on the 1 hour timeframe for this example:
You can see in the above example there really is no consensus in the option trading activity with the overarching sentiment. The price action is choppy and so too is option trading activity. Option traders are not pushing too far in one direction or the other. We can also see the lack of conviction in the option trading activity by looking at the correlation SMA (the white line).
When a ticker is experiencing volatile and good movement up and down, the SMA will generally trade to the top of the correlation range (roughly + 1.0) and then make a move down to the bottom (roughly - 1.0), see the example below:
When the SMA is not moving much and accumulating around the centerline, it generally means a lot of indecision.
Additional Indicator Information:
As I have said, the indicator is very simple. It pulls the data from the ticker PCC and runs a correlation assessment against whichever ticker you are on.
PCC pulls averaged data from all equities within the market and is not limited to a single equity. As such, its helpful to use this with indices such as SPY, IWM and QQQ, but I have had success with using it on individual tickers such as NVDA and AMD.
The correlation length is defaulted to 14. You can modify it if you wish, but I do recommend leaving it at this as the default and the testing I have done with this have all been on the 14 correlation length.
You can chose to smooth the SMA over whichever length of period you wish as well.
When the indicator is approaching a significant negative or positive relationship, you will see the indicator flash red in the upper or lower band to signify the relationship. As well, the chart will change the bar colour to purple:
Everything else is pretty straight forward.
Let me know your questions/comments or suggestions around the indicator and its applications.
As always, no indicator is meant to provide a single, reliable strategy to your trading regimen and no indicator or group of indicators should be relied on solely. Be sure to do your own analysis and assessments of the stock prior to taking any trades.
Safe trades everyone!

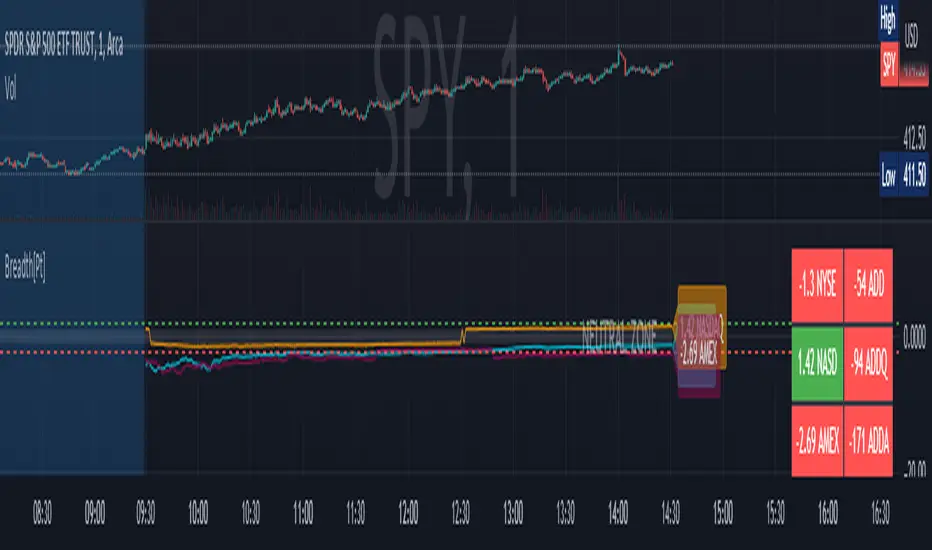
Market Breadth Ratio [Pt]The Market Breadth Indicator is a technical analysis tool that provides traders and investors with valuable insights into the overall health of the stock market. This particular version of the indicator plots the Up Volume vs Down Volume Ratios for three major U.S. stock exchanges - NYSE, NASDAQ and AMEX - on a single chart.
The Up Volume vs Down Volume Ratios measure the strength of buying versus selling pressure in the market. A ratio greater than 1 indicates that there is more buying pressure, while a ratio less than -1 indicates more selling pressure. The ratio is calculated by dividing the total volume of stocks that closed up on the day by the total volume of stocks that closed down.
By plotting the Up Volume vs Down Volume Ratios for all three exchanges, the Market Breadth Indicator provides a comprehensive view of the overall market sentiment. If all three ratios are above 1, it indicates that the market is in a bullish trend, while if all three ratios are below -1, it indicates a bearish trend. A divergence between the ratios can also signal potential shifts in market sentiment.
Traders can use the Market Breadth Indicator to confirm the direction of the market and identify potential buying or selling opportunities. For example, if the market is in a bullish trend and the NYSE ratio is consistently higher than the other two ratios, it may indicate that the NYSE is leading the market and traders may want to focus on buying stocks listed on the NYSE.
Overall, the Market Breadth Indicator is a valuable tool for traders and investors to assess the overall market health and make informed trading decisions based on market sentiment.
Bonus feature: there is an option to display data for ADD for the three exchanges as well on the data table.
[TTI] Zanger Volume Ratio - Intraday––––HISTORY & CREDITS 🏦
The Zanger Volume Ratio - Intraday indicator is inspired by the work of Dan Zanger, a renowned trader and creator of the Zanger Volume Ratio tool. This specific adaptation of the ratio is designed for the TradingView platform and focuses on intraday trading. Dan Zanger used this same method of reading the chart to establish a world record in turning HKEX:10 ,775 into HKEX:18 ,000,000 in under 2 years.
––––WHAT IT DOES 💡
The Zanger Volume Ratio - Intraday indicator measures the estimated end-of-day volume percentage based on intraday (depending on the timeframe of your chart) comparisons for the last X days (input in the settings). It provides insights into the stock's trading volume in real-time throughout the trading day, giving traders an idea of the stock's relative volume compared to its recent trading history. For instance if you add it to a 5min chart the ratio represents the estimated end of day volume percent based on the last 3 days, the indicator will compare the cumulative volume of the current day to the X days back cumulative average up to that same point in time and tell you how it is around the thresholds.
The indicator categorizes the volume into five levels: Extreme, High, Average, Light, and Dry Up, each represented by different colors on the chart. It also displays a pace indicator, which shows whether the volume is increasing or decreasing during the trading session.
There is also a label that shows the current reading and its pace. The pace is the indication wether the volume ratio pace is increasing and picking up or it is slowing down.
Thesholds
👉EXTREME (red): >200, means "Volume is 200% of average daily volume
👉HIGH (magenta): 110
👉AVERAGE (peach): 85
👉LIGHT (orange): 60
👉DRY (gray): <60
––––HOW TO USE IT 🔧
To use the Zanger Volume Ratio - Intraday indicator effectively, follow these steps:
1️⃣ Apply the indicator to your TradingView chart with an intraday timeframe (>=1min and less than 1 day).
2️⃣Observe the real-time volume levels and their corresponding categories (Extreme, High, Average, Light, and Dry Up) to understand the current volume dynamics.
3️⃣Keep an eye on the pace indicator (arrows) to see if the volume is increasing or decreasing during the session.
4️⃣Use the information provided by the indicator to confirm trade setups, identify potential breakouts, or detect possible reversals. For example, a stock breaking out of a key area with high or extreme volume and an increasing pace arrow may indicate a strong upward move. Conversely, a stock pulling back on light or dry up volume could signal a continuation of the trend once the volume picks up again.
Remember to combine the Zanger Volume Ratio - Intraday indicator with other technical analysis tools and your own trading strategy to make informed decisions.

GKD-C Momentum Ratio Oscillator [Loxx]Giga Kaleidoscope GKD-C Momentum Ratio Oscillator is a Confirmation module included in Loxx's "Giga Kaleidoscope Modularized Trading System".
█ Giga Kaleidoscope Modularized Trading System
What is Loxx's "Giga Kaleidoscope Modularized Trading System"?
The Giga Kaleidoscope Modularized Trading System is a trading system built on the philosophy of the NNFX (No Nonsense Forex) algorithmic trading.
What is the NNFX algorithmic trading strategy?
The NNFX (No-Nonsense Forex) trading system is a comprehensive approach to Forex trading that is designed to simplify the process and remove the confusion and complexity that often surrounds trading. The system was developed by a Forex trader who goes by the pseudonym "VP" and has gained a significant following in the Forex community.
The NNFX trading system is based on a set of rules and guidelines that help traders make objective and informed decisions. These rules cover all aspects of trading, including market analysis, trade entry, stop loss placement, and trade management.
Here are the main components of the NNFX trading system:
1. Trading Philosophy: The NNFX trading system is based on the idea that successful trading requires a comprehensive understanding of the market, objective analysis, and strict risk management. The system aims to remove subjective elements from trading and focuses on objective rules and guidelines.
2. Technical Analysis: The NNFX trading system relies heavily on technical analysis and uses a range of indicators to identify high-probability trading opportunities. The system uses a combination of trend-following and mean-reverting strategies to identify trades.
3. Market Structure: The NNFX trading system emphasizes the importance of understanding the market structure, including price action, support and resistance levels, and market cycles. The system uses a range of tools to identify the market structure, including trend lines, channels, and moving averages.
4. Trade Entry: The NNFX trading system has strict rules for trade entry. The system uses a combination of technical indicators to identify high-probability trades, and traders must meet specific criteria to enter a trade.
5. Stop Loss Placement: The NNFX trading system places a significant emphasis on risk management and requires traders to place a stop loss order on every trade. The system uses a combination of technical analysis and market structure to determine the appropriate stop loss level.
6. Trade Management: The NNFX trading system has specific rules for managing open trades. The system aims to minimize risk and maximize profit by using a combination of trailing stops, take profit levels, and position sizing.
Overall, the NNFX trading system is designed to be a straightforward and easy-to-follow approach to Forex trading that can be applied by traders of all skill levels.
Core components of an NNFX algorithmic trading strategy
The NNFX algorithm is built on the principles of trend, momentum, and volatility. There are six core components in the NNFX trading algorithm:
1. Volatility - price volatility; e.g., Average True Range, True Range Double, Close-to-Close, etc.
2. Baseline - a moving average to identify price trend
3. Confirmation 1 - a technical indicator used to identify trends
4. Confirmation 2 - a technical indicator used to identify trends
5. Continuation - a technical indicator used to identify trends
6. Volatility/Volume - a technical indicator used to identify volatility/volume breakouts/breakdown
7. Exit - a technical indicator used to determine when a trend is exhausted
What is Volatility in the NNFX trading system?
In the NNFX (No Nonsense Forex) trading system, ATR (Average True Range) is typically used to measure the volatility of an asset. It is used as a part of the system to help determine the appropriate stop loss and take profit levels for a trade. ATR is calculated by taking the average of the true range values over a specified period.
True range is calculated as the maximum of the following values:
-Current high minus the current low
-Absolute value of the current high minus the previous close
-Absolute value of the current low minus the previous close
ATR is a dynamic indicator that changes with changes in volatility. As volatility increases, the value of ATR increases, and as volatility decreases, the value of ATR decreases. By using ATR in NNFX system, traders can adjust their stop loss and take profit levels according to the volatility of the asset being traded. This helps to ensure that the trade is given enough room to move, while also minimizing potential losses.
Other types of volatility include True Range Double (TRD), Close-to-Close, and Garman-Klass
What is a Baseline indicator?
The baseline is essentially a moving average, and is used to determine the overall direction of the market.
The baseline in the NNFX system is used to filter out trades that are not in line with the long-term trend of the market. The baseline is plotted on the chart along with other indicators, such as the Moving Average (MA), the Relative Strength Index (RSI), and the Average True Range (ATR).
Trades are only taken when the price is in the same direction as the baseline. For example, if the baseline is sloping upwards, only long trades are taken, and if the baseline is sloping downwards, only short trades are taken. This approach helps to ensure that trades are in line with the overall trend of the market, and reduces the risk of entering trades that are likely to fail.
By using a baseline in the NNFX system, traders can have a clear reference point for determining the overall trend of the market, and can make more informed trading decisions. The baseline helps to filter out noise and false signals, and ensures that trades are taken in the direction of the long-term trend.
What is a Confirmation indicator?
Confirmation indicators are technical indicators that are used to confirm the signals generated by primary indicators. Primary indicators are the core indicators used in the NNFX system, such as the Average True Range (ATR), the Moving Average (MA), and the Relative Strength Index (RSI).
The purpose of the confirmation indicators is to reduce false signals and improve the accuracy of the trading system. They are designed to confirm the signals generated by the primary indicators by providing additional information about the strength and direction of the trend.
Some examples of confirmation indicators that may be used in the NNFX system include the Bollinger Bands, the MACD (Moving Average Convergence Divergence), and the MACD Oscillator. These indicators can provide information about the volatility, momentum, and trend strength of the market, and can be used to confirm the signals generated by the primary indicators.
In the NNFX system, confirmation indicators are used in combination with primary indicators and other filters to create a trading system that is robust and reliable. By using multiple indicators to confirm trading signals, the system aims to reduce the risk of false signals and improve the overall profitability of the trades.
What is a Continuation indicator?
In the NNFX (No Nonsense Forex) trading system, a continuation indicator is a technical indicator that is used to confirm a current trend and predict that the trend is likely to continue in the same direction. A continuation indicator is typically used in conjunction with other indicators in the system, such as a baseline indicator, to provide a comprehensive trading strategy.
What is a Volatility/Volume indicator?
Volume indicators, such as the On Balance Volume (OBV), the Chaikin Money Flow (CMF), or the Volume Price Trend (VPT), are used to measure the amount of buying and selling activity in a market. They are based on the trading volume of the market, and can provide information about the strength of the trend. In the NNFX system, volume indicators are used to confirm trading signals generated by the Moving Average and the Relative Strength Index. Volatility indicators include Average Direction Index, Waddah Attar, and Volatility Ratio. In the NNFX trading system, volatility is a proxy for volume and vice versa.
By using volume indicators as confirmation tools, the NNFX trading system aims to reduce the risk of false signals and improve the overall profitability of trades. These indicators can provide additional information about the market that is not captured by the primary indicators, and can help traders to make more informed trading decisions. In addition, volume indicators can be used to identify potential changes in market trends and to confirm the strength of price movements.
What is an Exit indicator?
The exit indicator is used in conjunction with other indicators in the system, such as the Moving Average (MA), the Relative Strength Index (RSI), and the Average True Range (ATR), to provide a comprehensive trading strategy.
The exit indicator in the NNFX system can be any technical indicator that is deemed effective at identifying optimal exit points. Examples of exit indicators that are commonly used include the Parabolic SAR, the Average Directional Index (ADX), and the Chandelier Exit.
The purpose of the exit indicator is to identify when a trend is likely to reverse or when the market conditions have changed, signaling the need to exit a trade. By using an exit indicator, traders can manage their risk and prevent significant losses.
In the NNFX system, the exit indicator is used in conjunction with a stop loss and a take profit order to maximize profits and minimize losses. The stop loss order is used to limit the amount of loss that can be incurred if the trade goes against the trader, while the take profit order is used to lock in profits when the trade is moving in the trader's favor.
Overall, the use of an exit indicator in the NNFX trading system is an important component of a comprehensive trading strategy. It allows traders to manage their risk effectively and improve the profitability of their trades by exiting at the right time.
How does Loxx's GKD (Giga Kaleidoscope Modularized Trading System) implement the NNFX algorithm outlined above?
Loxx's GKD v1.0 system has five types of modules (indicators/strategies). These modules are:
1. GKD-BT - Backtesting module (Volatility, Number 1 in the NNFX algorithm)
2. GKD-B - Baseline module (Baseline and Volatility/Volume, Numbers 1 and 2 in the NNFX algorithm)
3. GKD-C - Confirmation 1/2 and Continuation module (Confirmation 1/2 and Continuation, Numbers 3, 4, and 5 in the NNFX algorithm)
4. GKD-V - Volatility/Volume module (Confirmation 1/2, Number 6 in the NNFX algorithm)
5. GKD-E - Exit module (Exit, Number 7 in the NNFX algorithm)
(additional module types will added in future releases)
Each module interacts with every module by passing data between modules. Data is passed between each module as described below:
GKD-B => GKD-V => GKD-C(1) => GKD-C(2) => GKD-C(Continuation) => GKD-E => GKD-BT
That is, the Baseline indicator passes its data to Volatility/Volume. The Volatility/Volume indicator passes its values to the Confirmation 1 indicator. The Confirmation 1 indicator passes its values to the Confirmation 2 indicator. The Confirmation 2 indicator passes its values to the Continuation indicator. The Continuation indicator passes its values to the Exit indicator, and finally, the Exit indicator passes its values to the Backtest strategy.
This chaining of indicators requires that each module conform to Loxx's GKD protocol, therefore allowing for the testing of every possible combination of technical indicators that make up the six components of the NNFX algorithm.
What does the application of the GKD trading system look like?
Example trading system:
Backtest: Strategy with 1-3 take profits, trailing stop loss, multiple types of PnL volatility, and 2 backtesting styles
Baseline: Hull Moving Average
Volatility/Volume: Hurst Exponent
Confirmation 1: Momentum Ratio Oscillator as shown on the chart above
Confirmation 2: Williams Percent Range
Continuation: Fisher Transform
Exit: Rex Oscillator
Each GKD indicator is denoted with a module identifier of either: GKD-BT, GKD-B, GKD-C, GKD-V, or GKD-E. This allows traders to understand to which module each indicator belongs and where each indicator fits into the GKD protocol chain.
Giga Kaleidoscope Modularized Trading System Signals (based on the NNFX algorithm)
Standard Entry
1. GKD-C Confirmation 1 Signal
2. GKD-B Baseline agrees
3. Price is within a range of 0.2x Volatility and 1.0x Volatility of the Goldie Locks Mean
4. GKD-C Confirmation 2 agrees
5. GKD-V Volatility/Volume agrees
Baseline Entry
1. GKD-B Baseline signal
2. GKD-C Confirmation 1 agrees
3. Price is within a range of 0.2x Volatility and 1.0x Volatility of the Goldie Locks Mean
4. GKD-C Confirmation 2 agrees
5. GKD-V Volatility/Volume agrees
6. GKD-C Confirmation 1 signal was less than 7 candles prior
Continuation Entry
1. Standard Entry, Baseline Entry, or Pullback; entry triggered previously
2. GKD-B Baseline hasn't crossed since entry signal trigger
3. GKD-C Confirmation Continuation Indicator signals
4. GKD-C Confirmation 1 agrees
5. GKD-B Baseline agrees
6. GKD-C Confirmation 2 agrees
1-Candle Rule Standard Entry
1. GKD-C Confirmation 1 signal
2. GKD-B Baseline agrees
3. Price is within a range of 0.2x Volatility and 1.0x Volatility of the Goldie Locks Mean
Next Candle:
1. Price retraced (Long: close < close or Short: close > close )
2. GKD-B Baseline agrees
3. GKD-C Confirmation 1 agrees
4. GKD-C Confirmation 2 agrees
5. GKD-V Volatility/Volume agrees
1-Candle Rule Baseline Entry
1. GKD-B Baseline signal
2. GKD-C Confirmation 1 agrees
3. Price is within a range of 0.2x Volatility and 1.0x Volatility of the Goldie Locks Mean
4. GKD-C Confirmation 1 signal was less than 7 candles prior
Next Candle:
1. Price retraced (Long: close < close or Short: close > close )
2. GKD-B Baseline agrees
3. GKD-C Confirmation 1 agrees
4. GKD-C Confirmation 2 agrees
5. GKD-V Volatility/Volume Agrees
PullBack Entry
1. GKD-B Baseline signal
2. GKD-C Confirmation 1 agrees
3. Price is beyond 1.0x Volatility of Baseline
Next Candle:
1. Price is within a range of 0.2x Volatility and 1.0x Volatility of the Goldie Locks Mean
3. GKD-C Confirmation 1 agrees
4. GKD-C Confirmation 2 agrees
5. GKD-V Volatility/Volume Agrees
█ GKD-C Momentum Ratio Oscillator
What is an EMA?
EMA stands for Exponential Moving Average , which is a type of moving average that is commonly used in technical analysis to smooth out price data and identify trends.
In a simple moving average ( SMA ), each data point is given equal weight when calculating the average. For example, if you are calculating the 10-day SMA , you would add up the prices for the past 10 days and divide by 10 to get the average. In contrast, in an EMA , more weight is given to recent prices, while older prices are given less weight.
The formula for calculating an EMA involves using a smoothing factor that is multiplied by the difference between the current price and the previous EMA value, and then adding this to the previous EMA value. The smoothing factor is typically calculated based on the length of the EMA being used. For example, a 10-day EMA might use a smoothing factor of 2/(10+1) or 0.1818.
The result of using an EMA is that the line produced is more responsive to recent price changes than a simple moving average . This makes it useful for identifying short-term trends and potential trend reversals. However, it can also be more volatile and prone to whipsaws, so it is often used in combination with other indicators to confirm signals.
Overall, the EMA is a widely used and versatile tool in technical analysis , and its effectiveness depends on the specific context in which it is applied.
What is Momentum?
In technical analysis , momentum refers to the rate of change of an asset's price over a certain period of time. It is often used to identify trends and potential trend reversals in financial markets.
Momentum is calculated by subtracting the closing price of an asset X days ago from its current closing price, where X is the number of days being used for the calculation. The result is the momentum value for that particular day. A positive momentum value suggests that prices are increasing, while a negative value indicates that prices are decreasing.
Traders use momentum in a variety of ways. One common approach is to look for divergences between the momentum indicator and the price of the asset being traded. For example, if an asset's price is trending upwards but its momentum is trending downwards, this could be a sign of a potential trend reversal.
Another popular strategy is to use momentum to identify overbought and oversold conditions in the market. When an asset's price has been rising rapidly and its momentum is high, it may be considered overbought and due for a correction. Conversely, when an asset's price has been falling rapidly and its momentum is low, it may be considered oversold and due for a bounce back up.
Momentum is also often used in conjunction with other technical indicators, such as moving averages or Bollinger Bands , to confirm signals and improve the accuracy of trading decisions.
Overall, momentum is a useful tool for traders and investors to analyze price movements and identify potential trading opportunities. However, like all technical indicators, it should be used in conjunction with other forms of analysis and with consideration of the broader market context.
What is Momentum Ratio Oscillator?
The theory behind this indicator involves utilizing a sequence of exponential moving average ( EMA ) calculations to achieve a smoother value of momentum ratio, which compares the current value to the previous one. Although this results in an outcome similar to that of some pre-existing indicators (such as volume zone or price zone oscillators), the use of EMA for smoothing is what sets it apart. EMA produces a smooth step-like output when values undergo sudden changes, whereas the mathematics used for those other indicators are completely distinct. This is a concept by the beloved Mladen of FX forums.
To utilize this version of the indicator, you have the option of using either levels, middle, or signal crosses for signals. The indicator is range bound from 0 to 1.
Requirements
Inputs
Confirmation 1 and Solo Confirmation: GKD-V Volatility / Volume indicator
Confirmation 2: GKD-C Confirmation indicator
Outputs
Confirmation 2 and Solo Confirmation Complex: GKD-E Exit indicator
Confirmation 1: GKD-C Confirmation indicator
Continuation: GKD-E Exit indicator
Solo Confirmation Simple: GKD-BT Backtest strategy
Additional features will be added in future releases.
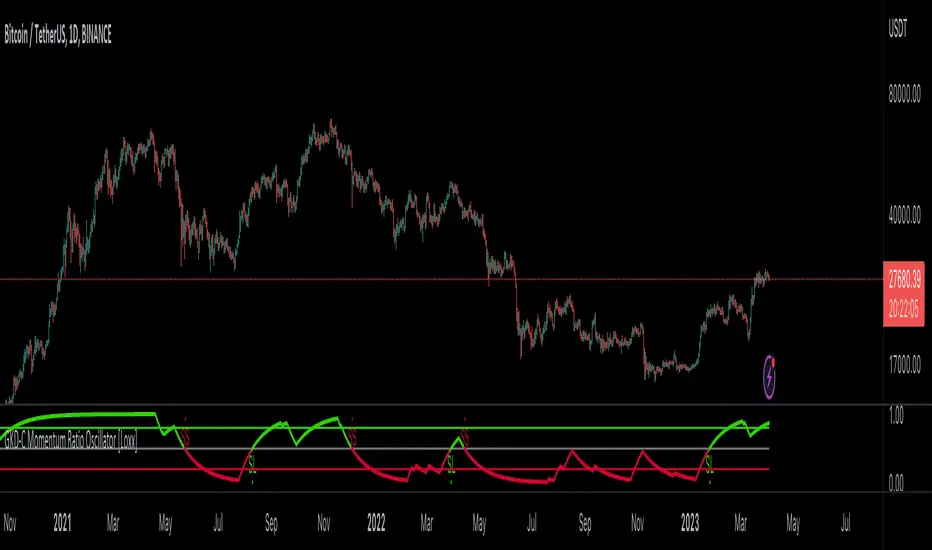
Momentum Ratio Oscillator [Loxx]What is Momentum Ratio Oscillator?
The theory behind this indicator involves utilizing a sequence of exponential moving average (EMA) calculations to achieve a smoother value of momentum ratio, which compares the current value to the previous one. Although this results in an outcome similar to that of some pre-existing indicators (such as volume zone or price zone oscillators), the use of EMA for smoothing is what sets it apart. EMA produces a smooth step-like output when values undergo sudden changes, whereas the mathematics used for those other indicators are completely distinct. This is a concept by the beloved Mladen of FX forums.
To utilize this version of the indicator, you have the option of using either levels, middle, or signal crosses for signals. The indicator is range bound from 0 to 1.
What is an EMA?
EMA stands for Exponential Moving Average, which is a type of moving average that is commonly used in technical analysis to smooth out price data and identify trends.
In a simple moving average (SMA), each data point is given equal weight when calculating the average. For example, if you are calculating the 10-day SMA, you would add up the prices for the past 10 days and divide by 10 to get the average. In contrast, in an EMA, more weight is given to recent prices, while older prices are given less weight.
The formula for calculating an EMA involves using a smoothing factor that is multiplied by the difference between the current price and the previous EMA value, and then adding this to the previous EMA value. The smoothing factor is typically calculated based on the length of the EMA being used. For example, a 10-day EMA might use a smoothing factor of 2/(10+1) or 0.1818.
The result of using an EMA is that the line produced is more responsive to recent price changes than a simple moving average. This makes it useful for identifying short-term trends and potential trend reversals. However, it can also be more volatile and prone to whipsaws, so it is often used in combination with other indicators to confirm signals.
Overall, the EMA is a widely used and versatile tool in technical analysis, and its effectiveness depends on the specific context in which it is applied.
What is Momentum?
In technical analysis, momentum refers to the rate of change of an asset's price over a certain period of time. It is often used to identify trends and potential trend reversals in financial markets.
Momentum is calculated by subtracting the closing price of an asset X days ago from its current closing price, where X is the number of days being used for the calculation. The result is the momentum value for that particular day. A positive momentum value suggests that prices are increasing, while a negative value indicates that prices are decreasing.
Traders use momentum in a variety of ways. One common approach is to look for divergences between the momentum indicator and the price of the asset being traded. For example, if an asset's price is trending upwards but its momentum is trending downwards, this could be a sign of a potential trend reversal.
Another popular strategy is to use momentum to identify overbought and oversold conditions in the market. When an asset's price has been rising rapidly and its momentum is high, it may be considered overbought and due for a correction. Conversely, when an asset's price has been falling rapidly and its momentum is low, it may be considered oversold and due for a bounce back up.
Momentum is also often used in conjunction with other technical indicators, such as moving averages or Bollinger Bands, to confirm signals and improve the accuracy of trading decisions.
Overall, momentum is a useful tool for traders and investors to analyze price movements and identify potential trading opportunities. However, like all technical indicators, it should be used in conjunction with other forms of analysis and with consideration of the broader market context.
Extras
Alerts
Signals
Loxx's Expanded Source Types, see here for details

IOFin F-Score by zdmre🗣The IOFin F-Score is a discrete score between zero and ten that reflects ten criteria used to determine the strength of a firm's financial position.
🗣It is used to determine the best value stocks, with ten being the best and zero being the worst.
The IOFin F-Score broken down into the following categories:
Profitability
Equity, cash flow, liquidity, and source of funds
Operating efficiency
Criteria Include:
Price to book (P/B) lower than 3 (1 point)
Debt to Equity (D/E) lower than 0.5 (1 point)
Price to FreeCashFlow (P/FCF) equal to or lower than 20 (1 point)
Peg Ratio lower than 1 (1 point)
Sustainable Growth Rate higher than 0.3 (1 point)
Return on Assets (ROIC) higher than 0.07 (1 point)
Return on Equity (ROE) higher than 0.3 (1 point)
EnterpriseValue/Ebitda lower than 10 (1 point)
Quick Ratio equal to or higher than 1 (1 point)
Operating Margin higher than 0.15 (1 point)

Futures/Spot Ratiowhat is Futures /Spot Ratio?
Although futures and spot markets are separate markets, they are correlated. arbitrage bots allow this gap to be closed. But arbitrage bots also have their limits. so there are always slight differences between futures and spot markets. By analyzing these differences, the movements of the players in the market can be interpreted and important information about the price can be obtained. Futures /Spot Ratio is a tool that facilitates this analysis.
what it does?
it compresses the ratio between two selected spot and futures trading pairs between 0 and 100. its purpose is to facilitate use and interpretation. it also passes a regression (Colorful Regression) through the middle of the data for the same purpose.
about Colorful Regression:
how it does it?
it uses this formula:
how to use it?
use it to understand whether the market is priced with spot trades or leveraged positions. A value of 50 is the breakeven point where the ratio of the spot and leveraged markets are equal. Values above 50 indicate excess of long positions in the market, values below 50 indicate excess of short positions. I have explained how to interpret these ratios with examples below.

Body / Range %Body / Range is a volatility indicator that shows how many percentages the body candle occupies the range.
The ratio tells us about the health and confidence of the current candlestick.
Since overall candle Range is always bigger than the body range, Body/Range indicator will always fluctuate inside a range of 0 and 100%.
I didn't use True Range because it considers gaps and the ratio won't be considering individual candles. Therefore, I used high - low and identified it as Range.
In this function, the wicks play obviously role in determining the ratio too without its variable separately in the formula. I wouldn't use wicks here because Range = body + total wicks anyway. It already covers the variable. If I made the ratio with Body / Total Wicks, we wouldn't have stable 0 - 100% range of the indicator by the way. So it's fully justified dividing Body by Range to get some summarized Candle Metrics.
Logically we assume that if wicks are relatively bigger than body then the ratio will be relatively smaller and vice versa.
Change TF of the indicator is possible. For example, 3 months per bar would look like this:
Accumulated Put/Call Ratio V2This is an updated version of the Accumulated P/C Ratio. Some changes include:
- Pinescript privacy changed from protected to open.
- Utilizes the "request.security_lower_tf" function for weekly and monthly charts.
- Now acquires and sums raw put volume (ticker: PVOL) and call volume (ticker: CVOL) separately, then divides the aggregate put to aggregate call to get the P/C ratio, as opposed to the original version which directly sums the put call ratio (ticker: PCC). Mathematically this calculation makes more sense, but the major drawback of this change seems to be that PVOL and CVOL don't have as much historical data as PCC.
The way to interpret the indicator is the same as the original version - higher values are bullish while lower values are bearish. A solid (0 transparency) bar means that the value is beyond 3 standard deviations within a particular period.
