Sharpe Ratio [Alpha Extract]A sophisticated risk-adjusted return measurement system that calculates annualized Sharpe Ratio with dynamic color-coded visualization distinguishing return quality across positive and negative performance regimes. Utilizing rolling period calculations with smoothed moving average comparison, this indicator delivers institutional-grade performance assessment with overbought/oversold threshold detection for extreme risk-adjusted return conditions. The system's four-tier color classification combined with histogram fills and background highlighting provides comprehensive visual feedback on whether current returns justify their volatility risk across varying market cycles.
🔶 Advanced Sharpe Ratio Calculation Engine
Implements classic Sharpe Ratio methodology measuring mean daily return divided by return standard deviation with annualization factor for consistent interpretation. The system calculates daily percentage returns, computes rolling mean and standard deviation over configurable periods, applies square root of 365 scaling for annualized comparison, and generates unbounded ratio values where higher positive readings indicate superior risk-adjusted performance.
// Core Sharpe Ratio Framework
Daily_Return = close / close - 1
Mean_Return = ta.sma(Daily_Return, Period)
StdDev_Return = ta.stdev(Daily_Return, Period)
Sharpe_Ratio = (Mean_Return / StdDev_Return) * sqrt(365)
🔶 Dynamic Four-Tier Color Classification
Features sophisticated color logic distinguishing between strong positive returns (green), weakening positive returns (yellow), weakening negative returns (orange), and strong negative returns (red) based on relationship to smoothed average. The system compares current Sharpe against SMA-smoothed baseline, applying green when positive and accelerating, yellow when positive but decelerating, orange when negative but improving, and red when negative and deteriorating for nuanced regime assessment.
🔶 Smoothed Baseline Comparison Framework
Implements SMA smoothing of Sharpe Ratio with configurable period to establish momentum reference line for trend determination within risk-adjusted returns. The system calculates simple moving average of raw Sharpe values, uses this smoothed line as directional benchmark, and determines whether current risk-adjusted performance is strengthening or weakening relative to recent average for color classification logic.
🔶 Extreme Threshold Detection System
Provides overbought and oversold level identification with configurable upper and lower bounds marking exceptional risk-adjusted return extremes. The system defaults to +4.3 for overbought threshold (extremely favorable risk-return profile) and -2.3 for oversold threshold (severely unfavorable risk-return profile), applying dashed horizontal reference lines and background highlighting when Sharpe breaches these statistical extremes requiring attention.
🔶 Histogram Fill Visualization Architecture
Creates gradient-filled histogram between Sharpe Ratio line and zero baseline using dynamic color matching with 30% transparency for intuitive positive/negative return distinction. The system fills area above zero with bullish colors (green/yellow) and below zero with bearish colors (orange/red), providing immediate visual confirmation of whether returns are compensating for volatility risk or destroying risk-adjusted value.
🔶 Background Zone Highlighting Framework
Implements subtle background coloring when Sharpe enters extreme overbought or oversold zones, alerting traders to statistically significant risk-adjusted return conditions. The system applies semi-transparent red background when ratio exceeds +4.3 (exceptionally strong risk-adjusted returns potentially unsustainable) and green background when below -2.3 (severely poor risk-adjusted returns potentially reversionary), creating visual alerts without obscuring price action.
🔶 Annualization Methodology Integration
Utilizes standard square root of time scaling (sqrt(365)) to convert rolling period Sharpe calculations into annualized format for cross-temporal comparison. The system applies this mathematical transformation ensuring Sharpe values represent expected annual risk-adjusted returns regardless of calculation period length, enabling consistent interpretation whether using 100-day or 200-day rolling windows.
🔶 Zero-Line Reference System
Provides critical zero-line plot serving as boundary between positive risk-adjusted returns (capital allocation justified by return/risk profile) and negative risk-adjusted returns (strategy destroying value on risk-adjusted basis). The system emphasizes this threshold as decision point where values above zero suggest continuation while values below zero indicate reconsideration of exposure.
🔶 Momentum-Based Color
Transitions Implements intelligent color switching logic that considers both absolute Sharpe value and its momentum relative to smoothed average, creating four distinct regimes for granular performance assessment. The system enables identification of bullish acceleration (green), bullish deceleration (yellow), bearish improvement (orange), and bearish acceleration (red) for nuanced position management beyond simple positive/negative classification.
🔶 Configurable Period Optimization
Features adjustable calculation period and smoothing length enabling optimization across different trading timeframes and volatility regimes. The system defaults to 150-period calculation (approximately 6-7 months of daily data) with 30-period smoothing, but allows customization from short-term tactical assessment to long-term strategic evaluation based on investment horizon and strategy requirements.
🔶 Performance Optimization Framework
Employs efficient rolling calculations with streamlined daily return processing and optimized standard deviation computation for smooth real-time updates. The system includes minimal computational overhead through single-pass mean and variance calculations, enabling consistent performance across extended historical periods while maintaining accuracy of risk-adjusted return measurements.
This indicator delivers sophisticated risk-adjusted return analysis through classic Sharpe Ratio methodology with enhanced visual classification distinguishing return quality and momentum. Unlike simple return-focused indicators, Sharpe Ratio penalizes volatility ensuring traders evaluate whether returns justify the risk undertaken. The system's four-tier color coding, smoothed baseline comparison, and extreme threshold detection make it essential for portfolio managers and systematic traders seeking objective performance assessment beyond raw price gains. High positive Sharpe values indicate efficient return generation relative to volatility risk, while negative values signal value destruction on risk-adjusted basis requiring strategy reassessment. The indicator excels at identifying periods when risk-taking is rewarded (green zones) versus periods when volatility exceeds returns (red zones) across cryptocurrency, forex, and equity markets for optimal capital allocation decisions.
Quantitativeanalysis

S&P 500 & Normalized CAPE Z-Score AnalyzerThis macro-focused indicator visualizes the historical valuation of the U.S. equity market using the CAPE ratio (Shiller P/E), normalized over its long-term average and standard deviations. It helps traders and investors identify overvaluation and undervaluation zones over time, combining both statistical signals and historical context.
💡 Why It’s Useful
This indicator is ideal for macro traders and long-term investors looking to contextualize equity valuations across decades. It helps identify statistical extremes in valuation by referencing the standard deviation of the CAPE ratio relative to its long-term mean. The overlay of S&P 500 price with valuation zones provides a visual confirmation tool for macro decisions or timing insights.
It includes:
✅ Three display modes:
-S&P 500 (color-coded by CAPE valuation zone)
-Normalized CAPE (vs. long-term mean)
-CAPE Z-Score (standardized measure)
🎯 How to Interpret
Dynamic coloring of the S&P 500 price based on CAPE valuation:
🔴 Z > +2σ → Highly Overvalued
🟠 Z > +1σ → Overvalued
⚪ -1σ < Z < +1σ → Neutral
🟢 Z < -1σ → Undervalued
✅ Z < -2σ → Strong Buy Zone
-Live valuation label showing the current CAPE, Z-score, and zone.
-Macro event shading: major historical events (e.g. Great Depression, Oil Crisis, Dot-com Bubble, COVID Crash) are shaded on the chart for context.
✅ Built-in alerts:
CAPE > +2σ → Potential risk zone
CAPE < -2σ → Potential opportunity zone
📊 Use Cases
This indicator is ideal for:
🧠 Macro traders seeking long-term valuation extremes.
📈 Portfolio managers monitoring systemic valuation risk.
🏛️ Long-term investors timing strategic allocation shifts.
🧪 How It Works
CAPE ratio (Shiller PE) is retrieved from Quandl (MULTPL/SHILLER_PE_RATIO_MONTH).
The script calculates the long-term average and standard deviation of CAPE.
The Z-score is computed as:
(CAPE - Mean) / Standard Deviation
Users can switch between:
S&P 500 chart, color-coded by CAPE valuation zones.
Normalized CAPE, centered around zero (historic mean).
CAPE Z-score, showing statistical positioning directly.
Visual bands represent +1σ, +2σ, -1σ, -2σ thresholds.
You can switch between modes using the “Display” dropdown in the settings panel.
📊 Data Sources
CAPE: MULTPL/SHILLER_PE_RATIO_MONTH via Quandl
S&P 500: Monthly close prices of SPX (TradingView data)
All data updated on monthly resolution
This is not a repackaged built-in or autogenerated script. It’s a custom-built and interactive indicator designed for educational and analytical use in macroeconomic valuation studies.

FuTech : Earnings (All 269 Fundamental Metrics of Tradingview)FuTech : Earnings Indicator
The FuTech : Earnings Indicator is a revolutionary tool, offering the most comprehensive integration of all 269 fundamental financial metrics available from the TradingView platform.
This groundbreaking indicator is designed to empower financial researchers, traders, investors, and analysts with an unmatched depth of data, enabling superior analysis and decision-making.
Overview
"FuTech : Earnings Indicator" is the first-ever indicator to provide a holistic comparison of fundamental financial metrics for any stock, covering quarterly, yearly, and trailing twelve months (TTM) periods.
This tool brings together key financial data from income statements, balance sheets, cash flows, and other critical metrics found in company annual reports.
It also incorporates additional unique features like per-employee data, R&D expenses, and capital expenditures (CapEx), which are typically hidden within dense financial statements of Annual Reports.
---
Key Features and Capabilities
1. Comprehensive Financial Metrics
- "FuTech : Earnings Indicator" offers access to all 269 fundamental metrics available on TradingView platform. This includes widely used data such as revenue, profit margins, and EPS, alongside more niche metrics like R&D expenditure, employee efficiency, and financial scores developed by renowned analysts.
- Users can explore income statement data (e.g., net income, gross profit), balance sheet items (e.g., total assets, liabilities), cash flow metrics, and other financial statistics such as Altman Score, per employee expenses etc. in unparalleled detail.
2. Comparison Across Time Periods
- "FuTech : Earnings Indicator" allows users to analyze data for:
- Quarterly periods (e.g., Q1, Q2, Q3, Q4).
- Yearly comparisons for a broad historical view.
- TTM analysis to observe the most recent trends and developments.
- Users can select a minimum of 4 periods up to an unlimited range for detailed comparisons in both quarter.
3. Dynamic Data Display
- Users can select up to 5 key metrics alongside the stock price column to focus their analysis on the most relevant data points.
- Highlighting with green and red symbols offers an intuitive and visual representation:
- Green : Positive trends or improvements.
- Red : Negative trends or deteriorations.
4. Automated Averages
- "FuTech : Earnings Indicator" automatically calculates averages of selected metrics across the chosen periods. This feature helps users quickly identify performance trends and smooth out anomalies, enabling faster and more reliable research.
5. Designed for Research Excellence
- FuTech serves a wide audience, including:
- Corporate finance professionals who need a deep dive into financial metrics.
- Individual investors seeking robust tools for investment analysis.
- Broking companies and equity research analysts performing stock analysis.
- Traders looking to incorporate fundamental metrics into their strategies.
- Technical analysts seeking a better understanding of price behavior in relation to fundamentals.
- Fundamental research aspirants who want an edge in their learning process.
6. Unmatched Detail for Deeper Insights
- By pulling all 269 Financial metrics from the TradingView, "FuTech : Earnings Indicator" enables:
- Cross-comparison of a stock’s performance with its historical benchmarks.
- Evaluation of rare data like R&D expenses, CapEx trends, and employee efficiency ratios for enhanced investment insights.
- This ensures users can study stocks in greater depth than ever before.
7. Enhanced Usability
- Simple to use and visually appealing, "FuTech : Earnings Indicator" is designed with researchers in mind.
- Its intuitive interface ensures even novice users can navigate the wealth of data without feeling overwhelmed.
Applications of FuTech : Earnings Indicator
FuTech : Earnings Indicator is incredibly versatile and has applications in diverse fields of financial research and trading:
1. Corporate Finance
- Professionals in corporate finance can leverage "FuTech : Earnings Indicator" to benchmark company performance, study efficiency ratios, and evaluate financial health across various metrics.
2. Investors and Traders
- Long-term investors can use the tool to study the fundamental strengths of a stock before making buy-and-hold decisions.
- Traders can incorporate "FuTech : Earnings Indicator" into their analysis to align comprehensive fundamental trends with their targeted technical signals.
3. Equity Research Analysts
- Analysts can streamline their workflows by quickly identifying trends, outliers, and averages across large datasets.
4. Education and Research
- "FuTech : Earnings Indicator" is ideal for students and aspiring financial analysts who want a practical tool for understanding real-world data.
How FuTech : Earnings Indicator Stands Out
1. First-Ever Integration of All Financial Metrics
- It's an exclusive tool which offers the ability to explore all 269 financial metrics available on TradingView for a single stock research in-depth for quarters, years or TTM periods.
2. Period Customization
- Users have complete flexibility to select and analyze data across any range of time periods, allowing for customized insights tailored to specific research goals.
3. Data Visualization
- The intuitive use of color-coded symbols (green for positive trends, red for negative) makes complex data easy to interpret at a glance.
4. Actionable Insights
- The automated average calculations provide actionable insights for making informed decisions without manual computations.
5. Unique Metrics
- Metrics such as research and development costs, CapEx, and per-employee efficiency data offer unique angles that aren’t typically available in traditional analysis tools.
Why to Use FuTech : Earnings Indicator ?
1. Boost Your Research Power
- With FuTech, you can unlock a world of data that gives you the edge in analyzing stocks. Whether you’re a seasoned analyst or a beginner, this tool offers something for everyone.
2. Save Time and Effort
- The automated features and intuitive interface eliminate the need for time-consuming manual calculations and formatting.
3. Make Better Decisions
- "FuTech : Earnings Indicator's" detailed comparison capabilities and insightful visual aids allow for more accurate assessments of a stock’s performance and potential.
4. Broad Appeal
- From individual investors to financial institutions, FuTech is a valuable tool for anyone in the world of finance.
---
Conclusion
- The FuTech : Earnings Indicator is a must-have for anyone serious about financial analysis.
- It combines the depth of all 269 fundamental metrics with intuitive tools for comparison, visualization, and calculation.
- Designed for ease of use and powerful insights, FuTech : Earnings Indicator is set to transform the way financial data is analyzed and understood.
Thank you !
Jai Swaminarayan Dasna Das !
He Hari ! Bas Ek Tu Raji Tha !

Advanced Volume-Driven Breakout SignalsThe "Advanced Volume-Driven Breakout Signals" indicator is a cutting-edge tool designed to help traders identify high-potential trading opportunities through sophisticated volume analysis techniques. This indicator integrates volume flow analysis, moving averages, and Relative Volume (RVOL) to provide a comprehensive view of market conditions, going beyond traditional Volume Spread Analysis (VSA) methods.
Key Features:
Volume Flow Analysis: Distinguishes bullish and bearish volume flows with distinct colors, making it easier to visualize market sentiment and potential breakout points.
Volume Flow Moving Averages: Calculates moving averages for volume using various methods (SMA, EMA, WMA, HMA, VWMA), accommodating different trading strategies. This includes settings for adjusting the type of moving average and its period, as well as thresholds for high, medium, and low volume levels.
Volume Spikes Detection: Identifies significant volume spikes based on user-defined multipliers and moving averages, highlighting unusual trading activity.
Volume MA Cloud Settings: Computes general moving averages of volume to track trends and detect deviations. This feature includes options to select different moving average types and adjust thresholds for detecting high volume activity.
Relative Volume (RVOL): Measures current volume relative to historical averages, triggering signals when RVOL exceeds predefined thresholds, indicating notable changes in trading activity.
Entry Conditions: Provides clear long and short entry signals based on combined volume flow conditions and RVOL, offering actionable trading opportunities.
Volume Visualization:
— Bullish Volume Flow: Light and dark green bars indicate bullish volume flow.
— Bearish Volume Flow: Light and dark red bars denote bearish volume flow.
— High Volume Bars: Highlighted in yellow, and extreme volume bars in orange for additional context. These bars are plotted for visual aid and do not directly influence trade signals, focusing instead on the quality and strength of the volume flow.
Alerts: Allows users to create alert notifications for long and short entry signals when the criteria are met, enabling traders to respond promptly to trading opportunities.
Usage:
Overlay: Apply the indicator directly to your price chart to visualise real-time signals and volume conditions.
Customisable: Adjust settings for moving averages, RVOL, and other parameters to match your trading strategy and preferences.
Comparison to VSA Scripts: The "Advanced Volume-Driven Breakout Signals" indicator extends beyond traditional VSA scripts by incorporating a wider range of analytical features. While VSA primarily focuses on volume spread patterns and price action, this indicator offers enhanced functionality with advanced RVOL metrics, customizable moving averages, and detailed volume spike detection, making it a more versatile tool for identifying breakout opportunities and managing trades. It is particularly effective when used alongside key levels and order blocks.
Acknowledgements: Special thanks to @oh92 and @goofoffgoose for their invaluable scripts, which served as inspiration in the development of this advanced trading indicator.
Notes: The script is continually evolving, with ongoing refinements aimed at enhancing accuracy and performance.

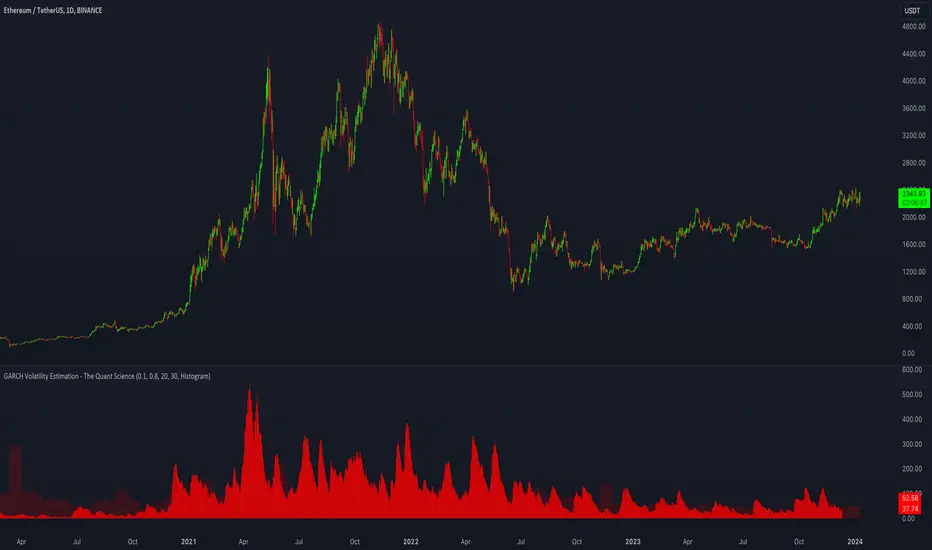
GARCH Volatility Estimation - The Quant ScienceThe GARCH (Generalized Autoregressive Conditional Heteroskedasticity) model is a statistical model used to forecast the volatility of a financial asset. This model takes into account the fluctuations in volatility over time, recognizing that volatility can vary in a heteroskedastic (i.e., non-constant variance) manner and can be influenced by past events.
The general formula of the GARCH model is:
σ²(t) = ω + α * ε²(t-1) + β * σ²(t-1)
where:
σ²(t) is the conditional variance at time t (i.e., squared volatility)
ω is the constant term (intercept) representing the baseline level of volatility
α is the coefficient representing the impact of the squared lagged error term on the conditional variance
ε²(t-1) is the squared lagged error term at the previous time period
β is the coefficient representing the impact of the lagged conditional variance on the current conditional variance
In the context of financial forecasting, the GARCH model is used to estimate the future volatility of the asset.
HOW TO USE
This quantitative indicator is capable of estimating the probable future movements of volatility. When the GARCH increases in value, it means that the volatility of the asset will likely increase as well, and vice versa. The indicator displays the relationship of the GARCH (bright red) with the trend of historical volatility (dark red).
USER INTERFACE
Alpha: select the starting value of Alpha (default value is 0.10).
Beta: select the starting value of Beta (default value is 0.80).
Lenght: select the period for calculating values within the model such as EMA (Exponential Moving Average) and Historical Volatility (default set to 20).
Forecasting: select the forecasting period, the number of bars you want to visualize data ahead (default set to 30).
Design: customize the indicator with your preferred color and choose from different types of charts, managing the design settings.