High - Low Trend Indicator - (Expo)High - Low Trend Indicator - (Expo)
DESCRIPTION
This trend indicator is derived from the highest (High) and lowest (Low). The unique formula enables clarity in trends and fast response to market changes.
Negative trend
The market could be considered to be in a negative trend when the black price line is under the blue Midline and a major red cloud is created. For some markets, the orange- trendline can be switched on to identify the long-term trend in the market. So, if the price line is under the orange trendline the market is in a negative trend.
Positive trend
The market could be considered to be in a positive trend when the black price line is above the blue Midline and close to the upper-line. For some markets, the orange-trendline can be switched on to identify the long-term trend in the market. So, if the price line is above the orange trendline the market is in a positive trend.
The indicator should be used in combination with High – Low Trend Indicator Signal (Expo) to identify market changes.
HOW TO USE
1. Use the indicator to identify trends.
2. Use the indicator to find Entry points in trends.
3. Combine it with High – Low Trend Indicator Signal (Expo).
INDICATOR IN ACTION
The indicator is best presented live, the graphs below are a good guide.
EURUSD
DAX
WALL STREET
EURJPY
GOLD
I hope you find this indicator useful , and please comment or contact me if you like the script or have any questions/suggestions for future improvements. Thanks!
I will continue to work on this indicator, so please share your experience and feedback with me so that I can continuously improve it. Thanks to everyone that have contacted me regarding my scripts. Your feedback is valuable for future developments!
ACCESS THE INDICATOR
• Contact me on TradingView or use the links below
-----------------
Disclaimer
Copyright by Zeiierman.
The information contained in my scripts/indicators/ideas does not constitute financial advice or a solicitation to buy or sell any securities of any type. I will not accept liability for any loss or damage, including without limitation any loss of profit, which may arise directly or indirectly from use of or reliance on such information.
All investments involve risk, and the past performance of a security, industry, sector, market, financial product, trading strategy, or individual’s trading does not guarantee future results or returns. Investors are fully responsible for any investment decisions they make. Such decisions should be based solely on an evaluation of their financial circumstances, investment objectives, risk tolerance, and liquidity needs.
My scripts/indicators/ideas are only for educational purposes!
Pullback
Parametric Oscillator (Zeiierman)█ Overview
The Parametric Oscillator (Zeiierman) transforms price movement into a structure-aware momentum field, a flowing wave of oscillator-candles wrapped around a smooth Quick Price Action line. Instead of reading raw closes, it constructs a multi-lane view from open, high, low, and close data to capture how price pressure expands, contracts, and shifts through time. These relationships are then projected into a bounded oscillator domain, creating a dynamic visualization of momentum and market balance.
The oscillator-candles flip green or red to signal shifts in buying or selling strength, while the Quick Line tracks underlying momentum on a 0–100 scale. Together, they reveal where pressure is forming, how quickly it’s changing, and whether that change is sustainable, helping traders spot momentum swings, stretched zones, and directional bias across any timeframe.
⚪ What Makes It Unique
The oscillator’s uniqueness lies in how it constructs and interprets price structure. It builds four independent lanes of open, high, low, and close to measure wave relationships and capture micro-drift, wick aggression, and full price behavior rather than relying solely on closing data.
Beneath the surface, the oscillator runs on a balanced motion function that translates market volatility into a clear rhythm of momentum and structure. Each change in color and gradient reflects the balance between acceleration and stability, revealing the underlying pulse of market behavior.
█ Main features
⚪ Parametric Oscillator
The Parametric Oscillator turns market movement into a visual map of buying and selling pressure. Its oscillator-candles reveal how momentum builds, compresses, and releases, showing the balance between strength and exhaustion in real time. As candles shift color and gradient, traders can instantly read acceleration, fading energy, or volatility spikes, allowing for quick interpretation of trend health and potential reversals.
The display captures both immediate bursts of momentum and the underlying trend’s persistence, giving a continuous view of how pressure evolves across market phases. It can be used to spot areas of buildup before breakouts, early signs of compression before expansion, and the transition points where control shifts from buyers to sellers.
⚪ Quick Price Action
The Quick Price Action line provides a smooth, real-time read of market momentum that often shifts before price itself reacts. Acting as a leading momentum gauge, it highlights subtle changes in strength and direction, helping traders anticipate moves rather than chase them.
When the line begins to turn, it frequently does so well ahead of price, signaling acceleration, exhaustion, or an early phase of reversal. A rise toward higher levels reflects building bullish pressure, while a downturn from elevated zones shows fading strength or emerging sell bias.
It adapts smoothly across symbols and timeframes, the Quick Price Action line gives traders a consistent, early warning system and a clear visual cue of when momentum is starting to shift and where the next meaningful move may form.
█ How to Use
⚪ Trend Following
The Momentum Candle Line helps define the underlying directional bias by measuring the strength and persistence of momentum. When momentum holds above or below the midline (50), it reflects whether buyers or sellers maintain control of the trend. Watching how the candles form relative to that level helps identify continuation or potential shifts in direction.
Maintain a bullish bias when the Momentum Candles stay above 50 and candles form higher lows.
Maintain a bearish bias when they stay below 50 and candles form lower highs.
⚪ Detect Leading Momentum
The Quick Price Line helps identify leading momentum moves that often precede price action. These can signal the start of a new move in that direction or the early stages of a reversal.
When the Quick Line peaks above 80, it indicates strong positive momentum.
When it peaks below 30, it signals strong negative momentum.
By observing how the momentum candles behave around these levels, traders can determine whether the move is likely a continuation or a reversal.
⚪ Fading Price Moves
Momentum drives price to new highs and lows, but when that momentum fades, reversals often follow. The Quick Price Line or the Parametric Oscillator candles can reveal weakening momentum before price reacts, giving traders an early signal. When the Quick Line peaks and then begins to fade, it indicates that momentum is losing strength. This can precede a pause, a range, or a full reversal in price. Likewise, if the Parametric Oscillator starts to fade while price continues to move, it suggests that momentum is weakening and a reversal or pullback may be approaching.
█ How It Works
⚪ Dual-Lane Displacement
Price is decomposed into trend and fast components across the open, high, low, and close. These relationships form four signed streams that describe body drive and wick aggression.
Calculation: Builds relative spreads between the trend and fast components, creating a multi-dimensional price-flow state.
⚪ Parametric Mapping
Each data stream is passed through a parametric transform (defaulting to a momentum-sensitive map) and assembled into synthetic OHLC in oscillator space.
Calculation: Applies a state transform over the data, aggregates into oscillator OHLC, and exponentially smooths for stability.
⚪ Quick Price Action
A companion line extracts recent trend displacement, normalizes it in a rolling window around the local mid, and passes it through a smoothing process controlled by Price Trend (softness). This yields a stable 0–100 scale that reacts quickly yet remains consistent across assets and timeframes.
Calculation: Windowed normalization around a dynamic midpoint with adjustable softness to balance responsiveness and stability.
-----------------
Disclaimer
The content provided in my scripts, indicators, ideas, algorithms, and systems is for educational and informational purposes only. It does not constitute financial advice, investment recommendations, or a solicitation to buy or sell any financial instruments. I will not accept liability for any loss or damage, including without limitation any loss of profit, which may arise directly or indirectly from the use of or reliance on such information.
All investments involve risk, and the past performance of a security, industry, sector, market, financial product, trading strategy, backtest, or individual's trading does not guarantee future results or returns. Investors are fully responsible for any investment decisions they make. Such decisions should be based solely on an evaluation of their financial circumstances, investment objectives, risk tolerance, and liquidity needs.

Cumulative Delta (Zeiierman)█ Overview
Cumulative Delta (Zeiierman) transforms raw volume and price data into a continuous buying and selling pressure narrative. Instead of treating volume as a static total, it accumulates the net delta (buying vs. selling activity) bar by bar, revealing whether real demand is supporting or contradicting price movement. This tool bridges microstructure-based order flow concepts with high-level market trend modeling, offering a refined look beneath traditional candles.
The indicator visualizes cumulative trade imbalance over time, layering it with adaptive confirmation lines, impulse recognition, and trend filtration. The result is a refined map of volume–price interaction that identifies hidden strength, fading momentum, or early accumulation before visible reversals occur.
This tool is designed for multi-context use — intraday scalping, swing confirmations, or structural bias analysis — offering a precise view of participation flow beneath price behavior.
⚪ Why This One Is Unique
Unlike conventional delta indicators, this version incorporates adaptive smoothing, multi-source delta modeling, and contextual confirmation layers that dynamically adjust based on both volume and price displacement. Its framework is powered by a volume re-normalization algorithm, combined with multi-dimensional weighted mapping between price flow, volume imbalance, and trend inertia.
█ Main feature: Cumulative Delta Candle
The Cumulative Delta Candles visualize how each bar’s internal buying vs. selling pressure builds over time. They represent volume-weighted displacement vectors of market aggression — when buyers dominate, the delta accumulates upward; when sellers dominate, the cumulative curve decays. Signal and confirmation overlays transform this raw delta motion into a structured view of market conviction, helping traders identify early inflows, exhaustion points, or continuation pressure.
█ How to Use
⚪ Trend Following
The Cumulative Delta is an effective tool for identifying who controls the market trend. When delta candles remain above the midline, buyers are in control. Conversely, when delta candles stay below the midline, sellers dominate.
Strong trends are identified when delta candles consistently cluster near the upper or lower levels, indicating sustained directional pressure in that trend’s favor.
⚪ Fading Momentum
The delta can also be used to detect waning momentum. If delta candles are above the midline but turn red with a declining slope, it signals that the current bullish move is losing strength.
If delta candles are below the midline but turn green with an upward slope, it suggests that bearish momentum is weakening.
⚪ Pullback Trading
To identify pullbacks, combine the overall trend of the Cumulative Delta candles with the Signal Line. Set the Signal Line length to 2 to create a fast-reacting delta line suitable for pullback detection.
Bullish Pullback
When the Cumulative Delta remains above the midline or near the upper level, and the Signal Line briefly dips below the midline or touches the lower level before sharply reversing upward, it signals a bullish pullback within an ongoing uptrend — a potential buy opportunity.
Bearish Pullback
When the Cumulative Delta stays below the midline or near the lower level, and the Signal Line briefly rises above the midline or touches the upper level before sharply turning downward, it indicates a bearish pullback within a downtrend — a potential sell opportunity.
⚪ Momentum Trading
Impulse Dots highlight sudden bursts of momentum in either direction.
When they appear around key breakout levels, they may signal the start of a strong move or breakout. However, if impulses appear after an extended trend, they often indicate potential exhaustion or reversal.
Always evaluate impulse signals within the broader market context to confirm their validity.
⚪ Up-Tick and Down-Tick Signals
The Up-Tick Signal confirms a possible shift or strengthening in bullish order flow. It frequently appears near local swing lows, suggesting increased buying pressure.
The Down-Tick Signal confirms potential bearish order flow. It often forms around local swing highs, signaling growing selling pressure.
⚪ Volume Signals
Volume Signals are derived from delta activity to help traders identify volume-based trend entries. They occur only in confirmed trends and serve as trend continuation triggers.
Bullish Volume Signal: When triggered, enter at candle close and use the built-in trailing stop to manage risk. Exit the trade when the Signal Line crosses below the midline again.
Bearish Volume Signal: When triggered, enter at candle close and use the trailing stop to follow the move downward. Exit the trade when the Signal Line crosses above the midline again.
█ How It Works
⚪ Delta Accumulation
Each candle’s internal buy/sell pressure is estimated using a price–volume ratio model. The resulting delta is accumulated over time to form the Cumulative Delta Curve, showing whether buyers or sellers are in sustained control. Users can select Estimated, Volume Data, or Enhanced modes to align the delta calculation with their preferred market source.
Calculation: Applies Cumulative Delta Integration — a continuous summation of signed volume over time with conditional price weighting. This produces a running measure of net buying or selling activity that evolves dynamically with market flow.
⚪ Signal & Confirmation Lines
The Signal Line reacts faster, acting as a short-term direction probe. The Confirmation Line lags slightly, validating the persistence of the delta trend. Crossovers between these lines frequently precede structural price rotations.
Calculation: Implements Multi-Phase Weighted Moving Functions, layering WMA/EMA structures to control smoothness and minimize phase lag between the fast and slow components.
⚪ Impulse & Momentum Bursts
The Impulse Engine detects statistically significant bursts in delta energy — high-magnitude expansions that often precede breakouts or reversals.
Each impulse is colored according to directional bias, helping visualize moments of strong conviction or exhaustion.
Calculation: Uses Impulse Response Functions, nonlinear filters that measure delta acceleration (Δ²δ/Δt²) to isolate momentum shifts and highlight transient bursts in order flow intensity.
⚪ Trend Layer & Filter
A built-in trend filtration algorithm ensures that bullish and bearish signals only appear when aligned with the dominant trend. The Trend Tolerance setting controls how much short-term noise the filter allows before declaring a trend change — effectively balancing agility vs. stability.
Calculation: Applies Trend Vector Regression, estimating directional slope and deviation using log-based least squares modeling to extract the dominant directional vector from noisy flow data.
⚪ VWAP–EMD Trend Core
The main trend estimation engine fuses Volume-Weighted Average Price (VWAP) logic with an Empirical Mode Decomposition (EMD) smoother, creating a non-linear, adaptive response curve. This enhances directional clarity while preserving microstructural sensitivity to shifts in flow balance.
Calculation: Constructs a VWAP–EMD Composite Curve, merging volumetric centroids with intrinsic mode decomposition for adaptive mean tracking and dynamic equilibrium modeling.
⚪ Trailing Stop & Risk Structure
Once a volume-based entry signal appears, a dynamic trailing stop is automatically drawn. It adapts to volatility and follows price movement, helping visualize optimal exit zones, stop hits, and locked profit regions.
█ Any Alert Function Call
The Any Alert Function Call system transforms the indicator into a programmable alert engine:
Combine multiple triggers (Crossover, Trend Flip, Impulse, Tick, TSL Hit, Volume Signal).
Detect slope, midline, or same-direction confirmations.
Customize messages with placeholders like {{ticker}}, {{close}}, {{volume}}, and {{time}}.
Build complex conditional alerts — such as Bull Volume Signal → TSL Hit — without editing the code.
-----------------
Disclaimer
The content provided in my scripts, indicators, ideas, algorithms, and systems is for educational and informational purposes only. It does not constitute financial advice, investment recommendations, or a solicitation to buy or sell any financial instruments. I will not accept liability for any loss or damage, including without limitation any loss of profit, which may arise directly or indirectly from the use of or reliance on such information.
All investments involve risk, and the past performance of a security, industry, sector, market, financial product, trading strategy, backtest, or individual's trading does not guarantee future results or returns. Investors are fully responsible for any investment decisions they make. Such decisions should be based solely on an evaluation of their financial circumstances, investment objectives, risk tolerance, and liquidity needs.
Script de pago

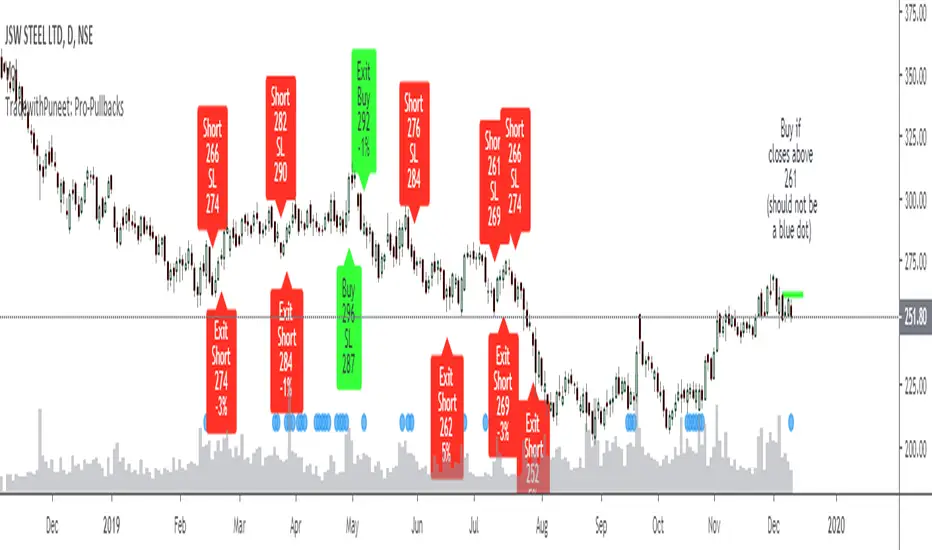
TradewithPuneet: Pro-PullbacksThe Pro-Pullbacks strategy is designed to trade pullbacks . In other words, this strategy will give you:
• BUY signals : When in an already established Uptrend , a stock falls but then resumes its upward trajectory.
• SHORT signals : When in an already established Downtrend , a stock rises but then resumes its downward trajectory.
Through this strategy, we aim to trade in the direction of an already established trend by entering on a pullback. Thus, instead of trying to catch the whole trend, this strategy tries to profit from an already established trend.
The strategy uses certain filters to identify whether the stock is in Uptrend or Downtrend. Next, it identifies pullbacks to an identified trend. Pullbacks are sometimes too short or too deep. This strategy ignores such short & deep pullbacks. Finally, it identifies certain threshold levels (for confirmation), beyond which the stock is expected to resume the original trend. If the stock closes beyond the threshold level, it gives the necessary BUY or SHORT signal.
The strategy guides you the price level at which to enter a trade. You can enter your choice of target profit and stop loss levels.
This strategy is only built for stocks, not for indices or any other financial instrument.
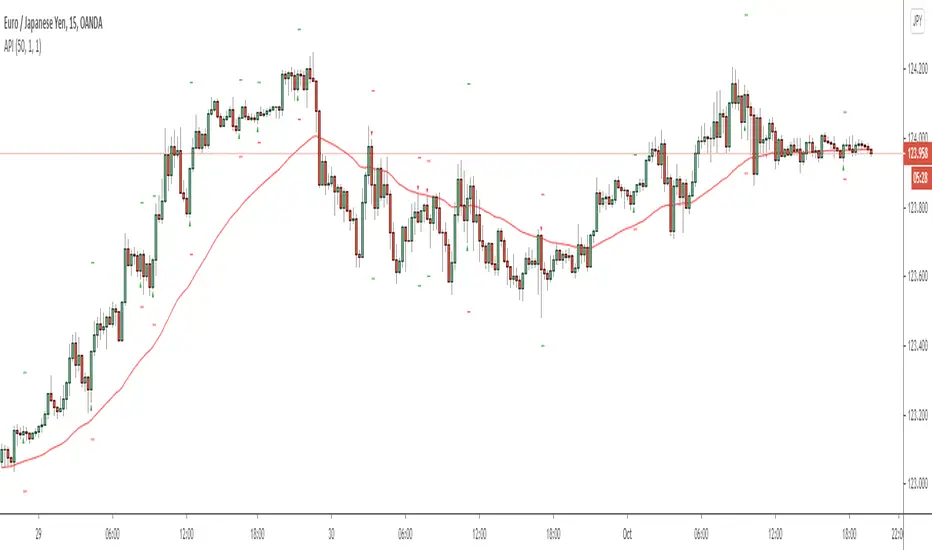
Setting-Less Trend-Step FilteringIntroduction
Indicators settings have been a major concern in trading strategies, in order to provide the best results each indicators involved in the strategy must have its settings optimized, when using only 1 indicator this task can easily be achieved, but an increasing number of indicators involve more slower computations, lot of softwares will use brute force for indicators settings optimization, this involve testing each indicator settings and see which setting/combination maximize the equity, in order to fasten this process softwares can use a user defined range for the indicator settings. Nonetheless the combination that maximize the equity at time t might be different at time t+1...n .
Therefore i propose an indicator without any numerical setting that aim to filter small price variations using the architecture of the T-step lsma, such indicator can provide robust filtering and can therefore be used as input for other indicators.
Robustness Vs Non Robustness
Robustness is often defined as the ability of certain statistical tools to be less affected by outliers, outliers are defined as huge variations in a data-set, high volatility movements and large gaps might be considered as outliers. However here we define robustness as the ability of an indicator to be non affected by price variations that are not correlated with the main trend, which can be defined in technical analysis as pullbacks.
Some small pullbacks in INTEL, the indicator is not affected by them, which allow the indicator to filter the price in a "smart" way.
This effect is made possible by using exponential averaging in the indicator, exponential averaging is defined as y = sc*x + (1-sc)*y , with 1 > sc > 0 . Here sc is calculated in a similar way as the kalman gain, which is in the form of a/(a + b) , in our case this is done with :
sc = abs(input - nz(b ))/(abs(input - nz(b )) + nz(a ))
Non Robust Version Of The Indicator
The user is allowed to use the non robust version of the indicator by unchecking "robust" in the setting panel, this allow a better fit with the price at the cost of less filtering.
robust checked
robust unchecked
Conclusion
I proposed a technical indicator that aim to filter short frequencies without the use of parameters, the indicator proven to be robust to various pullbacks and therefore was able to follow the main trend, although using the term trend for such small price variations might be wrong. Removing high frequencies is always beneficial in trading, noisy series are harder to manipulate, this is why you'll see a lot of indicators using median price often defined as hl2 instead of the closing price.
Like previous settings-less indicators i published this one can behave differently depending on the time frame selected by the user, lower time frames will make the indicator filter more. I'll try to make more setting-less indicators that will correct this effect.
Acknowledgements
The support and interest of the community is only thing that allowed me to be where i'am today, i'am thankful. Special thanks to the tv staff, LucF, and my family who may not have believed in this project but are still proud of their son.

Ultimate Pullback IndicatorWhat is the Ultimate Pullback Indicator?
This indicator detects pullback trading opportunities by analyzing price action in a very specific manner.
By combining simple trend filters with various advanced candlestick patterns it detects high-probability trend-continuation setups (and optional exits).
If you use this script to set alerts then you will never miss a pullback trading opportunity ever again!
I personally use this indicator to profitably trade pullback signals in the forex markets on multiple timeframes, from the 15-Minute chart to the 4-Hour and Daily chart.
For more information visit my website: The Ultimate Pullback Indicator .
How Do I Access It?
I currently use this script to trade live money in the forex markets, but I’m also constantly testing and improving it. Therefore this is a constant work-in-progress and I’m always taking meticulous care to make it better.
That’s why this is a premium script that requires payment to access. The other advantage of charging for it is that it retains exclusivity to only a select few dedicated traders.
You can access the script by purchasing a monthly subscription on my website .
If you don’t want to pay for this script then I completely understand and I have plenty of other free scripts that you might be interested in!
Free Trial
I’m a trader myself and so I know how skeptical you might be that this indicator is worth your time and money.
That’s why I am offering a free 14 day trial of the indicator. All you need to do to initiate your trial is Join My Mailing List!
How It Works
When price is above the 50-EMA the script will wait for a pullback of at least two red candles. Once that condition is met, it begins searching for advanced entry patterns.
The opposite is true for short trades – price must be below the 50-EMA and must pull back by at least two green candles before it will begin searching for entry reasons.
Once it detects a valid entry reason it will draw a green arrow (for longs) or a red arrow (for shorts) as well as your stop loss and target price (the red and green lines).
But these settings can be customized however you like. You can change the EMA to any period you want, you can adjust your stop loss distance, you can enable or disable the entry and exit reasons as you wish, and you can adjust the rules for some of the patterns.
For a full list of features and visual examples visit the indicator page on my website: The Ultimate Pullback Indicator .

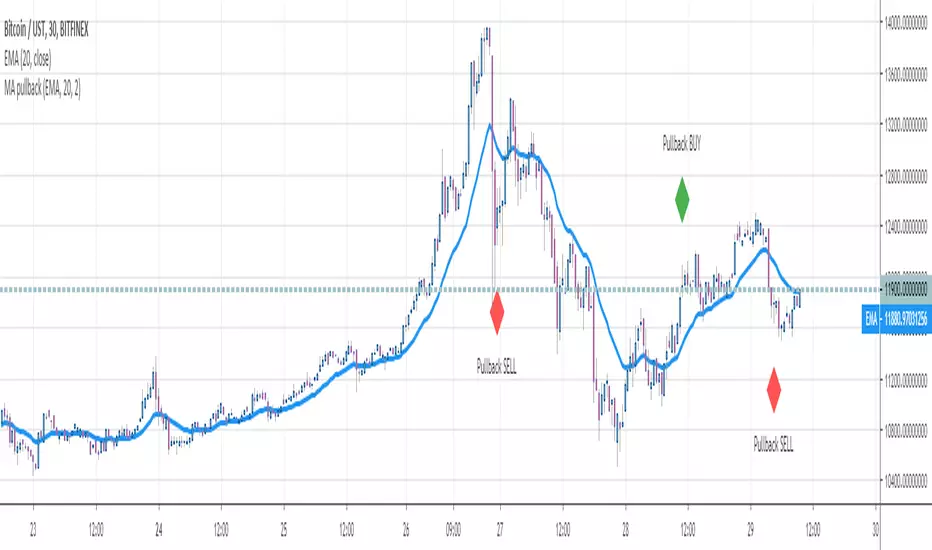
MA pullbackHello traders
This is a script to detect a pullback on a all standard types of moving averages
You'll have the option to define two parameters a bit specific :
Pullback percentage : if you want the pullback to be defined in percentage. Example: I want to capture pullbacks 3% away from my EMA 20
Buffer : Secruty margin for the pullback. You might not want an exact physical touch on the pullback but to let for instance a few pips/USD margin between the price and moving average
If you'd like the pullback to be "price has to touch the moving average", please set the buffer parameter to 0
Enjoy
Dave

Pullback SP-Strategy#9This is my interpretation of Steven Primo's pull back strategy indicator # 9. Seems to work on any time frame or combination high and low. I prefer to use it with the regular fractals and a 20 or 50 SMA and 5 period RSI. I would prefer to have it only paint up arrows when bars close above the SMA and vise versa with down arrows. If someone can help me correct that please contact me.
Thanks, 1776er.

Sizing GuideThis indicator helps you defining your max sizing, depending on the max $$$ amount you're willing to risk against a specific exponential moving average (or VWAP, default is the 13ema).
You can define your max risk amount and your max allowed sizing. The indicator would suggest the best sizing in order to risk only up to the amount you are comfortable with on a potential trade.
Moreover, the column bar would turn yellow/red if the divergence is above a certain threshold (default are yellow > 1.50% and red > 2.75%, green otherwise).

Honeybee59-stock 2.0Honeybee59-stock for TradingView gives you abilities to see the stories hiding in the graphs of stocks. It counts CC59 and creates respectable support and resistance levels as well as marks and reminds you about important parameters that are happening in the graph so that you will not forget to consider them before placing orders. This set of tools is a simplified version of Graph Reader Pro for TradingView customized for planning your investments in stocks.
Features:
*Automatic CC59 counting that compares the close of the right price bar to that of left price bar in a group of 5 consecutive bars (ignoring 3 bars in the middle). If the right bar closed higher, the count positive number would be printed above the bar. If the right bar closed lower, the count negative number would be printed below the bar. Nine consecutive series of up counts will define the lowest price as CC59 support line and nine consecutive series of down counts will define the highest price as CC59 resistance line. The counted numbers, support and resistance lines are automatically printed on the graph if enabled.
* Draw a reconfigurable simple moving average ( MySMA ) yellow line. The default setting is SMA3.
* Draw a popular SMA13 line (light blue).
* Draw a pullback level line (pink) near the beginning of a possible new trend.
* Print "C>MySMA" or "C70" and "RSI<70" for RSI(14) that crosses above 70 % and below 70 %.
* Print "RSI<30" and "RSI>30" for RSI(14) that crosses below 30 % and above 30 %.
* Print "Max" and "Min" for local maximum and local minimum bars.
* Print "Gap" when there is a gap between neighboring price bars. The opened gaps are often closed later on. Hence, they are milestones for the price to come back and close them up.
* Print "MACD>Sig" and "MACD Dark".
For free TradingView plan, you can add two more indicators to the chart. That means you may add RSI and MACD indicators with same parameters as those setup in Honeybee59-stock to your graph. DrGraph regularly publishes his educational ideas on using features provided in Honeybee59-stock for profitable investments. You can follow him for how to use the tools in trading stocks.

CCI Colored Candles / Bars w/ HistogramColor of your candles matches your CCI with Histogram indicator and trend line. CCI EMA or SMA based option, traditional or modern formula calculation options ect. Can change Length, source, Trigger Lines, colors of candles and histogram and more
The CCI compares the current price to an average price over a period of time. The indicator fluctuates above or below zero, moving into positive or negative territory. While most values, approximately 75%, will fall between -100 and +100, about 25% of the values will fall outside this range, indicating a lot of weakness or strength in the price movement.
A basic CCI strategy is used to track the CCI for movement above +100, which generates buy signals, and movements below -100, which generates sell or short trade signals. Investors may only wish to take the buy signals, exit when the sell signals occur, and then re-invest when the buy signal occurs again.
The CCI compares the current price to an average price over a period of time. The indicator fluctuates above or below zero, moving into positive or negative territory. While most values, approximately 75%, will fall between -100 and +100, about 25% of the values will fall outside this range, indicating a lot of weakness or strength in the price movement.
When the CCI is above +100, this means the price is well above the average price as measured by the indicator. When the indicator is below -100, the price is well below the average price.
1 CCI strategy is used to track the CCI for movement above +100, which generates buy signals, and movements below -100, which generates sell or short trade signals. Investors may only wish to take the buy signals, exit when the sell signals occur, and then re-invest when the buy signal occurs again.
Long-term chart is used to establish the dominant trend, short-term chart establishing pullbacks and entry points into that trend. A multiple timeframe strategy is commonly used by more active traders and can even be used for day trading, as the "long term" and "short term" is relative to how long a trader wants their positions to last.
When the CCI moves above +100 on your longer-term chart, this indicates an upward trend, and you only watch for buy signals on the shorter-term chart. The trend is considered up until the longer-term CCI dips below -100.
When using a daily chart as the shorter timeframe, traders often buy when the CCI dips below -100 and then rallies back above -100. It would then be prudent to exit the trade once the CCI moves above +100 and then drops back below +100. Alternatively, if the trend on the longer-term CCI turns down, that indicates a sell signal to exit all long positions.
When the CCI is below -100 on the longer-term chart, only take short sale signals on the shorter-term chart. The downtrend is in effect until the longer-term CCI rallies above +100. The chart indicates that you should take a short trade when the CCI rallies above +100 and then drops back below +100 on the shorter-term chart. Traders would then exit the short trade once the CCI moves below -100 and then rallies back above -100. Alternatively, if the trend on the longer-term CCI turns up, exit all short positions.
Make the strategy more stringent by only taking long positions on the shorter time frame when the longer-term CCI is above +100. This will reduce the number of signals, but will ensure the overall trend is very strong.
Entry and exit rules on the shorter timeframe can also be adjusted. if the longer-term trend is up, you may allow the CCI on the shorter-term chart to dip below -100 and then rally back above zero (instead of -100) before buying. This will likely result in a paying a higher price, but offers more assurance that the short-term pullback is over and the longer-term trend is resuming.

9 20 50 200 EMAsAll four 9 20 50 200 EMAs to save indicator space and have the most reliable, recognized and respected EMAs. For day trades i consider 9 and 20 EMAs pullbacks on 5 min charts when in overall uptrend . 50 EMA determines if in up or down trend by being above or below (50 EMA was be sloping up or down.
200 EMAs great support and resistance along with the slope of these EMAs are telling a strory, I also use EMA Boillinger Bands along with TTM Trend, Wave A & B , MFI, Volume Weighted MACD, VWAP, and Stoch RSI
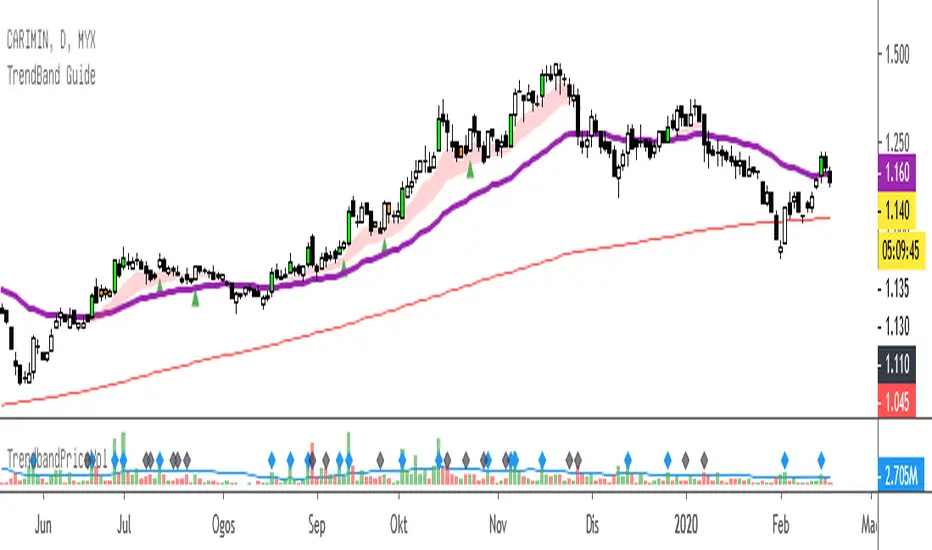
TrendBand GuideTrendBand Guide - simple way to analyse current chart trend.
Basic of usage:
1. TrendBand Color
Red : Chart in bullish condition
Green : Chart in bearish condition
Purple Line : Current trend direction
Red Line : Long term trend direction
2. Candle Color
Green Lime : Breakout 20 days high with more than average volume.
Red : Oversold condition base on RSI (14) days - below 35.
Note :
All color can be change from format menu.
When TrendBand in RED, find any breakout or pullback setup.
When TrendBand in Green, it show weakness in trend..find any potential rebound setup.
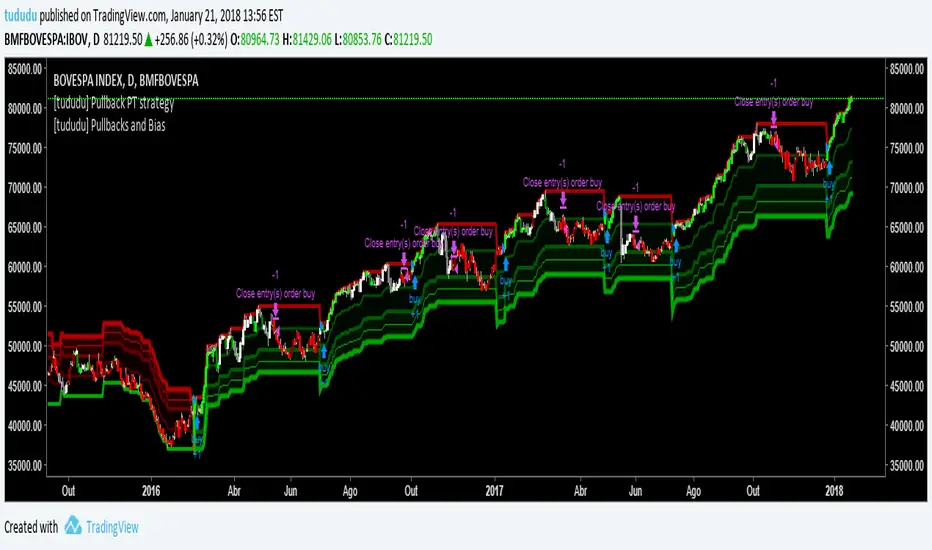
[tududu] Pullbacks and Directional BiasQuick analysis for TRENDING markets. This script tracks trend and 3 pullbacks ranges from n-bar max/lows.
Pullback values are floats so ranges can be < 1% for intraday trading. On top of it, it also provides non-lagging "directional bias" candle colors by tracking the earliest possible swing highs.
Also, thanks for the 100+ likes on my previous script ("Day Trade Suite").
---
Script para análise de mercados em tendência. O script marca 3 faixas de pullbacks a partir das máximas ou mínimas de x-barras (valores precisam ser manualmente ajustados para diferentes mercados, mas em uma próxima versão pretendo incluir algum tipo de análise automatizada de volatilidade).
Programado para timeframe diário, porém é possível configurar as faixas de pullback para menos de 1% (ex. 0.5) para daytrade. Além disso, o script também fornece barras de cores direcionais com pouco atraso, detectando swing highs em formação.
Obrigado por todas as curtidas no meu script anterior ("Day Trade Suite") !
Aggressive Pullback IndicatorThis indicator is designed to be used with the rules of Steven Hart's Aggressive Pullback Strategy. It is intended for use on the 4-hour timeframe of certain currency pairs, but will work on all timeframes and instruments. The rules are customizable, but the default settings are designed to reflect the rules of Steven's pullback strategy as closely as possible.
To enable alerts: Add the indicator to the chart and create a new alert with the settings Condition: API , Frequency: Once Per Bar (on Close).
Feel free to message me if you have any questions :)
- Matt.
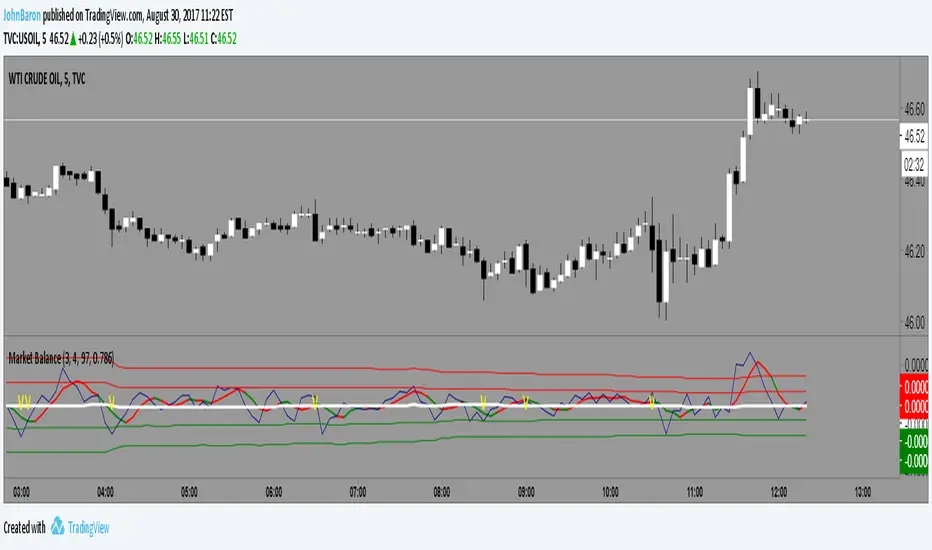
Market BalanceThis indicator simply tracks the balance of the supply/demand and will always revert to the mean.
If the market is over bought it will move above the mean, hit a limit and come back toward the mean. Opposite for oversold.
The difference between this and MFI or RSI is that a market can move up or down in an organized fashion and stay close to the mean. It is impulsive moves up or down that will correct.
So a trader might be able to gauge whether an given stock has the likelihood to pullback or bounce based on this indicator.
The color indicator attempts to predict the color of the next bar.
Works well with Heiken Ashi style candles as well.
Aggressive Pullback IndicatorThis indicator is designed to be used with the rules of Steven Hart's Aggressive Pullback Strategy. It is intended for use on the 4-hour timeframe but will work on all timeframes. The rules are customizable, but the default settings are:
Minimum Candle Pullback: 2
How Many Candles We Can Engulf: 3
Override Rule #2 If Candle's Body % of ATR Is Less Than: 99%
ATR Length: 14
EMA Length (close): 50
How Far To Look Back For Swings: 5 bars (this is used to invalidate engulfing candles that close above the swing high/lows that started the 2 candle pullback)
Visit www.thetradingchannel.net or www.youtube.com for information on how to use the strategy correctly (and profitably)!
* Note that like all indicators, it is not 100% accurate and will miss some signals. But it does catch the majority of them :)

Pullback Trading Tool R5-65 by JustUncleLBy request this is an updated version of the "PullBack Trading Tool": removes experimental "OCC" channel, added option to display ribbons or just single moving average lines, added alert arrows for "PB" exits, added alertcondition for TV alarm subsystem, added some extract options for Pivot points and general cleanup of code.
Description:
This project incorporates the majority of the indicators needed to analyse and trade Trends for Pullbacks, swings and reversals.
Incorporated within this tool are the following indicators:
1. Major industry (Banks) recognised important EMAs in an EMA Ribbon:
Lime = EMA5 (Optional Display)
DodgerBlue = EMA12 (Optional Display)
Red = EMA36 (Optional display)
Green = EMA89
Blue = EMA200
Black = EMA633
2. The 5 EMA (default) High/Low/Close Price Action Channel (PAC), the PAC channel display is disabled by default.
3. Optionally display Fractals and optional Fractal levels
4. Optional HH, LH, LL, HL finder.
5. Optional Buy/Sell "PB" exit Alerts with Optional 200EMA filter.
6. Coloured coded Bar high lighting based on the PAC:
blue = bar closed above PAC
red = bar closed below PAC
gray = bar closed inside PAC
7. Alert condition sent to TradingView's Alarm subsystem for PB exits.
8. Pivot points with optional labels.
9. EMA5-12 Ribbon is displayed by default.
10.EMA12-36 Ribbon is displayed by default
Set up and hints:
I am unable to provide a full description here, as Pullback Trading incorporates a full trading Methodology, there are a number of articles and books written on the subject.
Set the chart to Heikin Ashi Candles (optional).
I also add a "Sweetspot Gold R3" indicator to the chart as well to help with support and resistance finding and shows where the important "00" lines are.
First on a weekly basis say Sunday night or Monday morning, analyse the Daily and Weekly charts to establish overall trends, and support/resistant levels. Draw significant mini trend lines (2/3 TL), vertical trend lines (VTL) and S/R levels. Can use the Pivots points to guide VTL drawing and Fractals to help guide 2/3 TL drawing.
Once the trend direction and any potential major reversals highlighted, drop down to lower timeframe chart and draw appropriate mini Trend line (2/3 TL) matching the established momentum direction. Take note of potential pull backs from and of the EMAs, in particular the EMA5-12 ribbon, EMA12-36 Ribbon and the 200EMA. Can use the Pivots and/or Fractals points to guide your 2/3 TL drawing.
Set a TradingView alarm on the "PBTOOL alert", with the default settings this normally occurs before or during the Break of the manually drawn TL lines.
Once alerted check to see if the TL is broken and is returning to trend away from the EMA lines, this is indicated by bar colour change to trend directional colour.
You can trade that alert or drop down to even lower time frames and perform the same TL analysis there to find trades at the lower TF. Trading at lower TF you will allow tighter Stop loss settings.
Other than the "SweetSpot Gold R3" indicator, you should not need any other indicator to successfully trade trends for Pullbacks and reversals. If you really want another indicator I suggest a momentum one for example: AO ( Awesome Oscillator ), MACD or Squeeze Momentum.

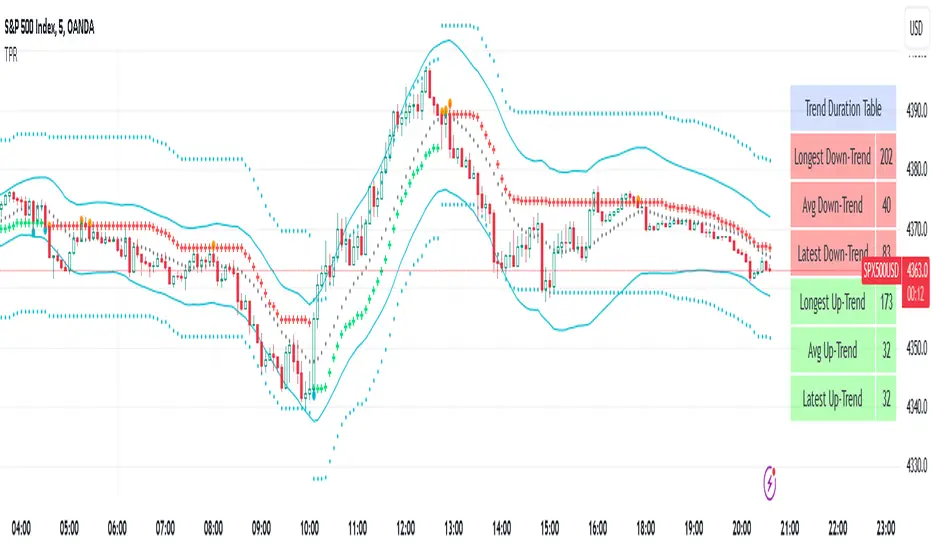
Trend Pullback Reversal TPRThe TPR(Trend Pullback Reversal) indicator forms a possible price trend with support and resistance lines. It also comes with a unqiue band and center line as additional features.
TPR works on all timeframes and all symbols and all type of bar chart.
TPR never repaints.
There are 4 Parameters:
Period: umber of bars used for calculations
Factor: Multiplier factor, small number for short trend, large number for long trend
Source: the input series, default is Close
ShowBand: enable to show band and center line
Most trend indicators have similar plot, the difference is where and when they change the direction. Unlike other trend indicators, TPR will focus on main trend and filter out most minor price movements. The green cross-line represents an uptrend, the red cross-line represents a downtrend.
The additional band and center line may look like bollinger band, but the TPR band algorithm is completely different from bollingerband. There is no standard deviation in TPR band calculation.
UCS-Probability to BounceHey All,
This is an indicator I was developing over the last year. Over some extreme testing and good test results. I am confident to add this to the pool of my indicators.
Yes, this is a protected script. Contains some intensive research.... and every value here is manipulated to fit a general context. Therefore, treat this just like any of my indicator.
If you want to know further about how i use. comment below......

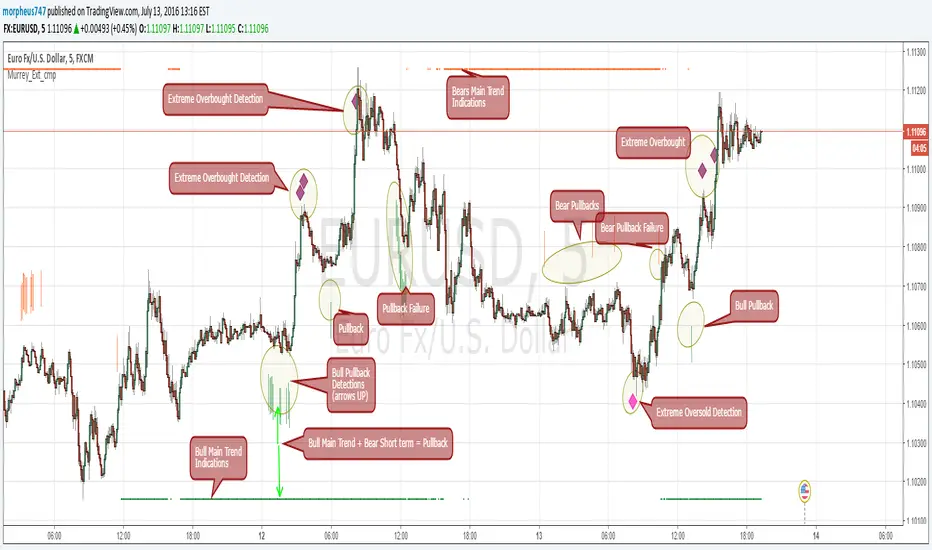
Murrey Math Extremes ComparatorHOW IT WORKS
Creates two murrey math oscillators (hidden) one with 256 length another with 32 length and compare each other.
WHAT GIVE ME THIS SCRIPT
The script can give you very valuable information:
- Main Trend
- Pullbacks detections
- Extreme overbought oversold prices alerts
- Divergences
- Any timeframe usage
REFERENCES OF USAGE
Main Trend Indications
****The main trend is indicated with green(bull) or red(bears) small "triangles" on the bottom(bull) or the top(bears) of the chart.
*****To detect the Bull/Bear major trend the script use 256 murrey, if > 0 (green) we are uptrend in other cases we are downtrend
Pullback detection
****The pullbacks are indicated with Green(bull) or red(bears) medium "Arrows"
*****To detect pullbacks the system compare the long term murrey with the short term murrey, if long term is Green(green triangles)
*****so we are in a main bull trend, if the short term murrey make an extreme low then the pullback is indicated
*****The same for the short pullback, if long term murrey is RED and we have an extreme green short term murrey we shot a red arrow
Extreme Overbught/Oversold
****The extreme OO is indicated with fancy diamonds
*****To detect the Extremes price movements we combine the two murrey, if Long Term Murrey is overbought and short term murrey too
*****Then the diamond show on the screen obove or below based on the extreme if overbought or oversold
Strategy Resume:
Triangles indicate Major Trend Up/Down
Arrows Indicate Continuation pullbacks
Diamonds Indicate Extreme Prices
GUIDE HOW TO IMAGES
How it's works Behind Scene
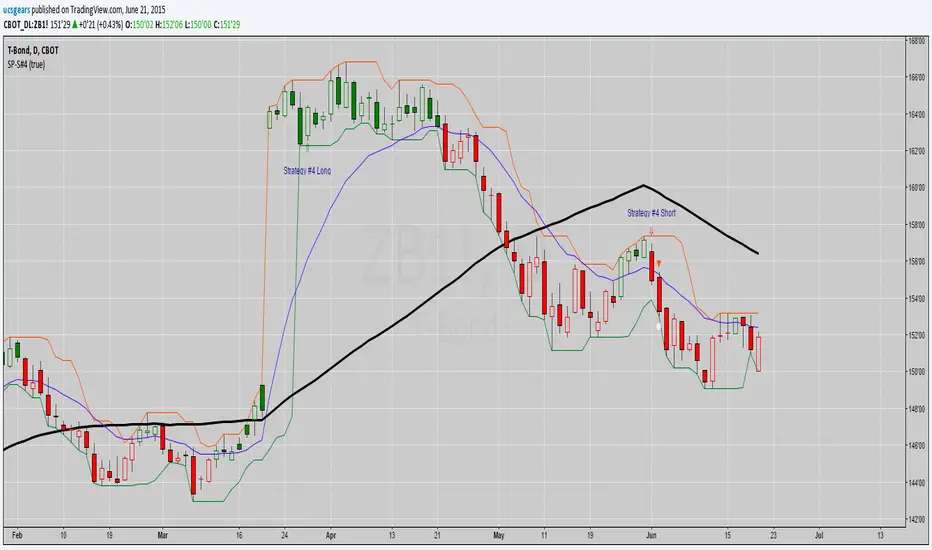
UCS_S_Steve Primo - Strategy 4 - Version 2For those who are interested with this strategy, Here is a better version.